The Open University’s repository of research publications
and other research outputs
Characterization of inelastic strain in type 316H
austenitic stainless steel using electron backscatter
diffraction
Thesis
How to cite:Unnikrishnan, Rahul (2019). Characterization of inelastic strain in type 316H austenitic stainless steel using electron backscatter diffraction. PhD thesis The Open University.
For guidance on citations see FAQs.
c
2018 The Author Version: Version of Record
Copyright and Moral Rights for the articles on this site are retained by the individual authors and/or other copyright owners. For more information on Open Research Online’s data policy on reuse of materials please consult the policies page.
316H austenitic stainless steel using electron
backscatter diffraction
By
Rahul Unnikrishnan
Faculty of Science, Technology, Engineering & Mathematics
School of Engineering & Innovation
This dissertation is submitted for the degree of
Doctor of Philosophy
1
ABSTRACT
Type 316H austenitic stainless steel is widely used in the UK’s advanced gas-cooled reactors, for example in boiler components, due to its good corrosion, creep and fatigue properties at temperatures around 550oC. The influence of service conditions such as the
type of loading, strain rate, load and temperature histories and the environment have to be considered in assessing the remaining safe lifetime of plant operating at high temperature, so that fatigue and creep-fatigue damage can be quantified to ensure that the material will still be able to withstand the required future loads in the creep-fatigue-damaged condition.
Electron backscatter diffraction (EBSD), which can measure crystallographic orientations in polycrystalline materials, has been used to quantify and map inelastic strains in materials in terms of metrics derived from the local orientation changes or by calculating the geometrically necessary dislocation densities. This thesis explores the potential of EBSD for characterizing localised inelastic strain from lattice orientation measurements during uniaxial stress relaxation and cyclic loading.
The study was conducted on ex-service Type 316H austenitic stainless steels, through a series of monotonic tests under tensile primary load, secondary stress relaxation and under low cycle fatigue/creep-fatigue conditions. The EBSD metrics termed kernel average misorientation (KAM), grain orientation spread (GOS), low-angle boundary fraction (LABF) and deformed grain fraction (DGF) all showed a linear variation with inelastic strain accumulation in both tensile and cyclic tests. In contrast the proportion of twin boundaries reduced with increasing inelastic strains. This study demonstrated that the development of misorientation depends on the temperature and precipitate
2
distribution. The misorientation developed in solution annealed material was much lower than that in ex-service material. Near grain boundaries, the local misorientations were found to increase with increasing stress relaxation and cavities were identified from secondary electron images. A misorientation-based strain assessment method considering the deformed grain fraction was found to be more consistent than using mean misorientation values as this reduced the scatter associated with inhomogeneities in grain size. After tensile deformation at different strains and cyclic deformation at different strain ranges, a good correlation was found between the behaviour of different EBSD metrics and the measured mean microhardness. However, hardness measurements did not clearly detect the inelastic strain developed during stress relaxation and cyclic strain accumulation (i.e. the strain accumulated over different numbers of cycles). Scanning transmission electron microscopy showed the dislocations in tensile samples after stress relaxation to form homogeneous diffuse cell structures, and clear cell structures were also evident after cyclic deformation. The cell structures elongated to veins with further cyclic strain accumulation.
Local misorientation maps were used to study the inelastic deformation around a reheat crack in an ex-service component. The EBSD misorientation maps showed good correlation with microhardness maps. Local misorientation maps showed strain accumulation along grain boundaries. Comparison with Small Angle Neutron Scattering (SANS) cavitation measurements showed that the areas with more cavities had higher local misorientations. Although stress concentration at grain boundaries is well documented, such a relationship between high local misorientation and cavitation has never been seen before in austenitic materials subject to stress relaxation.
3
ACKNOWLEDGEMENTS
Firstly, I would like to express my sincere gratitude to my supervisors Dr Shirley M Northover, Prof. P John Bouchard and Dr Hedieh Jazaeri for the continuous support of my PhD study and related research, for their patience, motivation, and immense knowledge. Their guidance helped me in all the time of research and writing of this thesis. I could not have imagined having better supervisors for my PhD study.
I acknowledge the financial support from EDF energy, UK and the Open University. I would like to thank Dr David Dean, Mr Mike Spindler, Mr Jacob Knight and Dr Sarah Spindler of EDF Energy for their useful discussions in shaping the research project. My special gratitude to Dr Richard Moat for the helpful discussions. I am also grateful to Dr Thomas Simm, Swansea University for help with EBSD analysis using MTEX.
I would like to thank Mr. Damian Flack and Mr. Peter Ledgard for their help with the specimen machining, Mr. Gordon Imlach for his assistance in using SEM, Dr Igor Kraev for his assistance in using TEM and Dr Felicity Williams for her assistance in metallography. My special thanks to Mr Stan Hiller for his assistance with the mechanical testing. I would also like to thank Mrs. Olivia Acquah and Mrs. Donna for their assistance with the administrative works throughout the PhD.
Thanks to all my colleagues during this period, Jino, Shanmukha, Anas, Yadu, Avishek, Paheli, Beverly, Yeli, Ellies, Abdullah, Sanjoo, Gerardo, Jeferson, Rodolpho, Xinfang, Johannas, Mushfique and other friends and their family for their friendship and support during my stay. Special thanks to Anas for help with MATLAB codes.
4
I would like say a heartfelt thanks to my beloved parents Mr.Unnikrishnan Nair and Mrs. Bindu R Nair, my sister, Arundhathy, my grandparents and Mr. Harikumar Nair and family for their love, support, and sacrifices.
Last but not the least, my sincerest appreciation is reserved for my wife Lakshmi for her unconditional love.
5
PREFACE
This thesis is submitted for the degree of Doctor of Philosophy of The Open University, United Kingdom. The research described herein was conducted in the School of Engineering & Innovation, Faculty of Science, Technology, Engineering and Mathematics between January 2015 and April 2018 under the supervision of Dr Shirley M. Northover, Prof. P. John Bouchard and Dr Hedieh Jazaeri.
This work is original to the best of my knowledge, except where reference is made to the work of others. This work has not been submitted in whole or part for any other degree at any other university. Part of this work has been published in an academic journal and presented at conferences as listed below:
Unnikrishnan R, Northover S M, Jazaeri H, Bouchard P J, (2016), “Investigating plastic deformation around a reheat-crack in a 316H austenitic stainless steel weldment by misorientation mapping”. Procedia Structural Integrity 2, 3501-3507
EBSD analysis of strain-controlled high temperature low cycle fatigue deformation in service-aged type 316H austenitic stainless steel, 4th International ECCC Creep & Fracture Conference, 10th-14th September 2017, Düsseldorf, Germany (Poster presentation)
An EBSD misorientation study of inelastic strains during high temperature low cycle fatigue deformation of type 316H austenitic stainless steel, Electron Backscatter Diffraction Meeting, 4th-5th April 2017, University of Oxford, United Kingdom. (Oral presentation)
6
An EBSD misorientation approach to quantify inelastic strain during creep-fatigue of type 316H austenitic stainless steels, Oxford Instruments EBSD Symposium, 2nd-3rd November 2016, Stockholm, Sweden (Oral presentation)
An EBSD misorientation approach to investigate the grain strain distribution around a reheat crack in 316H austenitic stainless steel, 21st European Conference
on Fracture, 20th-24th June 2016, Catania, Italy (Oral presentation)
7th International conference on Creep, Fatigue and Creep-Fatigue Interaction,
19th-22nd January 2016, Indira Gandhi Centre for Atomic Research, Kalpakam, Chennai, India (Poster presentation)
A lattice misorientation approach to quantify inelastic strains during creep-fatigue deformation of 316H austenitic stainless steel, BSSM Postgraduate Experimental Mechanics Conference, 19th -20th November 2015, University of Southampton, United Kingdom (Oral presentation)
Condition monitoring of structural components in nuclear power plants by electron backscatter diffraction, Universities Nuclear Technology Forum, 31st March - 2nd April 2015, The Open University, Milton Keynes, United Kingdom (Oral presentation)
7
TABLE OF CONTENTS
ABSTRACT ... 1 ACKNOWLEDGEMENTS ... 3 PREFACE ... 5 TABLE OF CONTENTS ... 7 LIST OF ABBREVIATIONS ... 12 CHAPTER 1 ... 15 INTRODUCTION ... 15 1.1. Background ... 151.2. Purpose of this study ... 17
1.3. Structure of thesis ... 18
CHAPTER 2 ... 20
LITERATURE REVIEW... 20
2.1. Introduction ... 20
2.2. Type 316H Austenitic stainless steel ... 20
2.2.1. Precipitation in austenitic stainless steel ... 24
2.2.2. Plastic deformation in austenitic stainless steel ... 27
2.3. Creep deformation in austenitic stainless steel ... 31
2.3.1. Dislocation structures formed during creep ... 32
2.3.2. Deformation Mechanism Maps ... 33
2.3.3. Microstructural changes due to creep ... 35
2.3.4. Mechanisms of creep deformation ... 36
2.3.5. Stress relaxation in metals ... 37
2.3.6. Dynamic strain ageing in austenitic stainless steels ... 39
2.4. Fatigue and Creep-fatigue deformation in austenitic stainless steel ... 41
2.4.1. Factors affecting the fatigue/creep-fatigue endurance of 316SS ... 44
2.4.2. Calculation of creep-fatigue damage ... 48
2.5. Reheat cracking and cavitation in 316H steel ... 51
8
2.6.1. Metallurgical based methods ... 53
2.6.2. Macroscopic techniques ... 53
2.6.3. Techniques based on physical properties ... 55
2.7. Electron Backscatter Diffraction ... 57
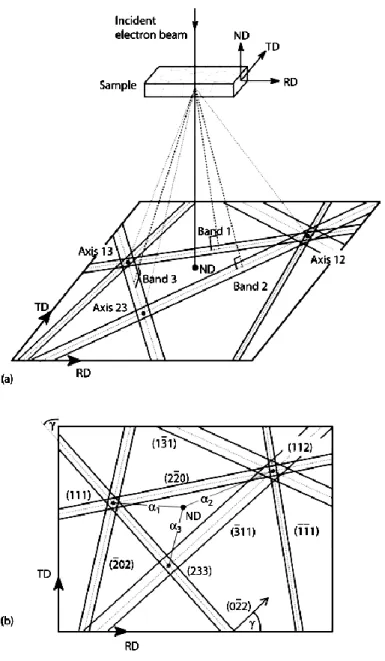
2.7.1. EBSD working principle ... 57
2.7.2. Effect of strain on EBSD patterns ... 61
2.8. Previous studies on EBSD and inelastic strains ... 63
2.8.1. EBSD and plastic deformation ... 63
2.8.2. EBSD and creep deformation ... 64
2.8.3. EBSD and cyclic deformation ... 64
2.8.4. EBSD to study local damage around weldments and cracks ... 66
2.9. Summary and limitations of the literature ... 67
CHAPTER 3 ... 69
EXPERIMENTAL TECHNIQUES ... 69
3.1. Introduction ... 69
3.2. Mechanical testing ... 70
3.2.1. Uniaxial tensile tests ... 70
3.2.2. Cyclic tests ... 73
3.3. Microstructure characterization ... 75
3.3.1. Optical Microscopy ... 75
3.3.2. SEM ... 76
3.3.3. Energy Dispersive X-ray Spectroscopy (EDS)... 78
3.3.4. Scanning Transmission Electron Microscopy (STEM) ... 79
3.4. Electron Backscatter Diffraction (EBSD) characterization ... 80
3.4.1. Sample extraction and preparation ... 80
3.4.2. EBSD acquisition settings ... 80
3.4.3. EBSD data analysis ... 81
Grain based methods ... 82
Kernel scale method ... 84
9
3.5. Hardness measurements ... 89
3.6. X-ray peak profiling ... 90
3.7. Summary ... 91
CHAPTER 4 ... 92
CHARACTERIZATION OF THE INITIAL MATERIAL ... 92
4.1. Introduction ... 92
4.2. Materials ... 92
4.2.1. 316H austenitic stainless steel ... 92
4.2.2. Ex-service 316H austenitic stainless steel weldments ... 95
4.3. Material Characterization ... 96
4.3.1. Characterization of Microstructures ... 96
4.3.2. Characterization of dislocation structures... 105
4.3.4. Grain size ... 109
4.3.5. Texture analysis ... 112
4.3.6. Tensile Properties ... 114
4.4. Summary ... 116
CHAPTER 5 ... 117
MISORIENTATION DEVELOPMENT UNDER UNIAXIAL LOADING ... 117
5.1. Introduction ... 117
5.2. Influence of temperature, strain rate and microstructure on misorientation development (in ex-service, re-solution heat treated and thermally aged steel materials) ... 118
5.2.1. Tensile tests... 118
5.2.2. EBSD measurements ... 119
5.2.3. Mechanical test results ... 119
5.2.4. EBSD results ... 121
5.2.5. Discussion ... 125
5.3. The influence of plastic strain and stress relaxation on misorientation development ... 127
5.3.1. Mechanical tests ... 127
10
5.3.4. EBSD results ... 131
5.3.5. Discussion ... 141
5.4. Summary ... 147
CHAPTER 6 ... 148
CYCLIC DEFORMATION: EFFECT OF STRAIN RANGE, DWELL, TEMPERATURE AND PRECIPITATES ON MISORIENTATION DEVELOPMENT ... 148
6.1. Introduction ... 148
6.2. Influence of strain range and dwell on misorientation development ... 149
6.2.1. Mechanical tests ... 149
6.2.2. EBSD measurements ... 150
6.2.3. Quantifying damage in cyclic deformation ... 150
6.2.4. Results... 151
6.2.5. Discussion ... 170
6.3. Influence of temperature and precipitates on misorientation development ... 177
6.3.1. Mechanical tests ... 177
6.3.2. EBSD and Nano-hardness measurements ... 177
6.3.3. Results... 178
6.3.4. Discussion ... 189
6.4. Summary ... 194
CHAPTER 7 ... 195
EFFECT OF CYCLIC STRAIN ACCUMULATION ... 195
7.1. Introduction ... 195
7.2. Ex-service material (Material C) ... 196
7.2.1. Mechanical tests ... 196
7.2.2. EBSD measurements ... 196
7.2.3. Results... 197
7.3. Solution annealed and thermally aged material (Material E) ... 209
7.3.1. Mechanical tests ... 209
11
7.3.3. Results ... 209
7.4. Discussion ... 213
7.4.1. Cumulative inelastic strains and EBSD metrics ... 213
7.4.2. Evolution of the dislocation structures ... 219
7.4.3. EBSD Vs DPPA... 222
7.5. Summary ... 224
CHAPTER 8 ... 225
GENERAL DISCUSSION... 225
8.1. Introduction ... 225
8.2. Creep-fatigue damage evaluation in structural components ... 225
8.3. Discussion of key findings ... 228
8.3.1. An EBSD-based misorientation method to quantify inelastic strains ... 228
8.3.2. Choice of EBSD metrics ... 235
8.3.3. Comparison of EBSD metrics with other methods to quantify dislocation density ... 238
8.4. Using EBSD for creep cavitation studies around a reheat crack and comparison with Vickers hardness and SANS cavitation measurements ... 240
8.4.1. Study 1: EBSD and microhardness studies around a reheat crack ... 241
8.4.2. Study 2: EBSD and SANS studies around a reheat crack ... 246
8.4.3. Conclusion ... 250
8.5. Limitation of the high temperature test equipment available ... 251
CHAPTER 9 ... 252
OVERALL CONCLUSION AND FUTURE WORK ... 252
9.1. Overall conclusions ... 252
9.2. Suggested future work ... 254
12
LIST OF ABBREVIATIONS
AGR Advanced gas cooled reactor
AFC Area fraction of cavities
CCD Charge coupled device
C-F Creep fatigue
DGF Deformed grain fraction
DIC Digital image correlation
DPPA Diffraction peak profile analysis
DSA Dynamic strain ageing
E Young’s modulus
EBSD Electron backscatter diffraction ECCI Electron channelling contrast imaging
ECD Equivalent circle diameter
EDM Electro-discharge machining
EDS Energy dispersive spectroscopy
f.c.c Face centred cubic
GAM Grain average misorientation
GB Grain boundary
GBF Grain boundary fraction
GBS Grain boundary sliding
13
GOS/AMIS Grain orientation spread/ Average intragrain misorientation
HAGB High angle grain boundary
HAZ Heat affected zone
HTLCF High temperature low cycle fatigue
IAP Instron AlignPro
JSMS Society of material science, Japan
KAM Kernel average misorientation
LABF Low angle boundary fraction
LAMF Low angle misorientation fraction
LAGB Low angle grain boundary
LCF Low cycle fatigue
LVDT Linear variable displacement transducer m.u.d multiples of the uniform density
ND Normal direction
NDT Non-destructive testing
OIM Orientation imaging microscopy
OM Optical microscopy
PLC Portevin Le-Chatelier
RD Rolling direction
SANS Small angle neutron scattering
SEM Scanning electron microscopy
14
STEM Scanning transmission electron
microscopy
TBF Twin boundary fraction
TD Transverse direction
TEM Transmission electron microscopy
TTP Time temperature precipitation
TTT Time temperature transformation
W Cumulative inelastic strain energy
∑ie Cumulative inelastic strain
∑t Cumulative tensile strain
∑c Cumulative tensile strain
∆w Inelastic strain energy per cycle
𝜀𝑒 Elastic strain
15
CHAPTER 1
INTRODUCTION
1.1. Background
In this era of global warming and climatic changes, affordable and clean energy is very important for sustainable development. Nuclear power makes a significant contribution to clean energy reducing greenhouse gas emissions and at the same time meeting the increasing energy demands of a growing world [1]. Almost 19% UK’s electricity is generated from nuclear energy. The Advanced Gas-Cooled Reactor (AGR) is a second-generation reactor developed from Magnox reactor technology in the UK to improve thermal efficiency. Most of the AGRs have executed their original design life and are approaching decommissioning from 2023 [2]–[4]. The main focus of the nuclear industry in many countries is on continuing to operate their existing power plants, rather than building new ones, due to the economic benefits this offers. The Chernobyl disaster (in 1986), which is considered the world’s worst nuclear power plant accident has raised international concern about reactor safety despite the economic attractiveness of nuclear power. In order to extend the life of ageing power plants the most important requirement is to demonstrate the safe and efficient operation of their reactors [5].
Figure 1.1 shows a schematic of an AGR. A total of 14 AGRs currently operate at 6 sites in the UK. The carbon dioxide circulates through the core, reaching a temperature of 650°C, and then past steam generator tubes outside it, but still inside the concrete and steel pressure vessel. Control rods penetrate the moderator and a secondary shutdown system involves injecting nitrogen to the coolant [6]. The main criterion for continued plant operation is that the plants must remain safe to the satisfaction of the regulators but
16
they must also be economically viable to meet the requirements of the utility companies and other stakeholders [5]. Regulators require Periodic Safety Reviews (PSR) of old power plants as they were not built to the same standards as modern ones. The actual working life of a plant depends on various factors such as:
changes in the operating conditions compared with those assumed in the design,
the findings from maintenance inspections,
the results of test programmes and
the outcome of safety assessments [5].
Figure 1. 1 Schematic of Advanced Gas-Cooled Reactor [7].
Type 316H austenitic stainless steel is widely used in the UK’s advanced gas cooled reactors, for example in boiler components, due to its good corrosion, creep and fatigue properties at temperatures of around 550oC [8], [9], [18], [19], [10]–[17]. The influence of service exposures such as the type of loading, strain, strain rate, temperature, etc. has to be considered in the life assessment of a high temperature material and so the creep damage has to be studied in detail to ensure that the material can still withstand the applied
17
load in a creep damaged condition [20]. Creep deformation of polycrystalline materials at elevated temperature can lead to the nucleation, growth and coalescence of intergranular voids to form micro-cracks along the grain boundaries [20].
The electron backscatter diffraction (EBSD) technique using a scanning electron microscope (SEM) has recently emerged as a powerful method for material characterization. It gives microstructural level information along with the lattice orientation in the material. Recently many research studies have been conducted using this technique to find correlations between the inelastic strains in materials with the lattice misorientation at high spatial resolution. It can be used for precise measurements of plastic strain and creep strain in bulk samples [21], [22], [31], [32], [23]–[30]. The Society of Material Science, Japan had issued a guideline for EBSD measurement (JSMS, 2016), which focused on misorientation assessment for creep damage evaluation in Type 316 austenitic stainless steel. The main application of this method is to estimating inelastic strains in nuclear structural component whose prior deformation history is unknown. This thesis offers an opportunity to provide data for an EBSD-based damage measurement method in the R5 procedure which has been developed within the UK power generation industry to assess the integrity of nuclear and conventional plant operating at high temperatures.
1.2. Purpose of this study
Githinji et al [11] proposed a misorientation-based approach to quantifying plastic and creep strain in ex-service and solution annealed type 316H stainless steel. This approach was based exclusively on constant load creep studies. However, the relationship between crystallographic misorientations and inelastic strain is not well studied under conditions of stress relaxation or creep-fatigue which are more relevant to real plant conditions. To
18
be useful in predicting a plant’s remaining safe operating time, a more reliable method of measuring the plastic and creep strains under different conditions of operation is needed [11].
1.3. Structure of thesis
This thesis consists of 9 chapters that address different topics relevant to the research objectives.
Chapter 2 reviews the available literature relevant to this thesis. The topics discussed include precipitation, plastic deformation, creep deformation and fatigue in 316 austenitic stainless steels, reheat cracking, creep strain/damage monitoring techniques and EBSD for assessing strain in metallic materials.
Chapter 3 briefly explains the experimental methods and the measurement settings used in this thesis. This chapter is divided into four sections: mechanical tests, microstructural and dislocation characterization, strain measurement from lattice curvature measurement and other techniques for measuring dislocation density.
Chapter 4 introduces the 316H austenitic stainless steel materials used in this study including their service history, the as-received microstructure and chemical composition, grain sizes, precipitation, microstructure after re-solution heat treatment and thermal aging, dislocation structures and mechanical properties.
The influence of temperature, precipitates and grain size on the development of strain-induced lattice misorientation during uniaxial deformation is covered in Chapter 5. This chapter gives details of the material studied, the tests conducted, the measurements made and the data analysis of the results from these tests.
19
Chapters 6 and 7 cover the effect of cyclic deformation on lattice misorientation development. These chapters describe the cyclic tests conducted, the EBSD measurements done and the effect of different cyclic deformation parameters on misorientations developed. Chapter 6 focusses on the effect of strain range, dwell, strain rate and microstructure on EBSD metrics whereas Chapter 7 covers how cyclic strain accumulation affects the EBSD metrics of interest.
Chapter 8 presents an overall discussion of the thesis and reports EBSD studies around a reheat crack in a structural component.
Chapter 9 draws together conclusions of the thesis and sets out suggestions for future work.
20
CHAPTER 2
LITERATURE REVIEW
2.1. Introduction
The primary aim of this thesis is to investigate the potential of EBSD to characterize the inelastic strain developed during uniaxial stress relaxation and low cycle fatigue/creep-fatigue deformation of Type 316H austenitic stainless steel. This chapter starts with a literature review of the alloying elements, precipitates, and deformation (plastic, creep and fatigue/creep-fatigue) of austenitic stainless steels. It then reviews different methods of monitoring creep strain and damage. This chapter also reviews EBSD studies done so far to understand plastic/cyclic/creep deformation in different metals and alloys and ends with a summary identifying the limitations of the literature.
2.2. Type 316H Austenitic stainless steel
Austenitic stainless steels are used for high temperature components due to their excellent creep and oxidation properties. Austenitic stainless steels containing chromium and nickel are generally given a 300 series classification [33]. Type 316 steel contains 2–4% (wt%) molybdenum, to improve general corrosion resistance, (particularly pitting corrosion) [34]. Type 316H steel is the high temperature version of 316 steel with 17% chromium, 12% nickel, 2.5% molybdenum and a carbon content of 0.04 to 0.08% to give enhanced creep properties. This steel is always solution heat treated followed by quenching to get a fully austenitic structure [35].
The austenite phase provides high ductility and toughness, no impact transition at cryogenic temperatures and a low stacking fault energy. The alloying elements lead to high work-hardening rates; so, the strengthening method for austenitic stainless steels is work-hardening rather than heat treatment. Austenitic stainless steels, owing to their
face-21
centred cubic (f.c.c.) structure, are suitable for use at elevated temperatures (especially above 550 ºC) since they do not lose their strength as quickly as other ferrous phases, and so are used where good creep properties are required at temperatures above 550ºC [36][37].
The composition of type 316H austenitic steels was designed to give good creep properties. The role of the major alloying elements is:
Chromium is the most important alloying element in stainless steels. It increases corrosion and oxidation resistance at high temperatures by forming a passive oxide (Cr2O3) surface layer [36]. It forms a substitutional solid solution in austenite. The Cr
content is governed by that needed to give a passive film (~17%) and the Ni content follows from that [36]. Chromium is a strong ferrite stabilizer, so a combination of austenite stabilizing elements such as Ni, Mn, N, C, etc. is always added to maintain an austenitic microstructure at room temperature. As a rule of thumb, around 17% Cr and 11% Ni is required to stabilize austenite at room temperature. The effect of chromium on precipitation is reviewed in the next section.
Nickel is another substitutional element. Ni acts as an austenite stabilizer and increases the toughness, ductility, weldability and general corrosion resistance of stainless steel [36][37]. A high nickel content in the matrix can make the thermal expansion coefficient of the alloy closer to that of the oxide layer, reducing the risk of oxide rupture and increasing the corrosion resistance at high temperatures [36], [38]. Nickel usually dissolves in carbides, partially substituting for chromium; whereas it is a major constituent in some other types of precipitates, like the G phase [39]. The addition of Ni increases the stacking fault energy (SFE) [40]. The SFE affects the motion of dislocations;
22
raising the SFE aids the activation of cross slip and so promotes strain hardening during deformation. More details regarding SFE are given in section 2.2.2.
Carbon atoms occupy interstitial sites within the f.c.c structure of austenitic stainless steel, providing solid solution strengthening [37]. Carbon is a major austenite stabilising element but its use is limited by its low solubility in austenite. Carbon forms M23C6
(M=Cr, Fe, Mo, V, W in different proportions) chromium rich carbides on grain boundaries, leading to chromium depletion in the austenite matrix (called sensitisation) and consequently lowering the material’s intergranular corrosion resistance [41]. Type 316L stainless steels have carbon content less than 0.03wt% and 316H has carbon content between 0.04 and 0.1wt% [36].
Nitrogen is another interstitial solute and a strong austenite stabilizer. The solid solution strengthening effect of N is more pronounced than C, and N also enhances the strain hardening effect. Nitrogen reduces the tendency to form compounds with chromium by lowering the diffusion of C and hence is considered as beneficial in austenite [36]. Nitrogen’s limited solubility can be increased by the addition of manganese [37]. Its addition is also beneficial for creep strength, by promoting the precipitation of nitrides and carbonitrides [40]. The addition of nitrogen also increases the creep-fatigue life of 316L steels. This could be for two reasons:
(i) Nitrogen inhibits cross-slip and the climb of dislocations, promoting the planar slip mode in cyclic deformation. The dislocation structure in 316L steels is reported to change from cells to planar with the addition of nitrogen. It is reported that a planar structure is more resistant to fatigue damage than a cell structure [42].
23
(ii) Stress relaxation has been found to be lower in 316LN steel than in 316, reducing the plastic deformation occurring during the hold time, which eventually reduced cavitation [43] .
Manganese is an austenite former and sometimes used as a replacement for nickel; however, such an alloy exhibits less corrosion resistance [40]. Mn increases nitrogen’s solubility in austenite without forming nitrides and hence enhances nitrogen’s solid solution strengthening effect. The addition of manganese has some disadvantages such as weakening the passive film and increasing the risk of pitting corrosion at manganese sulphide inclusions [40].
Silicon, which is a ferrite stabilizer, improves the oxidation resistance of the stainless steel by forming a dense silicon oxide layer on the surface [40]. Silicon also prevents carburisation and nitridation of austenitic steels at high temperatures by forming an oxide layer [36].
Molybdenum is a strong ferrite former and necessitates the addition of more austenite stabilizers to keep the austenitic structure [37]. It enhances the corrosion resistance of stainless steel, especially against pitting corrosion [40]. Molybdenum improves creep strength by solid solution hardening and by facilitating carbide precipitation [36]. However, it promotes sigma phase and Laves phase formation during long-term aging [38].
Vanadium forms more stable carbides than chromium and improves the creep resistance around 550oC [36].
Copper enhances the corrosion resistance of stainless steel in certain acids and promotes the austenitic structure [44]. In high temperature grades, copper has been recently shown to form precipitates during long term aging at high temperatures (above 400oC),
24
improving the creep strength [40]. Copper also helps increase stacking fault energy (see section 2.4 for more details on SFE) [40].
2.2.1. Precipitation in austenitic stainless steel
Creep-resistant 316H austenitic stainless steel contains many alloying elements in a supersaturated solid solution in the austenite phase. The precipitates play an important role in enhancing its creep properties. In austenitic stainless steel, precipitation results from the decreasing solubility of the alloying elements in the austenite when it is cooled down. Before using the alloy, it is solution annealed at a suitable temperature; usually following by rapid cooling to form a supersaturated solid solution [37], [45], [46]. When the alloy is in service at high temperatures, it ages, the supersaturated elements diffuse and react to form precipitates. Crystallographic defects within the matrix structure are preferential nucleation sites for second phase precipitates [37].
Grain boundaries and grain corners are the most favoured nucleation sites because of their high energy, their ability to accommodate the structural mismatch between precipitate and matrix and also their high density of vacancies which facilitates the diffusion of solute atoms [37], [40], [46]. Twin boundaries are the next most preferential nucleation sites. Precipitation first occurs at incoherent twin boundaries and then in coherent twin boundaries [47]. Within the grains, the slip bands which are associated with a high density of tangled dislocations are preferential sites for precipitate nucleation [40]. Other crystallographic defects such as vacancies and dislocations can also be sites of precipitate nucleation [37]. The type, morphology, size, distribution and stability of the precipitates are the factors dominating the creep behaviour of the alloy. The temperature-time precipitation (TTP) diagram of an annealed Type 316 stainless steel (see Figure 2.1) shows the precipitation as time proceeds.
25
Figure 2.1 Time-temperature-precipitation diagram of 316 stainless steel solution treated at 1260oC for 1.5hour and water quenched [38].
M23C6 is a general notation for precipitates with the structure of Cr23C6 (which in steels
is usually in reality a mixed carbide). Fe, Mo, V, W and Ni can all partially substitute for Cr (M=Cr, Fe, Mo, V, W) [36]. M23C6 has an f.c.c structure with a lattice parameter
varying between 10.57 and 10.68 Å [36]. The precipitation of M23C6 is accelerated above
550ºC and usually starts on grain boundaries and incoherent twin boundaries where diffusion is much more rapid than in the bulk material. As aging advances, M23C6 can
precipitate on other sites like coherent twin boundaries, within the grains on dislocations and around other particles, like residual carbides/nitrides. Some alloying elements can markedly affect the precipitation of M23C6 carbide. Elements like molybdenum and nickel
enhance it by decreasing the solubility of carbon in austenite, whereas nitrogen, which increases the carbon solubility, reduces M23C6 precipitation. To improve both corrosion
26
and creep properties it is desirable that M23C6 carbides precipitate as fine intragranular
particles instead of chain-shape ones on grain boundaries [46]. Planar M23C6 precipitates
are less damaging to creep-fatigue properties than triangular ones [40].
M6C, called eta carbide in the literature, is another type of f.c.c carbide (a0=10.62-11.28
Å) which usually forms after long-term aging [36]. M can be varying combinations of elements like chromium, iron, molybdenum, nickel, niobium and silicon. This phase forms on similar sites to M23C6 and with similar morphologies [46].
Laves phase is an intermetallic phase formed by iron and elements such as Mo, Nb and Ti with a hexagonal unit cell (a0=4.73 Å, c0=7.72 Å) which depends on a close match of
the atomic sizes of its constituent elements [38]. Laves phase is known to be generally stable at temperatures above 815 ºC [38].
Sigma phase is a well-known intermetallic phase with a tetragonal crystal structure (a0=8.828-8.832 Å, co=4.579-4.599 Å) forming in Fe-Cr alloying systems [38]. In highly
alloyed austenitic stainless steels other elements such as Mo, Ni, Mn and Si may dissolve in sigma phase, replacing iron and chromium atoms. Sigma phases were reported to precipitate along grain boundaries, twin boundaries and on MnS inclusions [48]. The precipitation of sigma phase embrittles the alloy, especially when it forms continuously on grain boundaries. However, its dispersed intragranular form, slightly improves the creep properties [40]. Sigma phases were reported to be absent in 316 steel thermally aged at 575oC for 5 years [48].
-phase precipitates at grain boundaries and intragranularly at dislocations at temperatures above 750oC [37]. phase has a b.c.c structure with a lattice parameter
27
Zhu et al [48] reported the precipitation sequence for Type 316H austenitic stainless steel thermally aged at around 550oC as dense intra-granular carbides, intra-granular laves
phase particles, large grain boundary M23C6 carbides and a few grain boundary laves
phase particles [48].
2.2.2. Plastic deformation in austenitic stainless steel
Plasticity is one of the major characteristics of metals that has led to their technological importance. The major mechanism of plastic deformation in polycrystalline materials is the movement and generation of dislocations on the crystal planes under the influence of an applied stress [49][50]. The stress required to move dislocations increases during plastic flow (this is known as work/strain hardening) as the dislocations are hindered by obstacles such as solute atoms, precipitates, dislocations and grain boundaries [51]. The assessment of plastic damage can be done through macroscopic measurement of scalar quantities such as the strain, strain rate etc. The term ‘damage’ is used in this thesis to
represent inelastic strain accumulated in the material (plastic and/or creep strains) after deformation.
There are two main types of dislocation movement. Glide occurs when a dislocation moves in the surface which contains both its line and Burgers vector. Glide is a conservative dislocation motion involving local atomic displacements that proceed through switching one or few interatomic bonds at a time [49] and is reversible. The glide of many dislocations results in slip. Climb is (a non-conservative motion) when a dislocation moves out of the glide plane and is not reversible [49]. Climb involves the diffusion of point effects and hence is strongly dependent on temperature [52] [49]. Plastic deformation can be described as the successive sliding of one plane of atoms over
28
another on so called slip planes. The slip planes are normally the planes in a crystal with the highest density of atoms and the slip directions are the directions where the atoms are most closely packed. Hence the plastic deformation of metals varies with their crystal structure. The shear stress acting to move a dislocation is given by
𝜏 =𝐹
𝐴cos 𝛷 cos (2.1)
Where Fcos is the force component in the slip direction, being the angle between the applied force, F, and the slip direction (see Figure 2.2). The area of the slip plane is A/cos 𝛷, where Φ is the angle between applied force and the normal to the slip plane. A minimum value of shear stress, usually called the critical resolved shear stress (τc), is
required to initiate slip. The quantity cos 𝛷 cos is known as the Schmid factor [50].
Figure 2.2 Illustration of geometry of slip in crystalline material.[50]
Austenitic stainless steel has a face centred cubic (f.c.c) structure and plastic deformation occurs due to the twelve {111}<110> slip systems ({Slip plane}<Slip direction>) [53]. Dislocations leave their glide plane by cross-slip or climb [49]. In f.c.c. systems, dislocations are often confined to one set of {111} planes in which they dissociate into
29
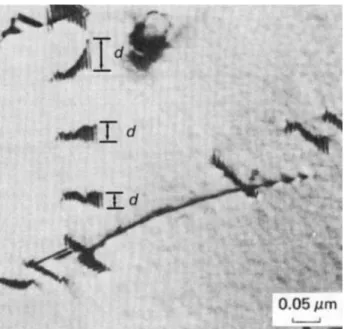
Shockley partials by a planar dissociation [54]. If the stacking fault energy (SFE) is high, dislocations remain undissociated and cross-slip can occur freely. Austenitic stainless steel has a low SFE [55] so cross-slip is more difficult at room temperature as the dislocations have to constrict to change slip planes [55]. The region corresponding to the stacking fault can be clearly seen by the characteristic fringe (////) pattern (see Figure 2.3). The SFE determines the width of the faulted region between two partial dislocations present in the fcc matrix. Wide stacking faults (i.e. lower SFE) between partials impede the motion of dislocations and reduce the activation of cross slip [55]. A lower SFE results in a larger faulted region, and therefore a lower tendency for the material to work harden. SFE increases with increasing temperature [56].
Figure 2.3 Dislocations in AISI 304 stainless steel splitting into partials bounded by short stacking-fault region. Partials’ spacing is marked as d [55].
A twin is a region of the crystal where the lattice orientation is a mirror image of the orientation of the rest of the crystal. The formation of a twin can be described as a lattice shear (see Figure 2.4). Twins can form during crystal growth (annealing twins) or by deformation (mechanical/deformation twins) [51]. Twinning is characterized by one specific plane (the ‘mirror’, ‘coherent twin’ or ‘twinning’ plane K1) and one specific
30
direction (the shear direction η1). For f.c.c materials the K1 plane is {111} and η1 is
<11-2> [57]. In f.c.c. metals, perfect twin boundaries are characterised by a misorientation of 60° about the <111> axis and have 1 in every 3 lattice sites coinciding. They are described as Ʃ3 coincident site lattice (CSL) boundaries where Ʃ represents the reciprocal density of coincident sites [58]. It has been reported that fatigue cracks predominantly nucleate at the {111}/ Ʃ 3 boundaries in strain controlled high cycle fatigue tests on an annealed austenitic stainless steel at room temperature.[59]. But the propagation rate of fatigue cracks was lower for the specimens of 304 stainless steel with a higher fraction (73 %) of low- Ʃ boundaries including Ʃ 3 boundaries (58 %) than for the specimen with a lower fraction (53 %) of low- Ʃ boundaries including Ʃ 3 boundaries (39 %) [60].
Figure 2.4 Formation of a twin by shearing over parallel atom planes. K1 is the
twinning plane and η1 is the shear direction. The value of ‘h’ is ‘a’ and ‘w’ is ‘a√2’
31
2.3. Creep deformation in austenitic stainless steel
Time dependent deformation in material at elevated temperature is called creep. Generally, significant creep occurs at homologous temperatures above 0.5 (the homologous temperature is the ratio, using the absolute scale, between the test temperature and the material’s melting temperature), but this critical value can be increased by adding suitable alloying elements whose atoms take substitutional or interstitial locations depending on their size. Creep strength can be improved by the addition of finely dispersed particles of a second phase. The precipitates should be stable to high temperature, preferably above the recrystallization temperature, for good creep resistance [45], [53], [61], [62].
Figure 2.5 shows a typical constant load creep curve. The creep curve is characterised by four main regimes, defined according to their creep rates. These are instantaneous strain (during initial loading), primary creep (decreasing creep rate due to increasing strain hardening from the mobile dislocations introduced on loading), secondary creep (equilibrium between strain-hardening and recovery processes, producing a steady-state creep rate) and tertiary creep (accelerating creep rate due to metallurgical changes such as the formation of
cavities, coarsening of precipitates and re-crystallisation) [51], [61], [63]. The minimum
creep rate is an important design parameter in the design of alloys since secondary creep occupies a large proportion of material’s service-life. During primary creep in 316H steel, the density of mobile dislocations increases with the applied stress [64] [65] and so does the primary creep rate.
32
Figure 2.5 Typical constant load creep curve (schematic) [11].
2.3.1. Dislocation structures formed during creep
Dislocation climb is enhanced by the increased atomic diffusion rates at elevated temperatures. Climb allows dislocations to change their slip planes and bypass obstacles.
The dislocations’ improved mobility through climb and cross-slip, allows them to annihilate
by interactions between oppositely signed dislocations or to rearrange to form low-energy
configurations such as low angle boundaries. A low angle boundary is essentially an array of dislocations which separate regions of a crystal differing in orientation by less than approximately 15° [50]. During recovery the tangles and networks of interlocked dislocations
are gradually released and rearranged, thus reducing their density, leading to the formation
of 3D dislocation networks (although we only see a 2D projection in TEM images) [11] [66] [43].
33
2.3.2. Deformation Mechanism Maps
Ashby et al [64] represented all the possible deformation mechanisms of a material in a stress-temperature space. The various regions of the map show the different dominant deformation mechanisms for those stress-temperature conditions. The deformation maps of a 316 stainless steel at two different grain size are shown in Figure 2.6 and Figure 2.7. The strength of stainless steel depends on its service history. However, the deformation maps describe the deformation mechanisms of the steel as determined in one state only, which is usually the bar-stock in the as received condition. An alternative way to represent creep data is as a map with strain-rate and stress as the axes (see Figure 2.8).
34
Figure 2.7 A deformation map for type 316 stainless steel of grain size 200µm, showing data [64].
Figure 2.8 A strain-rate/stress map for type 316 stainless steel of grain size 100µm, showing data [64].
35
2.3.3. Microstructural changes due to creep
Creep deformation in metals is generally accompanied by the following structural changes:
Slip involving the movement of dislocations on certain crystallographic planes [52][55]
New slip systems may become active when metals are deformed at elevated temperature and in high temperature creep slip occurs over short distances on many different slip planes. This arises by the operation of many dislocation sources which at room temperature would be inhibited by the repulsion between dislocations from adjacent loops. At high temperatures the loops can climb and annihilate and a steady stream of new dislocations form from multiple sources.
Formation of sub-grain boundaries as a result of dislocation climb and rearrangement[52][55]
Creep deformation is inhomogeneous and may result in lattice bending, particularly close to the grain boundaries [11]. Lattice bending arises because locally more dislocations of one particular sign will be formed. Since dislocation climb can occur at high temperatures, the dislocations may arrange themselves into a low-angle grain boundary to minimize their total line and strain energies [50]. Sometimes with increasing dislocation density, the dislocations arrange to diffuse cell walls form rather than low angle grain boundary [11]. The dislocation density increases during primary creep up to a certain level and remains constant throughout the steady state creep. Large sub-grains are produced by creep at high temperature under a low stress or creep rate.
36
Grain boundary sliding (GBS) [52][55]
Grain-boundary sliding is a shear process which occurs at elevated temperatures in polycrystalline metals. It is promoted by increasing the temperature. GBS can be accommodated in three ways: elastic accommodation, diffusional flow or plastic flow. When GBS cannot be accommodated in any of these three ways, voids form and grow at grain boundaries [67].
2.3.4. Mechanisms of creep deformation
Diffusion creep
Diffusion creep occurs by the transport of vacancies through the crystal or along the grain boundaries. The deformation is achieved by the preferential formation of vacancies on those grain boundaries under tension and absorption of vacancies at boundaries under compression. Both vacancy formation and vacancy migration are thermally activated processes. When bulk diffusion of vacancies is dominant, this type of deformation is called Nabarro or Nabarro-Herring creep. At lower temperatures where grain boundary diffusion is dominant it is called Coble creep [51].
Dislocation creep
Thermally activated dislocation glide will be the predominant mechanism of creep deformation at stress levels above those indicated for diffusion creep on deformation mechanism maps. The creep rate depends on the obstacles in the material such as precipitates, solute atoms and other dislocations [53]. The climb of edge dislocations over obstacles is the rate-controlling step [68]. Depending on the temperature and stress, four different sub- classes of dislocation creep mechanisms can be found: glide and bulk diffusion-controlled climb; glide and pipe diffusion-controlled climb; Harper–Dorn creep and power law breakdown which are all well explained in the literature [53][51].
37
Grain boundary sliding
During grain boundary sliding (GBS) two grains slide over each other due to resolved shear stresses. Grains more or less keep their aspect ratios after extensive GBS in contrast to the mechanism of dislocation glide where grains are extended in the direction of deformation. At low strain rates, GBS may become more important than dislocation glide. GBS alone would result immediately in the formation of cavities between the grains where grains are sliding apart and an overlap of material where they come together. Hence GBS can influence the initiation of intergranular fracture even when it does not contribute significantly to steady state creep [51].
2.3.5. Stress relaxation in metals
Stress relaxation tests, where the strain is held constant and the stress decreases, help to determine creep strain rates in a considerably shorter time than constant load creep tests that take weeks to months. These tests allow sampling of a wide range of stresses and strain rates with a very small plastic strain. Here, the elastic strain (𝜀𝑒) is transferred to plastic strain (𝜀𝑝); the total strain (𝜀𝑇) remains constant.
𝜀𝑇 = 𝜀𝑒+ 𝜀𝑝= 𝐶 (2.2)
As the test proceeds, elastic stresses relax thereby replacing elastic strain by plastic strain, through a creep deformation process, which depends on the applied stress.
Substituting Hooke’s law
𝜎 = 𝐸𝜀𝑒 (2.3)
where E is Young’s modulus and 𝜎 is the stress, into equation 3 and differentiating with respect to time, 𝑑𝜀𝑝 𝑑𝑡 = − 1 𝐸 𝑑𝜎 𝑑𝑡 (2.4)
38
relates the stress rate during the stress relaxation test to the plastic or creep strain rate. Stress relaxation tests are also referred to as self-programmed variable-stress creep tests [69]–[71].
The maximum elastic strain is given by,
𝜀𝑒(𝑚𝑎𝑥)= 𝜎𝑦
𝐸 (2.5)
The stress relaxation behaviour during simulated age-forming (SAF) of Al-Zn-Cu alloy at 120, 160 and 200oC was divided in to 3 stages (see Figure 2.9). Stage I was the high stress stage, Stage II the medium stress transition stage and Stage III the low stress equilibrium stage [72]. The deformation activation energy and the stress exponent suggested that the mechanisms of stress relaxation are dislocation creep in stages I and II, and Coble creep (diffusion process of vacancy transfer along grain boundaries) in stage III [72].
Figure 2.9 Schematic mechanism diagram for the Al–Zn–Mg–Cu alloy in stress relaxation [72]
39
2.3.6. Dynamic strain ageing in austenitic stainless steels
Dynamic strain aging (DSA) is a hardening mechanism affecting many materials, which manifests itself by “jerky” or serrated plastic flows and inhomogeneous yielding. These instabilities are referred to as the Portevin Le-Chatelier (PLC) effect [51], [73], [74], and arise from temperature dependent strain localisation within a specific range of strains and strain rates, as a consequence of DSA [2]. The PLC effect increases the flow stress, ultimate tensile strength and the work hardening rate. It also decreases the ductility of metals with corresponding decreases in elongation, the effective gauge cross-sectional area, the strain rate sensitivity coefficient and the fracture toughness [75]. DSA has been reported in austenitic stainless steels over a temperature range of 273oC to 800oC [76].
Generally the deformation of stainless steels is independent of the strain rate at room temperature, whereas at higher temperatures, the strain rate has a significant effect on the flow stress [53], [77]. In binary Al-Li alloys the serrations were not affected by precipitation [78].
DSA occurs as a result of interaction between the moving dislocations/defects and diffusing solute atoms (e.g. C, N, Cr) during deformation. The mobile dislocations act as carriers of the plastic strain and move among the obstacles formed by other defects in the bulk material [75]. The serrations may be attributed to a repeated locking and unlocking of dislocations from their solute atmospheres [79], leading to heterogeneous deformation with an alternating increase/decrease in plasticity, despite monotonic straining [74]. The maximum temperature at which serrations are seen is when the characteristic rearrangement time of the solute clouds around the moving dislocations becomes short enough to keep up with the dislocations’ changing positions, so that the dislocations can no longer break away from them. The dislocations then "drag along" their clouds in thermal equilibrium [80].
40
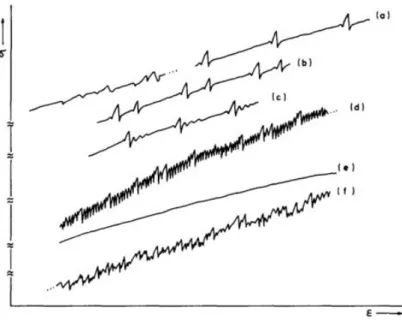
Teresa et al [81] classified the tensile curves into major 2 types. Type A serrations separated by smooth curve segments as seen in curve a in Figure 2.10 are caused by Luders bands that nucleate at one specimen grip and propagate smoothly in succession, one at a time to the other grip. Periodic serrations start, after an initial strain, due to the jerky propagation of the bands. As the bands move irregularly, when the bands reach areas of high local stress, the overall stress has to rise to continue deformation. Further deformation leads to a smooth distribution of bands (curve b in Figure 2.10, e.g. 316H at 550oC, 0.025%/s, see Figure 5.1). Once, smooth bands are formed, any following new bands will also be smooth resulting in curve c of Figure 2.10. Local heterogeneities (e.g. severe notches) already present in the material or any introduced during deformation (e.g. by a long load suppression or load relaxation during band propagation; strain gradient associated with the Luders band front can been related to dislocation motion and strain hardening behaviour [82]) may lead to irregular serrations or alternating serrations (Type B) in the flow curve (curve f and d respectively in Figure 2.10). A smooth curve is obtained when solute moves rapidly to dislocations. i.e. when there is little or no heterogeneity or localization (curve e in Figure 2.10).
41
Figure 2.10 Types of tensile curves demonstrating DSA under different conditions: (a) ‘normal’ type A serrations, (b) alternating type A serrations, (c) transition to type B serrations, (d) type B serrations, (e) non-serrated curve, (f) irregular serrations due to
heterogeneities [81].
2.4. Fatigue and Creep-fatigue deformation in austenitic stainless steel
When pure metals are subjected to cyclic plastic strains, they may soften or harden depending on their initial microstructure [83]. When well-annealed f.c.c single crystals oriented for single slip were subjected to fully reversed cyclic strains, rapid hardening was observed for first few cycles followed by saturation. The dislocation density increased during the tensile part of the cycles and reduced during the compressive part due to the interaction and annihilation of dislocations during the compressive part [84]. If a pre-strained material is stressed in the direction opposite to the pre-strain direction, a lower yield strength is often obtained. This is called the Bauschinger effect [85].
The relationship between the macroscopic slip mode and the type of dislocation structure (e.g. tangles, persistent slip bands, cell etc.) formed during cyclic deformation of polycrystalline f.c.c metals and alloys was first described by Feltner and Laird [83], [86]. Wavy slip lines indicate that cross slip can occur easily and that the cyclic stress-strain
42
behaviour is likely to be independent of strain history. In the planar slip mode, cross slip is difficult and the material’s cyclic behaviour is dependent of its previous cyclic stress-strain history [87][88]. At room temperature, crack initiation in fatigue occurs by the motion of dislocations back and forth along slip planes, gradually resulting in the formation of extrusions and intrusions on the surface. Eventually a crack develops at one of these discontinuities which then grows along the slip plane (stage I in Figure 2.11) before propagating perpendicular to the maximum principal stress axis (stage II) [62]. In polycrystalline commercial alloys, grain boundaries, precipitates, impurities and texture all affect the fatigue deformation. The damage (measured in terms of the inelastic strain accumulation) caused by variable loading of materials is cumulative and is usually manifested only in the final stages by macroscopic crack propagation and final fracture [89].
43
It should be expected that fatigue properties are also affected by the temperature. The effect of a high temperature on the mechanical properties can be associated with transformations of the material structure due to diffusion processes, enhanced thermal activation of processes other than diffusion (eg: climb), aging, dislocation restructuring (softening), and recrystallization [90]. Intergranular cracking can be observed after fatigue [62]. In this case, the stage I region was reduced and can be eliminated altogether if a grain boundary acts as a crack starter.
In cyclic tests at any given plastic strain amplitude, f.c.c. materials with a low SFE and showing planar slip exhibit more reversible slip and better fatigue resistance than f.c.c, materials with a high SFE and a wavy slip mode [91].
At temperatures below 250oC, 316H austenitic stainless steels subjected to cyclic
deformation show rapid hardening followed by softening until a saturation peak stress is attained [92]. Above 250oC, the softening is gradually replaced by a more pronounced
cyclic hardening and an increase in the saturation peak stress. The strain hardening can be attributed to the generation of dislocations and their mutual interaction as well as the interaction of interstitial solute atoms with the dislocations which generate the plastic and creep strains. The softening could be associated with rearrangement of the dislocations and micro-crack generation [93]. The saturation stress stage continues (or the stress slightly decreases with the number of cycles) up to failure [92]. Planar arrays of dislocations were reported after cyclically deforming 316H austenitic stainless steel at temperatures in which a minimum in the saturation peak stress occurs (between room temperature and 250oC). Cell substructures were observed between 250 and 850oC [92].
44
2.4.1. Factors affecting the fatigue/creep-fatigue endurance of 316SS
Hold time/Dwell time: Considering the creep-fatigue interaction during cyclic deformation with a hold period at either the peak tensile strain or the peak compressive strain, different parameters characterising the stress relaxation behaviour near half-life can be defined as shown schematically in Figure 2.12.
Figure 2.12 Definition of the different characteristic stress values observed in hold-time tests [94].
The shape of the relaxation curve depends both on the strain range and the temperature [94]. Stresses are found to relax more at higher temperatures or higher strain ranges. However, when the hold period is extremely long, the degree of stress relaxation becomes almost constant [94].
When plotted on a log-log scale,the number of cycles to failure at 600oC, at a given strain range, decreases linearly with increasing hold period, except in the case of extremely long hold periods (~900min). However at 593oC, a total strain range of 2% and a hold period
45
of 24hr, the of number of cycles to failure, Nf was higher than that with a hold period of
10hr, due to aging of the materials during the long-hold testing [94]. In comparison to continuous cycling, the reduction in fatigue life on introducing dwell times may be due to the interaction between the steady advancing fatigue crack and the creep damage formed during the periods of stress relaxation [95]. Stress relaxation during hold was attributed to the (enhanced) recovery of the dislocation structure that may favour the development of a cell-subgrain structure [96]. The reduction in fatigue life (compared to continuous cycling) is greater at lower strain ranges than higher strain ranges. At a given strain range, the number of cycles to failure, Nf in symmetrical hold (both tensile and
compressive hold) testing is higher than that in the tension hold testing for a given hold period which indicates that in creep fatigue testing of 316 SS the tensile hold produces more damage than the compressive hold. The effect of a tensile hold on the value of Nf
becomes more obvious at higher temperatures [94].
Cycle time (Ct): When ct is very short (<6s for a total strain range of 1%) or long
(>10min for a total strain range of 1%), the value of Nf is independent of ct for
continuous cycling at 600oC at a strain rate of 6.7x10⁻³s-1 [97]. Consistent behaviour was
observed for tension-hold-only and symmetrical hold testing, in that on a log-log plot the value of Nf decreased linearly with increasing ct. For a given cycle time, the value of Nf
in the symmetrical hold testing is generally higher than that in the tensile hold only testing [97].
Strain range: Figure 2.13 shows the relationship between the plastic strain range (∆𝜀𝑝)
and number of cycles to failure (Nf) in creep damage testing at 593 and 693oC with
different tensile hold periods. It’s clear from the literature that at a given ∆𝜀𝑝the value of Nf decreases with increasing hold period.
46
At a given hold period, the relationship between ∆𝜀𝑝 and Nf is identical to the
Coffin-Manson relationship [94]
∆𝜀𝑝
2 = 𝐴(2𝑁𝑓)
𝑐 (2.6)
Where A and c are the fatigue ductility coefficient and the fatigue ductility exponent respectively. The values of A with a positive sign and c with a negative sign increase as the tensile hold period increases. Hence, the ∆𝜀𝑝− 𝑁𝑓 curve becomes steeper at longer hold periods.
The curves in Figure 2.13 provide a method of extrapolating the results from short hold period tests at high plastic strain ranges to much lower plastic strain ranges. If experiments are carried out to determine the ∆𝜀𝑝− 𝑁𝑓 curves at different temperatures, the values of A and c can be fitted with respect to hold time and temperature. A model, which can be considered as the modification of Coffin-Manson equation, can be developed to predict the value of 𝑁𝑓 at a given ∆𝜀𝑝 [94].
Figure 2.13 The effect of total strain range, ∆𝜀𝑡, on the number of cycles to failure, Nf,
47
Figure 2.14 Relationship between the plastic strain range ∆𝜺𝒑, and the number of cycles
to failure 𝑵𝒇, with different tensile hold periods at (a) 593oC, and (b) 600oC. The solid symbol and lower half-filled symbol respectively denote the materials of type 316 and
316L stainless steel [94].
Cyclic frequency/ Strain rate: Comparison of metallographic and fractographic studies of low cycle fatigue and thermomechanical fatigue tests of 316 austenitic steel with and without dwell periods showed that the proportion of intergranular cracking increased as the frequency was reduced from 0.01 Hz to 0.001 Hz. Furthermore, transgranular fatigue failure dominated at high frequencies whereas intergranular, time-dependent failure
48
predominated at low frequencies and low imposed mechanical strain amplitudes. Both transgranular and interganular failure was observed at intermediate frequencies and strain amplitudes [96].
Prior Deformation: Investigation of the effects of prior deformation on creep behaviour is essential as most components used in power-generating plants enter service in a pre-strained condition, e.g. welded components. Most studies conducted on 316 stainless steels, indicate that pre-straining reduces the initial creep loading strain but has a variable effect on the creep rupture strains and minimum creep rates. Generally, prior deformation increases the number density of dislocations which limit the movement of dislocations in the subsequent creep loading [98]. At elevated temperatures, carbide precipitation pins the dislocations introduced during the pre-straining, further limiting their movement and hence reducing creep rates [99].
2.4.2. Calculation of creep-fatigue damage
The term ‘Damage’ is generally used to indicate deterioration of material properties. As
mentioned earlier in this chapter, accumulated inelastic strain is referred to as damage in this thesis. However, the literature uses the term damage in different senses as briefly reviewed below. Fatigue/ creep-fatigue damage (from stress-strain test data) is mainly calculated in the literature by three methods.
Cumulative inelastic strain energy [96], [100] (used mainly for fatigue deformation and defined by the area under the stress strain curve, see section 6.2.3 for more details)
Cumulative inelastic strain (used for creep, fatigue and creep-fatigue loading see section 6.2.3)
![Figure 2.1 Time-temperature-precipitation diagram of 316 stainless steel solution treated at 1260 o C for 1.5hour and water quenched [38]](https://thumb-us.123doks.com/thumbv2/123dok_us/1405310.2688129/28.892.180.780.142.578/figure-temperature-precipitation-diagram-stainless-solution-treated-quenched.webp)
![Figure 2.6 A deformation map for type 316 stainless steel of grain size 50µm [64].](https://thumb-us.123doks.com/thumbv2/123dok_us/1405310.2688129/36.892.296.681.516.888/figure-deformation-map-type-stainless-steel-grain-size.webp)
![Figure 2.8 A strain-rate/stress map for type 316 stainless steel of grain size 100µm, showing data [64]](https://thumb-us.123doks.com/thumbv2/123dok_us/1405310.2688129/37.892.209.598.596.1001/figure-strain-rate-stress-stainless-steel-grain-showing.webp)
![Figure 2.9 Schematic mechanism diagram for the Al–Zn–Mg–Cu alloy in stress relaxation [72]](https://thumb-us.123doks.com/thumbv2/123dok_us/1405310.2688129/41.892.166.639.633.1063/figure-schematic-mechanism-diagram-al-alloy-stress-relaxation.webp)
![Figure 2.12 Definition of the different characteristic stress values observed in hold-time tests [94]](https://thumb-us.123doks.com/thumbv2/123dok_us/1405310.2688129/47.892.196.615.356.737/figure-definition-different-characteristic-stress-values-observed-tests.webp)