1
COLOR DEVELOPMENT IN COMPLEX MODEL SYSTEM ON
VARIOUS TIME AND TEMPERATURE
PEMBENTUKAN WARNA PADA SISTIM MODEL KOMPLEK PADA BERBAGAI SUHU DAN WAKTU PEMANASAN
Sri Agustini
Balai Riset dan Standardisasi Industri Palembang
Jalan Kolonel H. Palembang, Sumatera Selatan, Indonesia 30152
Correspondence: HP : +6281532898196, Fax +620711412482, email: [email protected] Diterima: 26 September 2016 ; Direvisi: 2 Oktober 2016 ± 13 Mei 2017; Disetujui: 30 Juni 2017
Abstract
The research was intended to study the development of color during heat treatment in a model real system consisted of sucrose, sweetened condensed milk, egg and margarine. Research applied was factorial completely randomized design with steaming time consist of 1,2,3 and 4 hours and temperatures consist of 100oC, and 110oC as treatment with 3 replication. The changes of color was investigated by using Munsell color system consist of value/lightness, hue angle, and chroma. Browning index was measured by using the absorbance of ethanol extracts at 420 nm in 40.0 mm silica. Amino acid content was observed by using HPLC. Research showed that there were negative correlation between steaming time and temperature with lightness, hue angle, chroma, and amino acid. While for TCD, and browning index indicated positive correlation.
Keywords : Browning, Heat processing, color development, Maillard reaction, real system. Abstrak
Penelitian ini bertujuan untuk mempelajari pembentukan warna selama pemanasan pada sistim pangan yang terdiri dari gula sukrosa, susu kental manis, telur ayam dan margarin. Penelitian menggunakan rancangan acak lengkap yang disusun secara faktorial. Perlakuan yang digunakan adalah suhu pengukusan terdiri 100oC, dan 110oC dan waktu pengukusan terdiri dari 1jam, 2 jam, 3 jam dan 4 jam dengan 3 replikasi. Perubahan warna diamati menggunakan Munsell color system yang terdiri dari value (lightness), hue angle, dan chroma. Pengukuran browning index diamati menggunakan absorbansi pada etanol pada panjang gelombang 420 nm. Pengujian asam amino menggunakan metode HPLC. Hasil penelitian menunjukaan adanya korelasi negatif antara suhu dan waktu pengukusan dengan value (lightness), hue angle, chroma, dan asam amino, sedangkan untuk TCD, dan indeks pencoklatan menunjukkan korelasi positif.
Kata kunci: browning, pemanasan, pembentukan warna, reaksi Maillard,
INTRODUCTION
,QGRQHVLD¶V WUDGLWLRQDO IRRGV
generally dominated by carbohydrate, protein and fat which are processed by using heat treatment at periode of time. The application of heat treatment on food processing lead to physical change such as browning. In certain foods like kue delapan jam the acceptability and quality are determined based on the level of browning. In addition color also could indicate chemical changing or chemical reaction which are exposured on foods (Agustini et al., 2014a). Hidalgo and
Zamora (2000) stated that the color were used to indicate the sensories quality of foods.
One of the most important reaction which occur during processing and storaging of foods is browning reaction (Simpson, 2012). Basically browning reaction could be classified into enzymatic browning and non enzymatic browning. Enzymatic browning reaction are caused by enzyme such as phenol oxidase, phenolase, monophenol
2
oxidase, diphenol oxidase and tyrosinase.
Non ezymatic browning in foods is divided into four types namely Maillard reaction, lipids peroxidation, caramellization and ascorbic acid degradation (Nursten, 2005 and Hidalgo and Zamora, 2000). Browning reaction in foods especially Maillad reaction is influenced by chemical factor and physical factor. Chemical factors including the type and amount of reactant, pH, moisture content, water activity, and the presence of other compound such as humectans and buffer. While physical factors including processing and storage temperature, oxygen and packaging (Saltmarch and Labuza, 1982; Ajandouz et al., 2001; Nursten, 2005; Kim and Lee, 2008 and Simpson, 2012).
Maillard Reaction is important for food scientist and food industry, since it can affecting foods quality mainly on sensories properties such as color, flavour and taste of foods (Martins and van Boekel, 2005; Matiacevich et al., 2005). During Maillard reaction there are various of product formed those affecting foods quality significantly. Maillard Reaction could decline foods nutrition due to decreasing of digestability and possible formation of mutagenic and poissoning substance. It also could improve nutritional value due to formation of antioxidant product (Martins et al., 2001). Food systems that could potentially to undergo Maillard reaction is traditional foods which are rich of reactant for Maillard reaction such as kue delapan jam, kue senting (kue ambtenar) and srikaya. The traditional cake containing protein (source of amino acids), sugar (source of carbonyl compounds) and steamed in a periode of time.
This paper will discuss the changes and the formation of color and a decrease in the amino acid content in a complex model system consisting of sugar, milk, eggs and margarine which
are heated (steamed) at various temperatures and times.
MATERIAL AND METHODS Materials
Materials used were eggs, sucrose, margarine, sweetened condensed milk and reagent for analysis.
The Food system was made by mixing 1,500 g of eggs, 600 g of sugar, 400 g of sweetened condensed milk, and 100 g of margarine by using hand mixer to obtain homogeneous mixture. The mixture was then poured into baking pan that has smeared with margarine. Then it was covered with aluminium foil to prevent water dropplet on the surface. Steaming was then performed according to treatment at 100oC and 110 oC for 1h, 2h, 3h, and 4h. The cake was taken out and air cooled immediately after steaming time reached to stop further reaction.
Equipment
The apparatus used were autoclave (Hirayama type Hiclave HVE 50), mixer, baking pan, desiccators, glasswares, incubator, analytical balance, Konica color reader (Minolta, Italy), UV-Vis Spektrofotometer (Hitachi spectrofluorophotometer F-2500), and HPLC,
Method
Research appliled was factorial completely randomized design with 3 replications. The treatment was steaming time and temperature. Steaming temperature consist of 100oC and 110oC, while steaming time consist of 0 h (t0) 1 h (t1), 2 h (t2), 3 h (t3), dan 4 h (t4).
Test on amino acid using HPLC. Color measurement using Konica Minolta color Reader. Color measurement using Munsell color system consisting of V (value/lightness), c (chroma), and h (hue). The value of L0, h0, and c0 were measured after the dough steamed for 5 minutes so the dough became solid.
As the color index were used Total Color Difference (TCD) calculated using the following equation :
3
TDC= ¨/2 ¨F2 ¨K2)1/2 ... (1) Data were presented as a mean and standard deviation of three measurement. Statistical analysis were performed using SAS 9.13 software. Data were statistically analyzed using one-way ANOVA and Duncan tests. Differences were considered significant at 95% (p<0.05).
RESULT AND DISCUSSION
Value (Lightness/L)
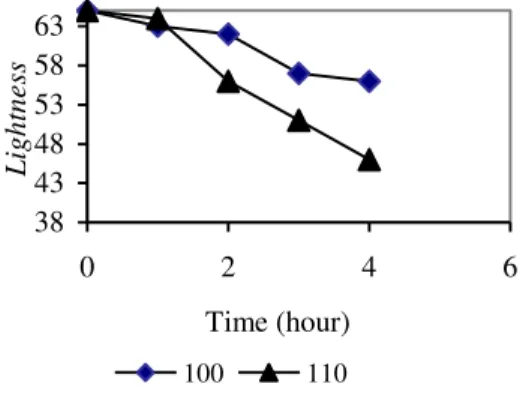
Changing in color during heat treatment can be seen in figure 1a-d. As shown in figure 1 a-d, the lightness (L), chroma (c) and hue (h) decreases during heating. Increasing in steaming temperature resulting declining in lightness, chroma and hue angle.
Declining in lightness were caused by Maillard reaction during steaming. Maillard reaction occuring between reduction sugar with amines and amino acid, lipid oxidation and interaction between lipid oxidation product with amino acid to form brown color polymer known as melanoidin (Agustini, 2015). This result consistent with previous studies which stated that a reaction between reducing sugars with amino acids lead to the formation of polymer containing brown pigment compound (Ames, 1990; Batos et al., 2012; Nursten, 2005; Saltmarch and Labuza, 1982; Yu and Zang, 2010). Brown polymer which were formed during heating process accumulated so that the color of system become darker so the lightness become lowered. Decreasing in the lightness of food during processing and storage are also reported by Tan et al. (2012), Matsuo et al.(2012), Gamli (2011), Mohammadi et al.(2008), Bosch et al.(2007); Coghe et al. (2006), Tosun (2004), and Ramirez-Jimenez et al. (2000).
Increasing the temperature causes the kinetic energy of the material to be increased so that more molecules reach the activation energy. As a result the oxidation reaction and browning reactions more easily occur. This is in
accordance with the Ajandouz et al. (2001), Kim and Lee (2008), Nursten (2005), Saltmarch and Labuza (1982), and Simpson (2012) who stated that Maillard reaction on foods affected by chemical and physical factors, such as temperature and time.
38 43 48 53 58 63 0 2 4 6 Time (hour) Lig h tn ess 100 110
Fig. 1a Changing in Lightness
Analysis of variance showed that steaming temperature, steaming time, and their interaction have significant effect on the lightness (P<0.01). The coefficient of determination (R2) on the effect of temperature, steaming time and the combination on the change in lightness was 0.978. This may imply that the lightness decreases with increasing temperature and steaming time.
Hue angle/h
Hue angle is attribute of a color by which it distinguish wether the object is red, yellow, blue, green, or purple. Munsell color system defines hue as the quality to distinguish one color with other colors. There are five basic colors: red, yellow, green, blue and purple, and there are five intermediate colors are: yellow-red, green-yellow, blue-green, purple-blue and red-purple, arranged in a circle with zero angle (0o, 360o) is red.
The value of hue angle (h) of the system during heating was ranging from 43 ± 84o which represent red color (0o -18o) and yellow color (72o-90o). At the beginning of process prior to heating the hue angle was on 84o which meant that the system on the yellow area. This is consistent with other studies that also reported a decrease in the value of hue
4
angle during processing and storage of food (Ke ren et al., 2005, Guine and Barocca, 2014).
Declining in hue agle were caused by degradation on the pigment carotenoid contained in the raw material mainly in yolk. According to Von-Elbe and Schwartz (2007), carotenoid pigment reflect the colors of yellow, orange or red. Carotenoid easily isomerized by acids, heat, and light. Oxidation causes the carotenoid loss of color which is the color degradation mechanisms. 40 50 60 70 80 90 0 1 2 3 4 Time(hour) Hu e a n g le 100 110
Fig. 1b Changing in Hue angle Analysis of variance showed that steaming temperature, steaming time, and their interaction have significant effect on the hue angle (P<0.01). The coefficient of determination (R2) on the effect of temperature, steaming time and the combination on the change in hue angle was 0.99. This may imply that the hue angle decreases with increasing temperature and steaming time.
Chroma (Saturation/c)
Chroma is the saturation of color. Colors of low chroma are sometimes
FDOOHG ³ZHDN ´ ZKLOH WKRVH RI KLJK FKURPD DUH VDLG WR EH ³KLJKO\VDWXUDWHG ´ ³VWURQJ ´
RU ³YLYLG ´ 7KH VFDOH VWDUW IURP ]HUR for
neutral colors. The chroma scale for normal reflecting materials extends beyond 20 in some cases. Fluorescent materials may have chromas as high as 30 (www.munsell.com)
At the beginning of heating, chroma was located on 27.2 scale, which mean that the system is on strong yellow color. During steaming chroma decreased. This result is consistent with other studies that also reported a decrease in chroma scale during processing and storage of food (Gamli, 2011; Jaiswal and Abu-Ghannam, 2013; Reyes et al., 2007).
Changing in chroma during heating due to carotenoid pigments degradation and the formation of brown pigments due to the Maillard reaction between carbonyl compounds present in milk and amino acids of eggs. In addition there were oxidation of lipids derived from egg yolks and margarine. Degradation of carotenoid pigment causes the yellow color becomes faded, followed by the formation of brown color shifting the chroma scale. 15 19 23 27 0 1 2 3 4 Time (hour) C h ro ma 100 110
Fig. 1c Changing in Chroma Analysis of variance showed that steaming time, and their interaction have significant effect on the chroma (P<0.01). The coefficient of determination (R2) on the effect of temperature, steaming time and the combination on the change in chroma was 0.91. This may imply that the increase in temperature and steaming time will decrease the chroma.
5
Table 1. Effect of Temperature and Time on Color
Waktu L H C TCD
100oC 110oC 100oC 110oC 100oC 110oC 100oC 110oC 1 jam 63±0,21a 64±0,81a 84,7±0,19a 77,9±0,21a 25±0,21a 27±1,18a 3±0,37a 7±,91a 2 jam 62±0,75a 56±2,0b 82,5±0,11a 66,3±0,85c 25±0,58a 25,5±1,3a 4±0,88a 20±0,61b 3 jam 57±1,25b 51±0,51b 72,7±0,59b 58,1±2,74c 24±0,89a 25±1,45a 14±1,53b 30±1,73c 4 jam 56±0,95b 46±0,97c 62,3±0,42c 43,7±1,94d 17±1,37b 21±1,08a 26±2,0c 45±1,18d Data were expressed as mean ± standard deviation (n=3).
a-b Values in each column with different superscripts are significantly different (P<0.05).
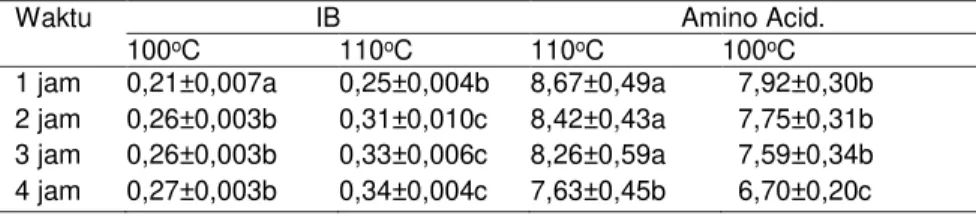
Table 2. Effect of Temperature and Time on browning index and amino acid.
Waktu IB Amino Acid.
100oC 110oC 110oC 100oC 1 jam 0,21±0,007a 0,25±0,004b 8,67±0,49a 7,92±0,30b 2 jam 0,26±0,003b 0,31±0,010c 8,42±0,43a 7,75±0,31b 3 jam 0,26±0,003b 0,33±0,006c 8,26±0,59a 7,59±0,34b 4 jam 0,27±0,003b 0,34±0,004c 7,63±0,45b 6,70±0,20c Data were expressed as mean ± standard deviation (n=3).
a-b Values in each column with different superscripts are significantly different (P<0.05).
Total Color Difference (TCD)
Total color difference (TCD) is one of the best parameter to describe the color change, because it is a combination of the parameters of lightness, chroma and hue angle (Ibarz et al., 2000). Figure 1d shows that TCD increases linearly during steaming at various temperatures. This suggests that the formation of a brown color is closely related to changes in TCD. Changes in the value of TCD is a function of changes in temperature and time. 0 10 20 30 40 50 0 1 2 3 4 Time (Time) T C D 100 110 Fig. 1d. Changing in TCD
Analysis of variance showed that steaming time, steaming temperature and their interaction have significant effect on the TCD (P<0.01). The coefficient of determination (R2) on the effect of temperature, steaming time and
the combination on the TCD was 0.99. This may imply that increase in the temperature and steaming time will increase the TCD.
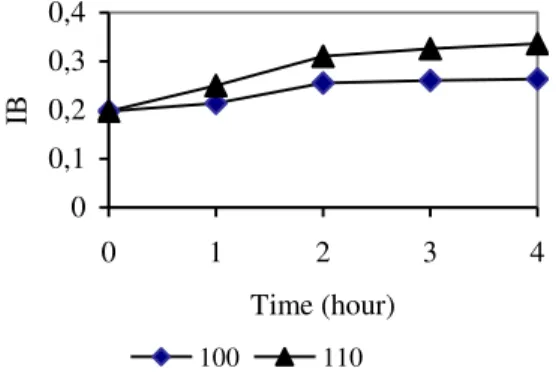
Browning Index(IB)
Tablel 2 indicates that the steaming time and temperature causes increase in browning index. This was seen by the increase in absorbance values during steaming. The increase in steaming time cause a rise in absorbance values, as well as an increase in steaming temperatures cause a rise in absorbance values. The longer the steaming time the higher the browning index. Increasing in absorbance value indicated that the more brown polymer (melanoidin) was formed. Melanoidin formation showed that the browning reaction occurs primarily during the steaming was Maillard reaction (Agustini et al., 2014b). This result is accordance with various studies that suggest the browning reaction is affected by the length of the heating (Ames, 1998).
Increasing in steaming temperature also resulted in an increase in the absorbance value. This means that the rate of browning reaction increases with increasing temperature and steaming
6
time. During steaming reaction occurs between lactose with amino acids derived from proteins to form Amadori compounds which in turn form brown polymers. In addition the fat content in the materials undergo auto oxidation reaction due to the heat treatment to form a brown polymeric compound (Agustini et al., 2014b). Brown color can also be formed from auto oxidation of lipids into hydroperoxide, which are then degraded to aldehydes and hydro carbons. Hydro peroxides and aldehydes polymerize into a stable product and the product is brown (Nawar, 1996; Hidalgo and Zamora, 2000; Kerler et al., 2010). In the food processing, reaction of lipid oxidation products with amines, amino acids and proteins cause browning (Van Boekel, 2006; Nursten, 2005; Zamora and Hidalgo, 2005; Hidalgo and Zamora, 2000). 0 0,1 0,2 0,3 0,4 0 1 2 3 4 Time (hour) IB 100 110
Fig. 2. Changing Browning Index
Analysis of variance showed that steaming time, steaming temperature and their interaction have significant effect on the browning index (P<0.01). The coefficient of determination (R2) on the effect of temperature, steaming time and the combination on the browning index was 0.977. This may imply that increasing in temperature and steaming time will increasing the browning index. Duncan test indicated that steaming at 100oC significantly different with at 110oC for each steaming time. Steaming for 1 hours differ to 2 hours, 3 hours and 4 hours.
Amino Acid
The amino acid in this study derived from egg whites and sweetened condensed milk. The test results showed that during steaming there were changes in amino acids content. Declining in amino acid due to amino acid reacts with the carbonyl compounds in the system mainly glucose and lactose. The reaction between amino acids with carbonyl compounds will produce a brown polymeric compounds known as Maillard reaction (Ames, 1990; Batos et al., 2012; Nursten, 2005; Saltmarch and Labuza, 1982; Yu and Zang, 2010). The decreasing in the amino acid, lightness, hue angle and chroma as well as increasing of TCD and browning index indicated there are Maillard reaction during steaming.
The increasing in steaming temperatures also resulted in decreasing the levels of the amino acid. Similarly the increasing in steaming time also cause a decreasing in amino acid content. This means that the temperature and steaming time will affect on the amino acid content. The longer the steaming, the lower of amino acid content.
Maillard reaction starts from the condensation reaction between the carbonyl group of aldose and free amino group of the amino acid to form N -substituted aldosylamin. Eggs contain all kinds of amino acids, such as amino acid lysine. The reaction of lysine with glucose SURYLGHV -N-deoxifructolysin. Reaction of lactose with lysine will produce residue lactulosillysine, which further degraded during heating to produces N-carboxymethyllysine (CML), pentosidine, pyrraline, or oxalic acid monolysinylamide/OMA ( Ditrich et al., 2006).
Heat treatment will also produce protein - crosslinker lysinoalanine (LAL). LAL is formed from the condensation of lysine with dehydroalanin. LAL is found in mozzarella cheese, baby food, UHT milk and sterilized milk (Cattaneo et al., 2008; van Boekel, 1998).
7 6 7 8 9 0 1 2 3 4 Time (hour) A mi n o (% ) 100 110
Fig. 3. Changing in Amino Acid The longer the steaming, the more amino acid lysine which react to form melanoidin and LAL thereby reducing the amino acid residue lysine available in the system. This is consistent with the literature that states that a decrease in the concentration of lysine is the most significant consequence of the Maillard reaction (Cattaneo et al., 2008; van Boekel, 1998). Ramirez- Jimenez et al. (2001) stated that the decline in lysine in bread baked until brown was about 40 %. The decline of lysine in commercial dairy which stored for a year were maximum of 10% at a temperature of 32oC and 23% at 55oC ( Ramirez - Jimenez et al.,2004). Fernandez- Artigas et al. (1999) reported that the loss of lysine during toasting of bread ranges between 14-29%. Processing using a roller dryer at rice-corn-soy causes a loss of 53% lysine.
Analysis of variance showed that steaming time and temperature have significant effect on the amino acid (P<0.01), while their interaction have not. This may imply that increasing in temperature and steaming time will decrease amino acid content. Duncan test indicated that amino acid in the system which were steamed at 100oC significantly different with at 110oC. The system which were steamed at 110oC as long as 4 hours significantly different with those were steamed for 1 h, 2 h and 3 h.
CONCLUSION
The reseach showed that the temperature and steaming time significantly affect the formation of the color and amino acid content. During steaming there were color formation and decreasing the amino acid content. Formation of brown color in the system during steaming indicated by the increase of TCD, and browning index, as well the decrease of the amino acid. This means that in the food system which contains proteins, fats, and sugars such as bolu senting, srikaya and kue delapan jam, the higher the temperature applied the faster lossing in nutrient content (amino acid) and color formation. Heating in the long periode of time lead to changes in food color where the color becomes darker.
ACKNOWLEDGEMENT
This research work was facilitated by Palembang Institute for Industrial Research and Standardization, Ministry of Industry
REFERENCES
Agustini, S., Priyanto, G., Basuni, H., Santoso, B., dan Pambayun, R. (2014a). Changes on the physical-chemical properties of kue delapan jam on various steaming time. Internat.
J. Sci. Eng., 7(2):161-165.
Agustini, S., Priyanto, G., Basuni, H., Santoso, B., dan Pambayun,R. (2014b). Pengaruh lama pengukusan terhadap kualitas sensoris kue delapan jam. Jurnal Dinamika Penelitian Industri, 25(2):79-88.
Agustini, S. (2015). Modifikasi Proses Pembuatan Kue delapan Jam Melalui Reaksi Maillard (Disertasi). Palembang : Universitas Sriwijaya.
Ajandouz, E.H., Tchiakpe, L.S., Ore, F.D., Benajiba, A. and Puigserver, A. (2001). Effect of pH on caramelization and Maillard reaction kinetics in fructose-lysine model systems. Journal of Food Science, 66(7):926-931.
8
Ames, J. M.(1998). Applications of the Maillard reaction in the food industry.
Food Chem, 62:431±439.
Bastos, D.M., Monaro, E., Siguemoto,E., and Séfora, M.(2012). Maillard Reaction Products in Processed Food: Pros and Cons dalam Food Industrial Processes - Methods and Equipment, InTech, Published, 282-296.
%RVFK / $OHJUÕ•D $ )DUUH 5 &OHPHQWH
G.(2007). Analytical, Nutritional and Clinical Methods Fluorescence and color as markers for the Maillard reaction in milk±cereal based infant foods during storage. Food Chem. 105:1135±1143.
Coghe, S., Gheeraert,B., Michiels, A., Delvaux,F.R., (2006). Development of Maillard Reaction Related Characteristics During Malt Roasting. J. Inst. Brew. 112(2):148± 156.
Cattaneo, S., Massoti, F., Pellegrino, L.( 2008). Effects of over processing on heat damage of UHT milk. Eur Food Res Technol, 226:1099±1106.
Ditrich, R., Hoffmann, I., Stahl, P., Muller, A.,Beckmann,M.W., Pischetsrieder, M. (2006). Concentrations of NE-Carboxymethyllysine in Human Breast Milk, Infant Formulas, and Urine of Infants. J. Agric. Food Chem., 54:6924-6928.
Pilar Fernandez-Artigas, P., Garcia-Villanova, B., Guerra-Hernandez, E.(1999). Blockage of available lysine at different stages of infant cereal production. J.Sci.Food Agric, 79: 851-854
Gamli, O.F.(2011). Kinetic study of color changes of tomato purees with microwave and conventional drying. J. Food Sci Eng., 1: 366-373.
Hidalgo, F.J., dan Zamora, R.(2000). The role of lipids in nonenzymatic browning. Grasas y Aceites, 51: 35-49. Ibarz, A., Pagan, J., Garza. S.(2000). Kinetic models of non-enzymatic browning in apple puree. J Sci Food Agric, 80:1162 -168.
Jaiswal, A.K., Abu-Ghannam, N.(2013). Degradation Kinetic Modelling of Colour, Texture, Polyphenols and Antioxidant Capacity of York Cabbage after Microwave Processing. Food Research International.
Ke ren, Kang-Tu., Pan, L., Chen, Y. (2005). Kinetic Modellings of Broccoli Color Changes during Chilled Storage.
Journal of Food Processing and Preservation 30: 180±193.
Kerler,J., Winkel, C. Davidek, T., Blank, I.(2010). Basic chemistry and process conditions for reaction flavours with particular focus on Maillard-type reactions. In : Food Flavour Technology: Second Edition Edited by Taylor, A.J., dan Linforth, R.S.T. Blackwell Publishing Ltd.
Kim, S.J. and Lee, S.Y.(2009). Antioxidant activity of Maillard reaction products derived from aqueous glucose/glycine, diglycine, and triglycine model systems as a function of heating time. Food Chemistry. 116: 227-232.
Martins,S.I.F.S., Jongen, M.F.W., Van Boekel, M.A.J.S.(2001). A review of Maillard reaction in food and implications to kinetic modelling.
Trends Food Sci Technol., 11:364± 373.
Martins,S.I.F.S., Van Boekel,M.A.J.S. (2005). Kinetic model for glocose/glycine Maillard reaction pathways. Food Chem., 90:257-269.
Matsuo, M., Umemura, K., Kawai, S.(2012). Kinetic analysis of color changes in cellulose during heat treatment.
Journal of Wood Science, 58(2):113-119.
Matiacevich, S.B., Santagapita, P. R., Buera, M.P.(2005). Fluorescence from the Maillard Reaction and its Potential Applications in Food Science. Critical Reviews in Food Science and Nutrition. 45:486-495.
Mohammadi, A., Rafiee, S., Emam-Djomeh, Z., Keyhani, A.(2008). Kinetic Models for Colour Changes in Kiwi fruit Slices During Hot Air Drying. World Journal of Agricultural Sciences, 4(3):376-383. Nawar, W.W.(1996). Lipids in Fennema O.R,
Foods Chemistry. University of Wisconsin Madison, Marcel Dekker Inc, New York, Basel, Hongkong. Nursten, H.E.(2005). The Maillard Reaction:
Chemistry, Biology And Implications. Royal Society of Chemistry.
Ramirez-Jimenez,A.,Guerra-Herna´ndez, E.,
*DUFÕ•D-Villanova, B.(2000). Browning
indicators in bread. J. Agric Food Chem., 48(9): 4176-4181.
Ramirez--LPHQH] $ *DUFÕ•D-Villanova, B., Guerra-Herna´ndez, E.(2001). Effect of toasting time on the browning of sliced bread. J.Sci.Food Agric 81:513-518. Reyes, L.F., Cisneros-zevallos, L.(2007).
Degradation kinetics and colour of anthocyanins in aqueousextractsof purple- and red-flesh potatoes
9
(Solanum tuberosum L.). Food Chemistry, 100: 885±894.
Saltmarch, M and Labuza, T.P.(1982). Nonenzymatic browning via the Maillard reaction in foods. Diabetes, 31(Suppl 3):29-36.
Simpson, K.B.(2012). Food Biochemistry and Food Processing. Second ed. Wiley-Blackwell.
Tan, T.C., Abbas, F.M.A., Azhar, M.E. (2012). Characterization of the ribose-induced Maillard reaction in minced chicken and minced pork: a potential means of species differentiation.
International Food Research Journal,19(2):481-489.
Tosun, I.(2004). Color changes and 5-hydroxymethyl furfural formation in zile pekmezi during storage. Grasas y Aceites,55( 3):259-263.
Van Boekel, M.A.J.S.(1998). Effect of heating on maillard reaction in milk. Food Chem., 62(4):403-414.
Van Boekel, M.A.J.S.(2006). Formation of flavour compounds in the Maillard reaction. Biotechnology Advances, 24:230±233.
Von-Elbe, J.H., Schwartz, S.J.(1996). Colorant in Fennema O.R, Foods Chemistry. University of Wisconsin Madison, Marcel Dekker Inc, New York, Basel, Hongkong.
Yeung, C-H., Lee, H-C., Lin, S-P., Yang, Y-C., Huang, F-Y., Chuang, C-K.(2006). Negative effect of heat sterilization on the free amino acid concentrations in infant formula. European Journal of Clinical Nutrition 60: 136±141.
Zamora, R., Hidalgo, F.J.(2005). Coordinate Contribution of Lipid Oxidation and Maillard Reaction to the Nonenzymatic Food Browning. Critical Reviews in Food Science and Nutrition, 45 (1):49-5