* Sofie Van der Meulen is doctoral student at the KULeuven while Ann Gaeremynck and Marleen Willekens are Associate Professors at the KULeuven.
We are grateful to L. Van de Gucht, R. Knechel and B. Rees for suggestions and remarks on previous versions of this paper. We also acknowledge the comments of participants at the 2003 EAA Annual Conference in Seville.
ATTRIBUTE DIFFERENCES BETWEEN US GAAP AND IFRS
EARNINGS: AN EXPLORATORY STUDY
Sofie Van der Meulen Ann Gaeremynck Marleen Willekens*
ABSTRACT
With the successful completion of the IASC’s standards, IFRS and US GAAP were placed as the two pre-eminent world financial reporting frameworks. For years, however, US GAAP was accepted widely as the international set of standards to ensure high quality financial statements. Especially in the US, but also elsewhere, the introduction of IFRS has lead to a discussion on the (relative) quality of both regimes. However, relatively little research has been devoted to the subject. In this study, we address that void and further compare the quality of the two standard regimes using a sample of German New Market firms. Financial statement quality is measured applying multiple earnings attributes traditionally used in accounting research. Consistently throughout our measures, we find that the quality of US GAAP prepared financial statements and IFRS information is overall very comparable. Only with regard to predictive ability of accounting information do we find US GAAP superiority.
Keywords:
1. INTRODUCTION
National government has long been an important actor in the standard setting process. Next to promulgating the standards, government typically has the power to install an enforcement and penalty system to watch over the (correct) application of these standards. The US Government with its US standards and its Securities and Exchange Commission (SEC), watching over the US listed firms, are definitely the best-known example.
Recognizing that information can no longer be bound by a country’s specifications in a world of global economies, the International Accounting Standards Committee (IASC) completed a set of core standards (the International Financial Reporting Standards) suitable for listed companies to use for cross border financial purposes. This successful completion, combined with the European Directive on the mandatory use of IFRS by all listed EU companies from 2005 onwards, places IFRS in direct competition with US GAAP. For years, US GAAP has been considered as THE set of standards to ensure high quality financial statements, not only by Americans but also in other countries. This implicitly creates the expectation that US GAAP would become the sole standard for international reporting. The development of IFRS however introduces competition, giving rise to discussions on the relative quality of both IFRS and US GAAP. Nevertheless, relatively little research has been devoted to the subject so far. Therefore, this paper is directed towards providing some exploratory results on the IFRS / US GAAP comparison.
More specifically, the purpose of the current study is to investigate the properties of IFRS versus US GAAP earnings. We use criteria that are typically used in the literature, such as value relevance, timeliness, predictability and accruals quality to draw inferences on earnings’ properties. The sample consists of firms reporting either IFRS or US GAAP accounting information and listed on the German New Market. Our sample is restricted to this specific equity market for the following reasons. First, it is especially in this type of market that there is a strong need for high quality financial information. Due to unstable performances and a limited financial history of the firms quoted on this market, investments are highly risky, making the (quality of) current financial statements highly relevant to investors Second, since some of the applied earnings metrics make use of
equity market variables, we need to control for market institutional features that can affect price information. We accordingly limit our sample to a single equity market.
The contribution of this study is threefold. First, with this research, we hope to address claims such as the one by the SEC, that the FASB provides qualitatively better standards than the IASC. This claim has earlier on led the SEC to require foreign filers that report using IFRS, to reconcile their earnings number and shareholder equity to US GAAP. Although some studies have already looked at this issue, they have mainly focused on US markets. Exploring the differences between IFRS and US GAAP earnings of German New Market firms should further contribute not only to the reconciliations debate, but also to the process of developing a world GAAP. Second, we address several earnings attributes at a time, both capital market and accounting based, to evaluate financial statement quality. Research comparing standard settings typically limits its scope to the value relevance of earnings. Finally, we also examine whether differences between IFRS and US GAAP earnings attributes are not distorted by any self-selection. Firms self-select their accounting standards, therefore any of the observed attribute differences might be attributed to underlying firm characteristics (instead of accounting standards). Observing more predictable US GAAP earnings might, for example, simply be due to firms with more predictable earnings choosing for US GAAP more often. We control for this by using the model developed in Van der Meulen et al. (2005).
As the results of our study show, US GAAP and IFRS earnings perform equally well on most of the attributes. With regard to predictive ability, however, US GAAP earnings are significantly better. Moreover, accommodating for self-selection, our study further confirms that the observed differences can be attributed to the different standard sets applied.
The remainder of this paper is organized as follows. First, we review the existing literature on financial statement quality, with a special interest for accounting regime evaluations and earnings attribute measures. Next, we argue why we expect these measures to be different when applied to IFRS accounting data as compared to US GAAP data. Following is a section in which we document the sample composition and data collection. In the fourth section, we specify the models and techniques used to estimate and evaluate the earnings attributes. Finally, we present the results in section 6 and give some concluding remarks in the last section.
2. LITERATURE REVIEW
Given the aim of this study, we revise two broad areas of literature. Firstly, we review the literature on earnings quality, documenting several measures applied by researchers to empirically assess that quality. Secondly, we evaluate the literature that deals with quality issues of accounting standards.
2.1.
E
ARNINGSA
TTRIBUTESIn theory, financial statements should reflect economic reality and show a true and fair view on, or present fairly, the financial position, performance and changes in the financial position of an enterprise. Earnings should be close to economic income, that is the amount that can be consumed during a period, while leaving the firm equally well off at the beginning and the end of the period (Hicks 1939). However, the above notions of fair view and economic income are vague and unobservable and therefore cannot be converted easily into a researchable measure.
Empirical studies on quality of accounting information most often investigate quality by the quality of the earnings number and properties of those earnings. Likewise, the FASB defines the quality of financial (earnings) information in terms of criteria such as relevance, reliability, comparability and consistency. Researchers in turn made these attributes empirically operational developing several metrics (see Schipper and Vincent 2003 for a recent review). According to Francis et al. (2003), the proxies used to measure earnings quality can be divided in two classes: accounting-based measures and market-based measures. An accounting market-based measures is a regression/metric where only accounting information is used, while the introduction of market prices or returns, next to accounting information, results in a market-based metric. Given the extant literature on earnings attributes, we limit this discussion of prior research to the attributes we consider later on to perform our own empirical analysis. More specifically, we study the following constructs: value relevance, timeliness, predictive ability and accruals quality. The first two measures are clearly market-based, while the following two are accounting-based measures.
2.1.1 Value Relevance
Research on the value relevance of accounting information initiated with the seminal work of Ball and Brown (1968). In their study, Ball and Brown build on developments in capital theory where it is argued that the capital market, if efficient, will adjust to newly released information that is useful in forming capital asset prices. Therefore, they argue that higher associations between earnings and returns are indicative of higher accounting quality of earnings1. The fact that returns are used as the benchmark to evaluate effectiveness/quality of accounting numbers is not surprising. Financial statements (and earnings) are a summary of events that have affected the firm over the fiscal period for which the report has been prepared. Similarly, returns capture capital market changes in firm value during that same period. Moreover, the relation between returns and earnings can also be explained from an earnings valuation perspective. In particular, prices can be expressed as a multiple of earnings, causing a change in earnings to be associated with a change in prices. Scaling both factors by the price at the beginning of the period, results in the return-earnings association.
Especially from the equity valuation research, there has been a trend to regress prices, instead of returns, on earnings. However, three remarks with regard to these models can be formulated. First, according to Easton (1999), the use of stock returns provides insights into the role of accounting data as a summary of last year’s events, while the use of prices tells us something about the role of accounting data in providing information to investors. This would suggest that price-earnings models are directed towards measuring the information content of earnings2, instead of the valuation relevance. Moreover, Easton also argues that using prices as dependent variable implies series scale problems. These problems are clearly overcome when returns are used, as all variables are scaled then by the price at the beginning of the period. Secondly, the simple price-earnings model might suffer from misspecification. Ohlson (1995) and Burgstahler and Dichev (1997) argue that stock prices are likely to be a function of both earnings and
1 Regressing returns on earnings, Ball and Brown show that, on average, earnings increases (decreases) are
associated with positive (negative) abnormal returns over the 12-month period prior to the earnings announcement. Ball and Brown’s study opened up the road for several other studies on the identification and explanation of differential market response to earnings information (known as the Earnings Response Coefficient research; e.g., Holthausen and Watts 2001; Barth et al. 2001). One issue is identified in the study of Beaver et al. (1979), where they examined whether, next to the sign of unexpected earnings, the magnitude of unexpected earnings is related to the magnitude of the security market price.
2 The term value relevance is frequently alternated with information content. To be informative however, the
data must first be perceived by the market as being value relevant but, more importantly, the market must also be sufficiently surprised by its magnitude and/or composition.
the book value of equity. Omitting the latter would lead to misspecifications (Collins et al. 1999). Finally, more recent studies show that the price-earnings models should make a distinction between positive and negative news periods. Jan and Ou (1995), for example, argue that there is a non-linear relation between earnings and prices, causing incorrect predictions for the earnings response coefficients. They show that while positive earnings are positively associated with stock prices, there might be a strong negative relation between a firm’s negative earnings per share and its stock price. Bernard (1994), Penman (1998) and Burgstahler (1998) reach similar conclusions. And although the results are consistent across all studies, there is not yet a single theory that can explain the negative relation. At most, theoretical models (such as the Ohlson model) can explain/predict a non-significant relation for loss firms. According to these models, the anomalous relation is caused by a correlated omitted variable, being the book value of equity. In the Ohlson model, book value is seen as a proxy for unexpected future normal earnings, whereas Burgstahler and Dichev (1997) view it as a proxy for the adaption or abandonment value. Whenever the book value is positively associated with stock prices but negatively correlated with earnings (which is the case for loss firms), omission of the book value in the price-earnings model therefore induces a negative bias in the ERC.
2.1.2 Timeliness
Another attribute on which earnings is often evaluated, is timeliness. Timely information is information, useful for decision-making that is released to the public before it loses its informative capacity. Alternatively stated, this attribute examines how timely earnings are in incorporating news.
Timely earnings are, similar as in the value relevance literature, defined in terms of strong associations with concurrent unexpected returns. However, while value relevance studies typically regress returns on earnings, research on timeliness inverts the price-earnings relationship. These so-called reverse regressions were first developed and employed by Beaver et al. (1987). Their approach is based on the observation that stock prices lead accounting earnings by up to four years. According to Ball and Brown (1968), Beaver et al. (1980), Lipe (1990) and others, this is because prices reflect information received from sources other than current earnings. Therefore, it is reasonable to presume that prices act as a surrogate for additional information available to market participants.
Observing changes in security prices and associating them with earnings, could lead to inferences about the earnings process.
Again, also in the timeliness literature there is an increasing trend to discriminate between good and bad news periods. More specifically, research in this field concludes on bad news reflected more quickly in earnings than good news. As Basu (1997) states, this is the result of accountants’ conservatism, or their tendency to require a higher degree of verification for recognizing good news compared to bad news. For instance, unrealized losses are recognized earlier than unrealized gains, for these gains need more verification (i.e. ‘highly likely’) than the losses (i.e., ‘when probable’).
2.1.3 Predictability
In its conceptual framework, the FASB refers to predictive financial statements as information that is useful to a range of users in making economic decisions (Holthausen and Watts 2001; Penman 2003). In particular, the presented data must provide information that can be used as a good predictor or input variable in the firm valuation process. Shareholders, as the primary users of the financial statements, try to estimate a firm’s ability to generate cash and cash equivalents as well as the timing and certainty of this cash generation. Current earnings are an important input to forecasting these future earnings/cash flows. In this view, information is judged to be of high quality when it is a good indicator of future performance, reflected in a well-performing auto-regressive earnings model3. Lipe (1990), for example, defines predictive ability as the ability of past earnings to predict future earnings, varying the number of lags to be put into the model4. Afterwards, many other researchers have included earnings components and other disaggregations of the summary earnings number into the analysis and investigated how they could improve users’ abilities to forecast performance. Dechow et al. (1998), for example, judge cash flows versus earnings on their predictive ability. Based on the fact
3 Related to predictability is earnings persistence. Earnings are said to be persistent when they recur in the
future, or when they are sustainable or permanent. Since more permanent and less transitory earnings are a more readily usable shortcut to valuation by, for example, a price-to-earnings multiple, earnings are judged to be of high quality when they are highly persistent (e.g., Penman and Zhang 2002; Schipper and Vincent 2003). The measure of earnings persistence is typically the autocorrelation coefficient for changes in earnings. Given however the different technique for IFRS / US GAAP comparison, we do not further address this earnings attribute.
4 We do acknowledge that the assessment of predictive ability (especially considering reasonably short
horizons) is complicated by the fact that the ability of earnings to predict itself might be increased by management interventions to smooth the reported series relative to the underlying unmanaged series.
that accruals can be considered as temporary cash flows (e.g., working capital accruals result in cash in- or outflows during the next year), they argue and document that current earnings (which are the aggregate of current cash flows and current accruals) better forecast future firm performance (compared to current cash flows). This is consistent with the FASB’s assertion that information about earnings and its components is generally more predictive of future cash flows than current cash flows (FASB 1978), proving the usefulness of accrual accounting.
2.1.4 Accruals Quality
Focusing on the role of accruals (and earnings in general), Dechow and Dichev (2002) have recently developed a new proxy to measure earnings quality. In particular, they argue that since accruals are intended to adjust the recognition of cash flows over time, errors in estimating those accruals and subsequent corrections by management might reduce the beneficial role of accruals. Therefore, they suggest that the extent to which accruals map into operating cash flow realizations can be used as a proxy for accruals (and earnings) quality. High quality is associated with low standard deviation of the residuals or high explanatory power when modeling accruals as a function of both past, present and future cash flows.
Although relatively new, the measure has already been widely applied (e.g., Aboody et al. 2003; Myers et al. 2003). Francis et al. (2003), for example, apply the Dechow&Dichev quality proxy next to other earnings quality measures and relate it to the cost of capital. Overall, they find consistencies across their different measures of earnings quality. This finding is in line with the initial finding of Dechow&Dichev’s on a positive relation between accrual quality and earnings persistence.
Despite however the appealing and intuitive character of the measure, Wysocki (2004) documents an important limitation. More specifically, he shows that including present cash flows in the analysis might not result in a model that fully captures earnings (or accruals) quality. Prior research has in fact found a significant negative relation between current accruals and cash flows, suggesting opportunistic earnings smoothing (Leuz et al. 2003; Hail and Leuz 2004). To adjust for this effect, Wysocki proposes to additionally run accruals on current cash flows only and comparing its explanatory power to that of the Dechow&Dichev model. The smaller the R² as compared to the
Dechow&Dichev model, the stronger the relative association between current accruals and past and future cash flows, indicating higher accruals quality.
2.1.5 Conclusion
All four earnings attributes discussed above have been applied in financial statement quality research. Although these measures capture different quality aspects of earnings, close links between some of these measures exist (e.g., value relevance and timeliness, both looking at the association between returns and earnings). Furthermore, recent studies in this field have documented the need for research that distinguishes between positive and negative news periods when evaluating some of these earnings attributes. As documented by Hayn (1995), this might be especially relevant for firms in emerging and growth industries, as these firms are typically confronted with large investments, such as R&D, and losses (Joos and Zhdanov 2003). Moreover, current earnings would fail to convey future growth potential for these firms, a factor that is also often left without consideration in the only earnings valuation models (Holthausen and Watts 2001).
2.2 R
ESEARCH ON STANDARD SETSGiven we want to compare financial statement quality between IFRS and US GAAP firms, it is important to discuss the existing literature concerning accounting quality differences between different standards. This broad area of research can be mainly divided into two streams: the quality of individual standards within one particular standard regime and the comparison between different standard regimes. The first stream is most prominently exercised in the US, examining whether or not individual standards comply with the relevance and reliability criteria set out by the FASB. Given the aim of the studies, they almost exclusively apply the above mentioned value relevance approach.
The vast majority of these studies are aimed at evaluating the usefulness of existing or newly imposed standards. Research into the incremental information content of alternative firm performance measures is one example, with measures such as comprehensive income versus net income (Dhaliwal et al. 1999), cash flows and accruals (Pfeiffer et al. 1998), cash flow from operations versus investing and financing cash flow (Cheng et al. 1997, Black 1998) or diluted versus other EPS measures (Balsam and Lipka
1998). Others have looked at the usefulness of disclosing information in the notes of the financial statements, like details on deferred tax components (Amir et al. 1997; Ayers 1998) or on employee compensations (Aboody 1996; Amir 1996; Rees and Stott 2001), fair value estimates of investment securities and derivatives for banks (Barth 1994; Barth and Clinch 1996; Venkatachalam 1996) …
A second stream of research evaluates the accounting standards as a whole (e.g., US GAAP standards) by comparing them to other standard regimes (e.g. German GAAP). These comparisons can either happen through a direct comparison of the standards as they are written down or through an empirical evaluation of the quality of different accounting regimes5.
Previous studies where the quality of standards is evaluated across regimes can be roughly divided into two groups: those comparing US GAAP versus other local regimes and those comparing IFRS with local regimes. Studies that resort under the first group typically have two features in common. First, almost all studies are performed using a sample of US and non-US companies listed on the same US stock exchange. Reason is that US stock exchanges have the interesting feature they allow foreign filers to report under their local standards, provided there is a reconciliation of earnings and shareholders’ equity with US GAAP (called 20F reconciliation). Second, quality is most often measured by using valuation models, looking at the association between stock prices (respectively returns) and accounting data. A higher association means the market values the information more, signaling higher accounting quality.
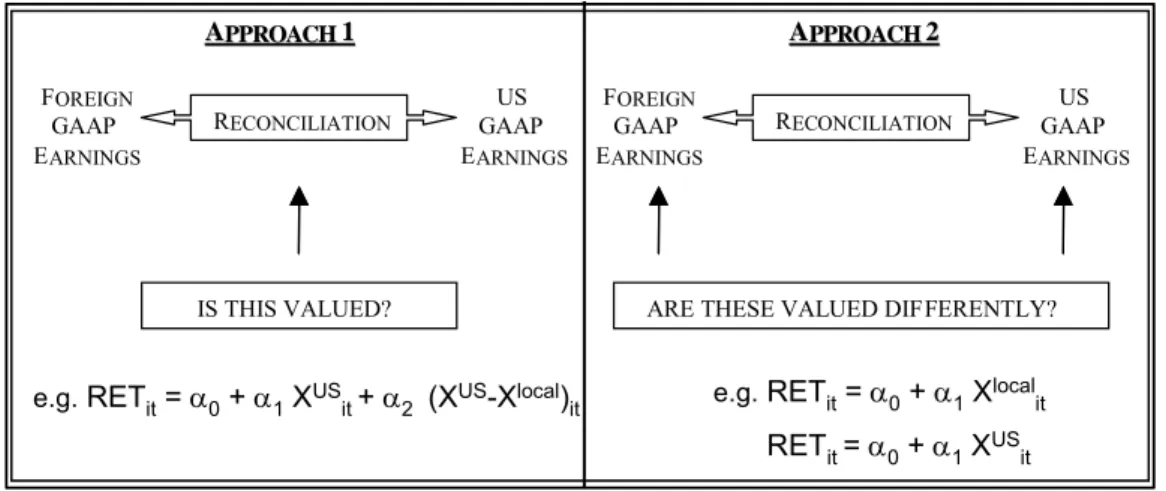
The impact of standards using these valuation models is furthermore tested according to one of the following two approaches (see Figure 1). One approach uses a valuation model where earnings under local GAAP are introduced, together with the reconciliation amount of earnings from local GAAP to US GAAP (APPROACH 1). If the latter (coefficient) is significant, US GAAP earnings are considered to be of higher quality. In the second approach, two valuation models are run: one where local earnings are the sole regressor and one where US GAAP earnings is the independent variable (APPROACH 2). The difference in R²’s or explanatory power determines whether there is a significant difference between in value relevance of local and US GAAP earnings.
5 The first is most often done by practitioners, for they need to be aware of the implications of applying a
certain regime when their clients have the choice (e.g., Ernst&Young 2000). The latter is of particular interest to academics and standard setters.
FIGURE 1:TWO APPROACHES TO COMPARING QUALITY OF DIFFERENT ACCOUNTING REGIMES ON A US STOCK EXCHANGE
FOREIGN GAAP EARNINGS US GAAP EARNINGS RECONCILIATION IS THIS VALUED? FOREIGN GAAP EARNINGS US GAAP EARNINGS RECONCILIATION
ARE THESE VALUED DIFFERENTLY? A
APPPPRROOAACCHH11 AAPPPPRROOAACCHH22
e.g.RETit= α0+ α1XUS
it+ α2 (XUS-Xlocal)it e.g.RETit= α0+ α1Xlocalit RETit = α0+ α1XUS it FOREIGN GAAP EARNINGS US GAAP EARNINGS RECONCILIATION IS THIS VALUED? FOREIGN GAAP EARNINGS US GAAP EARNINGS RECONCILIATION
ARE THESE VALUED DIFFERENTLY? A
APPPPRROOAACCHH11 AAPPPPRROOAACCHH22
e.g.RETit= α0+ α1XUS
it+ α2 (XUS-Xlocal)it e.g.RETit= α0+ α1Xlocalit RETit = α0+ α1XUS
it
The study by Amir et al. (1993) is an example of the first approach. They find that the 20F reconciliations made by Non-US filers are reflected in stock prices and thus are valued by the market. Splitting up the group of foreign filers, Barth and Clinch (1996) moreover find the value of reconciliations to vary depending on the country of residence. For UK and Australian firms, the reconciliations are found to be valued more than for Canadian firms. Given that US GAAP and Canadian GAAP are similar for many items, this finding suggests that the usefulness of reconciliations to US GAAP decreases as the foreign GAAP is more closely comparable to US GAAP.
The other approach is taken for instance by Pope and Rees (1992). In comparing UK and US GAAP constructed earnings (and earnings changes), Pope and Rees run UK stock returns on US and UK earnings separately. R-square comparison lets them conclude that GAAP earnings adjustments add marginally to the ability of earnings to explain returns. Chan and Seow (1996) include earnings figures based on US GAAP and foreign GAAP in their analysis, considering the non-US filers as one group. Surprisingly, they find earnings based on foreign GAAP to have greater information content. Similar as in Barth and Clinch, Alford et al. (1993) further subdivide the foreign filers according to the country of incorporation. They conclude that earnings based on Danish, German, Italian, Singaporean and Swedish GAAP contain less information and are less timely than US GAAP earnings, while earnings based on local GAAP of Australia, France, the Netherlands and the UK are relatively more informative and timely.
Overall, results on US stock exchanges seem to suggest that requiring reconciliations adds value from an investors’ perspective. While all the above studies compare US GAAP to other accounting regimes in a US stock exchange environment only, there is also one study that goes across exchanges and that is the one by Harris et al. (1994). Similar as in the US stock exchange studies, they measure quality by looking at the association between prices and earnings (resp. shareholders’ equity). These associations are however not calculated for the entire sample, but for the German and US stock market separately (e.g., APPROACH 2). Comparing the results, they find that the explanatory power of German earnings is comparable to that in the US, while the explanatory power of shareholder’s equity in Germany is significantly lower than in the US.
With the introduction of the International Financial Reporting Standards6, US GAAP has somewhat lost its benchmark position. Instead of making comparisons between local standards, attention is now focused on the comparison between local standards and IFRS. Before imposing the international standards, governments want to be reassured that the IFRS are equivalent or superior to their national standards, but definitely not inferior. Several researchers have addressed these concerns, looking at different environments where the application of IFRS is allowed next to local GAAP. The findings are however not always in favor of IFRS. Taking a sample from the Helsinki Stock Exchange and running the standard value relevance method using approach 2, Niskanen et al. (2000) examine the incremental information content in IFRS versus Finnish earnings. Their results reveal significant information content in the IFRS earnings, even after controlling for Finnish earnings. Studying the Swiss market, Auer (1996) looks at Swiss companies that switched from Swiss standards to either European Directives or IFRS. He concludes that both IFRS and European Directive compliant earnings provide more information to investors than Swiss data. Recently, there has also been a study on Chinese listed firms that report under both IFRS and local Chinese standards. To compare the quality of both regimes, Eccher and Healy (2000) use a value relevance model but also introduce an alternative measure of quality: the predictability of cash flows. The better an earnings number predicts future cash flows (respectively earnings), the higher the quality of the
6 The revised standards became effective in 1995. The big number of accounting choices assimilated in the
standards7. Results using both models suggest that IFRS data fails to dominate Chinese based data.
Although US GAAP are widely accepted and frequently viewed (and used) as the benchmark for high-quality standards, research on quality differences between US GAAP and IFRS is scarce. We are aware of only three studies that have made this comparison so far. One is performed on a US stock exchange, using a sample of foreign firms that prepare their home country financial statements using IASC standards but in addition reconcile from IFRS to US GAAP in their Form 20F filings. In this study, Eccher and Healy (2000) and Harris and Muller (1999) find that the reconciliations add value, defining value in terms of price and return models. Leuz (2003) however documents that both US GAAP and IFRS are of no significantly different quality. He reaches this conclusion by applying a particular market-based measure where he only looks at capital market data for German firms listed on the German New Market. Higher quality financial statements are those that result in smaller bid-ask spreads (proxying for information asymmetry) and more share turnover (to proxy for market liquidity).
3. BACKGROUND AND RESEARCH OBJECTIVE
Given the existing literature, the inconclusive results and the attention paid to IFRS, we will further address the IFRS / US GAAP dilemma in this study. Differences between the two sets of standards are likely to be relevant. Firstly, on a very general level, we discern both structural and organizational differences between the two standards sets that might impact the quality level of accordingly prepared accounting information. Proponents of US GAAP typically argue that the international standards have not been subject to the same due process as US standards. Both the FASB’s organizational structure, its standard setting process and the enforcement would be better defined. However, others argue that the IFRS standard setting process is open to more input from a wider interest group.
Secondly, turning to the standards themselves, it is often illustrated that US standards are rigorously defined, resulting in a real cookbook of detailed and stringent accounting and disclosure requirements. Considerable attention is paid to exceptions and
special issues and extensive guidance is provided on specialized industry practices. The IASB (International Accounting Standards Board) standards book, on the other hand, is far less voluminous and standards are defined more generally in terms of rules. Whether stricter rules also result in higher quality accounting information remains however an open question. One could argue that information resulting from the application of US standards is more neutral since there are fewer opportunities to manage earnings. Firms are reporting on their economic activity more faithfully and consistently as they are offered fewer opportunities to color the image they communicate for the purpose of influencing behavior in any particular direction. However, one could also argue that the discretion offered by IFRS puts management in a position where it can more freely signal the true economic situation of performance of the company.
Finally, differences in specific standards might also be responsible for differences in the quality of earnings. For example, the opportunity to capitalize R&D under IFRS can result in more value relevant earnings (e.g., see paper 2). Making predictions on earnings and its attributes is however complicated. First, and especially when there is a difference in allowed alternative treatments, it is questionable whether managers will always choose the accounting method on which IFRS and US GAAP differ. Returning to the R&D example, managers might expense development costs even though capitalization is allowed, simply because it is not opportune at that time. Second, since accounting involves reverting effects over time and we cannot determine the application lag for each company and each item, the earnings attribute effect is indistinct.
Based on the above-mentioned arguments, we do expect differences between IFRS and US GAAP earnings to exist. However, it is a priori not clear which standards set will result into higher accounting quality.
4. SAMPLE SELECTION
To test the above hypothesis, we select a sample of German New Market firms. According to the listing requirements of this equity market, firms must report financial statements that are either IFRS or US GAAP compliant. Selecting firms that are listed on
the same market furthermore offers the advantage that capital market elements (like market structure and organization) are comparable for all sample firms.
In particular, we select firms with an IPO date from 1997 through 1999. We conclude on 184 IPO’s. To further ensure a minimum time period for performing robust tests, we single out only those firms that are continuously traded throughout 2001 till the beginning of 2003, leaving us with 168 firms. For these firms, we check the Thomson Worldscope database, which offers capital market data as well as financial statement data. A number of firms are dropped either because they are not included in the database (15) or because the financial information is incomplete (8). For the remaining firms, we also collect hardcopy versions of the financial statements, readily downloadable from the New Market website. We use these reports to check both the firm’s identity and conformity in key accounting data between the New Market information and the Worldscope database. Ten observations are deleted due to inconclusive results on this test. Finally, 2 firms in the financial sector are eliminated because of their very specific character. In addition, 4 firms that are dually listed on NASDAQ or NYSE are dropped, since the quality of those statements might be different due to SEC following (Lang et al 2003).
On all 129 firms included, we select data from the Worldscope database. Financial statement data, like earnings, book value of equity and operational cash flows, are collected on an annual basis for the period 2000-2002. Price data at several points in time during that same period are also gathered. As a results, we obtain 331 firm year observations. Consistent with Collins et al. (1999) and Brown et al. (1999), we require each observation to have a positive book value of equity, dropping 7 firm-year observations8. Afterwards, observations falling in the top or bottom 1% of some of the variables used later on in the multivariate model (such as opening price-deflated earnings) are further excluded to reduce the effect of outliers on the regression results. The final sample includes 321 firm-year-observations, spread over 128 firms.
8 Non-negative book value is a sample requirement imposed by the value relevance models (e.g., Collins et
al. 1999). To obtain comparability across our different measures, we restrict our sample to positive book values at the start. We expect no selection bias, since the negative book value observations are equally spread over the IFRS / US GAAP subsample (4 US GAAP and 3 IFRS).
5. MODEL SPECIFICATION
To examine quality differences between IFRS and US GAAP prepared information, we define quality in terms of earnings attributes. Unlike prior research that tends to focus on one or two earnings attributes at a time, we here consider 4 attributes: value relevance, timeliness, predictability and accruals quality. The first two resort under the group of market-based attributes, while the last two are examples of accounting-based attributes. Differences between IFRS and US GAAP earnings with regard to these attributes are reflected in differences in the models’ R²s 9. To assess whether a difference in the R²s is statistically significant, we need to control for between-sample differences on the variables included in the respective model. To that end, and as shown in Appendix, we develop a test statistic, requiring the estimation of R²’s standard deviations (see Cramer 1987).
Value relevance. Similar as in previous research, we measure value relevance in terms of the contemporaneous association between earnings and stock returns as follows:
RETi,t3 = α0 + α1 1 ,t− i it P X (1a) where RETi,t3 is the annual market adjusted return, ending three months after the
fiscal year end. Xit is earnings per share and Pi,t-1 is the security price at the beginning of
the period. The model’s R², which reflects the degree of association, is estimated for the IFRS and US GAAP sample separately.
Secondly, we also run the price-earnings model as suggested by Ohlson (1995) and Burgstahler and Dichev (1997), where prices are regressed on both earnings and the book value of equity. This results in the following regression:
Pit = α0 + α1 Xit + α2 BVi,t-1 (1b)
9 Most often, comparison between IFRS and US GAAP is executed on a sample of firms that report under
the two reporting regimes simultaneously. Each sample firm is included twice in the study: once to run, for example, the prices on IFRS measures and once on US GAAP measures. If the number of measures is held constant, than comparison between the two regimes happens directly through comparison of the R-squares. To statistically test the difference, one needs to apply a Vuong test (see Dechow 1994). The analysis in this study also consists in comparing an IFRS and US GAAP model, however the models (and the resulting R²s) are estimated using a different sample. To compare these R-squares one needs to control for differences between the samples (e.g., sample size). Statistical tests are performed using the test in Appendix.
where Pit is the security price at the end of the fiscal period t, Xit is earnings per
share and BVi,t-1 is the book value of equity at the beginning of period t. In this regression,
the coefficient on earnings, α1, reflects the pricing effect of current earnings. The
coefficient on beginning-of-year book value of equity captures the effect of expected future normal earnings10. To control for scale effects (Easton 1999), we use White’s correction for heteroscedasticity. Again, our measure of value relevance is based on the explanatory power of the equation.
Timeliness. Consistent with prior research, we test this attribute by running the following Beaver-like reverse regression on the two samples separately:
Xit / Pi,t-1 = α0 + α1 RETit (2)
with RETit being the annual market-adjusted return (corresponding to the fiscal year) and all other variables as previously defined. Timely earnings are those earnings that result in stronger associations or higher R²s for the above model.
Predicability. In testing whether IFRS earnings have different predictive ability than US GAAP earnings, we model the association between future earnings and current as well as past earnings for the IFRS and US GAAP sample separately. We estimate the R² of the following model:
Xi,t+1 = α0 + α1 Xit + α2 Xi,t-1 (3a)
where Xi is earnings per share for firm i either in fiscal year t or fiscal year t-1, and
all variables are scaled by a firm size measure, being sales in year t11.
Additionally, but also examining predictability, we run the Dechow (1998) model, where we regress future operating cash flows on current accounting information. Their model is the following:
10 This is one way of controlling for growth opportunities, as suggested by Holthausen and Watts (2001). 11 Note that we do not apply the measure that is most often used in accounting research to capture size, i.e.
total assets. Reason is that total assets are largely determined by the standards, which might significantly bias our results. We did consider other size measures, such as market capitalization and number of shares, and obtained similar results as in section 6.2.
OCFi,t+1 = α0 + α1 Xi,t (3b)
where OCFi is the operating cash flow for firm i in fiscal year t, scaled by total
sales, and all other variables are as previously defined. Again, the model’s R² is indicative of the predictive ability of current accounting information, with higher values reflecting more predictive ability.
Accruals Quality. Following the Dechow&Dichev model, we run changes in working capital on past, present and future realizations. The focus is on working capital, since related cash flow realizations generally occur within one year. The model is run for the IFRS and the US GAAP sample:
∆WC it = α0 + α1 OCFi,t-1 + α2 OCFit + α3 OCFi,t+1 (4a)
where ∆WCare changes in working capital (scaled by total sales) and all other variables are as previously defined. As pointed out by Dechow and Dichev (2002), a positive sign is expected on both past and future cash flow and a negative sign on current cash flows. A higher explanatory power of the model indicates high earnings or accruals quality. To further control for quality effects caused by the negative coefficient on current cash flows, we also run the model suggested by Wysocki (2004):
∆WCit = α0 + α1 OCFit (4b)
Relatively large R² of model 4a compared to this model reflect high earnings quality, adjusting for the potential effect of income smoothing. An overview of the above attributes is provided in Table 112.
12 In section 6.4, we also control for self-selection biases. Since these self-selection tests are non-significant
but, at the same time, considerably reduce sample size, we report the initial analyses without self-selection control first.
TABLE 1: OVERVIEW OF ATTRIBUTE METRICS
Attribute Model Specification
Value relevance Model 1a RETi,t3 =α0 + α1Xit/Pi,t-1 Model 1b Pit = α0 + α1 Xit + α2 BVi,t-1 Timeliness Model 2 Xit/Pi,t-1 = α0 + α1 RETit Predictability Model 3a Xi,t+1 = α0 + α1 Xit + α2 Xi,t-1
Model 3b OCFi,t+1 = α0 + α1 Xit
Accruals Quality Model 4a ∆WCit= α0+ α1CFOi,t-1 + α2CFOit + α3CFOi,t+1 Model 4b ∆WCit = α0 + α1CFOit
where RETit is the return, MRETit is the market adjusted return over fiscal year t, Xit is earnings per share, Pit-1 is the security price at end of the previous fiscal period t-1 (or the beginning of year t), BVt-1 is the book value of equity at the beginning of period t, OCFit is the operating cash flow for firm i in fiscal year t and ∆WCit is the change in non-cash working capital from year t-1 to t. All variables used in model 3a, 3b, 4a and 4b are scaled by total sales in year t.
6. RESULTS
To obtain comparability across our different metrics, we limit our analysis to investigating the quality of year 2000, 2001 and 2002 accounting data. Reason is that the evaluation of some of the above earnings models not only require data in that specific year, but also data from the previous and following year. In one value relevance model, for instance, we need to scale by the security price at the beginning of the period, while the predictability attribute assumes that accounting information of the next period is known. Since the sample firms have IPO dates from 1997 till the end of 1999, collecting comparable price data on all sample firms can only begin at the end of 1999 (or beginning 2000). By necessity, value relevance models can only start with the reflection of year 2000 accounting information in returns over the year 2000. Also, accounting information on 2004 is not yet available for all firms, making the predictability of year 2003 accounting data impossible.
Before discussing the results on these models, some descriptive statistics are given in the following section.
6.1 D
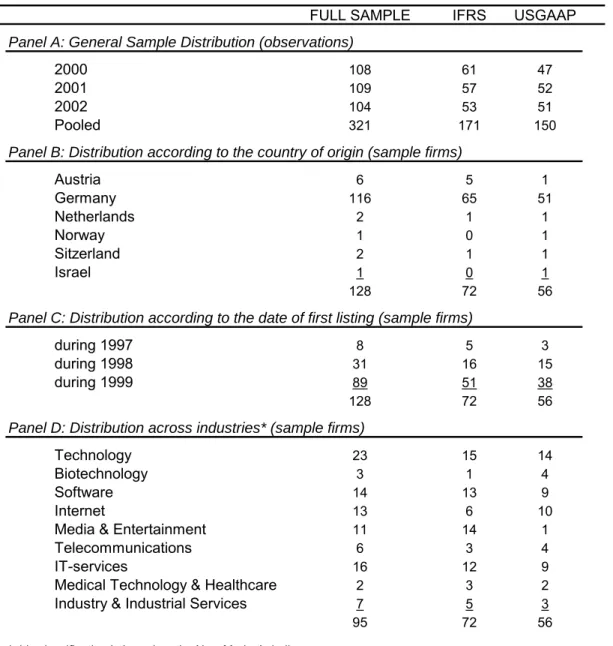
ESCRIPTIVE STATISTICSThe sample consists of 321 firm year observations, covering the period 2000-2003 and collected from 128 different companies (see Table 2, Panel A). The number of observations per accounting period is almost equally distributed, with the least observations on 2002 (due to availability of 2003-accounting data such as earnings). The vast majority of the selected sample firms are incorporated in Germany, first-time listed on the New Market during 1999 and their activities mostly consist of computer or technology-oriented businesses (see Table 2, Panel B, C and D respectively). Firms listed on the New Market are obliged to report either according to IFRS or according to US GAAP. Overall, there is a preference for IFRS (171 versus 150).
FULL SAMPLE IFRS USGAAP
Panel A: General Sample Distribution (observations)
2000 108 61 47
2001 109 57 52
2002 104 53 51
Pooled 321 171 150
Panel B: Distribution according to the country of origin (sample firms)
Austria 6 5 1 Germany 116 65 51 Netherlands 2 1 1 Norway 1 0 1 Sitzerland 2 1 1 Israel 1
Table 3 furthermore provides some descriptive sample statistics on accounting and capital market information. First, the stock market on which the sample firms are traded is characterized by an overall downward trend: on average, prices per share melt down from 23.37 € at the end of 2000 to 3.36 € in 2002. Secondly, the bad economic environment in which these firms operate is also reflected in their accounting information. Firms, on average, end with a negative earnings number (Earnings Per Share= -0.03, -0.16 and –0.31 respectively). Shareholders’ equity is also cut back during this period, where it drops from 7.58 € per share in 2000 to 3.80 € per share in 2002.
0 1
128 72 56
Panel C: Distribution according to the date of first listing (sample firms)
during 1997 8 5 3
during 1998 31 16 15
during 1999 89 51 38
128 72 56
Panel D: Distribution across industries* (sample firms)
Technology 23 15 14
Biotechnology 3 1 4
Software 14 13 9
Internet 13 6 10
Media & Entertainment 11 14 1
Telecommunications 6 3 4
IT-services 16 12 9
Medical Technology & Healthcare 2 3 2
Industry & Industrial Services 7 5 3
95 72 56
* this classification is based on the New Market's indices
Wilcoxon p-value
CAPITAL MARKET INFORMATION Mean Median St. Dev. Mean St. Dev. Mean St. Dev.
Market Price 2000 23.37 14.75 27.54 16.76 17.68 31.93 34.99 0.0146 **
2001 8.24 5.09 10.91 6.53 6.94 10.12 13.86 0.4215
2002 3.36 2.02 5.13 3.02 4.58 3.71 5.68 0.8683
Pooled 11.75 4.75 19.36 9.09 12.94 14.78 24.43 0.3825
ACCOUNTING INFORMATION
Earnings Per Share 2000 -0.03 0.00 0.08 -0.02 0.07 -0.04 0.09 0.2141
2001 -0.16 -0.04 0.44 -0.14 0.27 -0.19 0.57 0.9179 2002 -0.31 -0.11 0.56 -0.39 0.61 -0.23 0.49 0.1289
Pooled -0.17 -0.02 -0.37 -0.17 0.40 -0.16 0.45 0.8320
Shareholders Equity Per Share 2000 7.58 5.65 8.82 8.01 10.68 7.03 5.62 0.9629
2001 5.82 4.37 6.90 6.23 0.27 5.38 4.96 0.3287 2002 3.80 2.82 3.33 3.81 2.55 3.79 4.01 0.2071 Pooled 5.76 4.37 6.93 6.11 8.24 5.36 5.03 0.1766 Total Assets ('000) 2000 239,841 76,041 985,065 320,824 1,300,938 134,735 172,089 0.9186 2001 124,866 63,132 180,560 129,405 192,935 119,891 167,684 0.5767 2002 96,449 51,251 142,299 91,047 135,473 102,063 150,208 0.8326 Pooled 154,342 63,132 588,078 185,800 790,958 118,481 162,833 0.7376
Operating Cash Flow 2000 -4,660 -1,123 36,976 -6,506 46,494 -2,265 18,716 0.9531
2001 2,723 1,111 21,302 5,590 24,475 -419 16,850 0.0537 *
2002 6,768 3,598 13,018 7,258 12,332 6,258 13,800 0.4805 Pooled 1,549 778 26,215 1,792 32,337 1,273 16,813 0.1861
* All numbers are expressed in €, except p-values: *,**= p-value <.10, .05 respectively
Panel A: Full Sample Panel B: IFRS firms compared to US GAAP firms
IFRS US GAAP
TABLE 3: DESCRIPTIVE ACCOUNTING & CAPITAL MARKET INFORMATION
Remarkable is the evolution in total assets. While we expect these firms to expand their asset pool at a rather high rate (since New Market is aimed at high-growth firms), we notice that firms abandon their expansion strategy and even disinvest, with an average drop in total assets of 143,392 €. Overall, however, firms become operationally better, as evidenced by the increase in operating cash flow (-4,660 € in 2000, to 2,723 and even 6,768 in 2002). Combined with the changes in earnings, these results suggest that accruals and thus accounting decisions are of considerable influence.
Looking at panel B of Table 3, we further conclude that the market, in general, does not attach significantly different prices to US GAAP and IFRS firms (p= 0.3825). Note that the market did price the US GAAP compliant companies significantly higher than their IFRS counterparts in 2000 (i.e., 31.93 compared to 16.76; p= 0.0146). However, from 2001 onwards, after some large scale US financial scandals, the market no longer priced these investments differently (e.g., 6.35 versus 10.12; p= 0.4215). The reported earnings number is, in general, not dependent on the applied accounting standards (-0.17 compared to –0.16). In addition, and consistent with prior research, our results also suggest that firms choosing US GAAP, on average, report lower equity numbers per share (e.g., 5.36 versus 6.11 for the pooled sample), and by consequence also lower total assets (e.g., 118,481 versus 185,800). Although the pattern is present in nearly all years, this difference between IFRS and US GAAP is not significant.
6.2 M
ULTIVARIATE MODELSIn testing the quality of IFRS and US GAAP earnings, we apply the metrics discussed in section 5. Differences between IFRS and US GAAP earnings with regard to the four attributes are reflected in (differences in) the models’ R²s. Results from running all four model types can be found in Table 4 through 8. As shown in the tables, we estimate cross-sectional regressions (1) for the three years separately (2000-2001-2002) and (2) for the pooled sample. Where pooling offers the advantage of increased sample size, the year regressions might provide useful insights into time-dependent effects. The year 2001, for example, can typically be characterized as a bad economic environment, with a number of big-time firm collapses, and following that: the bursting of the stock market bubble.
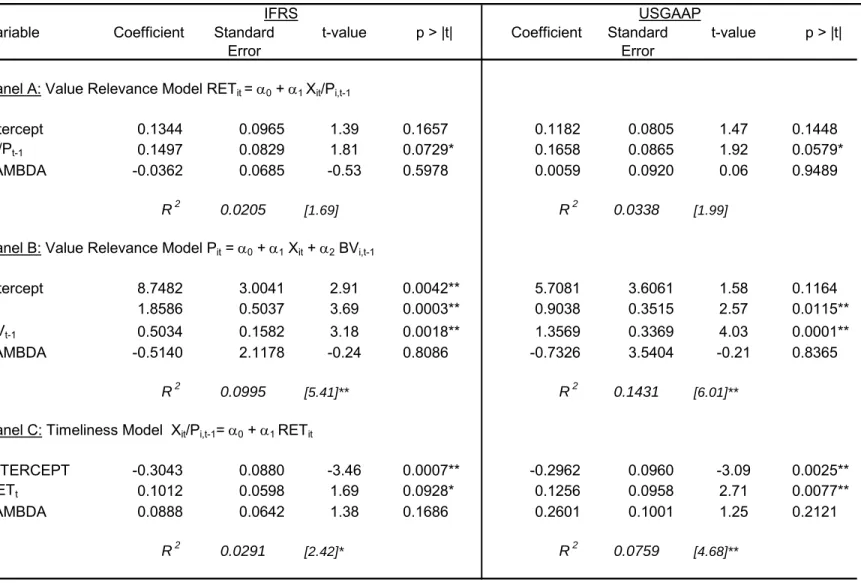
6.2.1 Value Relevance Results
First, running the returns/earnings model on the pooled sample (see Table 4), we obtain R²s of only 2.77% for the IFRS sample and 2.28 for the US GAAP sample. Applying the test statistic developed in Appendix, we furthermore find no evidence (t= 0.14) of US GAAP or IFRS earnings explaining more variance in the share value evolution (assuming of course that prices are good indicators of a share’s value).
Year specific results are presented in the upper level of Panel A (Table 4). The explanatory power of the annual regressions (e.g., 9.14% for US GAAP firms on 2002 accounting data) is higher, but still low compared to other studies. For both the IFRS and the US GAAP sample, we notice a large drop in explanatory power in 2001 (from 13.58% resp. 23.68 to 4.83 resp. 0.02), with only a modest recovery in 2002 (to 5.63% resp. 9.14%). Overall, as documented by the t-statistics, none of the R² differences are significant. In other words, these results seem to suggest that earnings stated according to IFRS capture approximately as much (or as less) value relevant information as US earnings numbers, and vice versa.
Based on the alternative valuation model, where we control for some of the suggested misspecification in the returns/earnings model, we reach similar conclusions. Overall, applying one of the two sets does not make accounting information more or less value relevant. The explanatory power of the two estimated models is very similar (R2 of 6.93% for IFRS versus 7.88% for US GAAP; t= 0.17). As also shown in panel B of Table 4, (book value of) equity under the two standards sets seems to reflect company value, incrementally to the earnings number (with estimated parameter statistics of respectively 0.456 and 1.239). Similar as with the first model, we again notice a significant change in the model R² looking at the year-by-year results. In 2000, IFRS accounting information is (marginally) more value relevant than US GAAP information (19.62% versus 3.60%), while we find the opposite based on 2002 data (37.97% for US compared to 16.61% IFRS compliant firms; t= 1.64). The low value relevance of US GAAP information in 2000, combined with earlier findings on high share prices associated with firms applying US GAAP (see descriptives), support the view of speculation activities on the equity market. The large scandals (e.g., Enron) have considerably reduced share prices, resulting in a more pronounced link with accounting information. Given the inconsistent year results, we also further address issues of model misspecification in section 6.3.
Panel A: RETit3=α0 + α1Xit/Pi,t-1 α0 α1 R² α0 α1 R² t-statistic t=2000 0.297 2.366 0.1358 0.229 1.586 0.2368 0.79 (5.07)** (3.04)** [9.27]** (5.59)** (3.74)** [13.96]** t=2001 -0.123 0.340 0.0483 -0.140 -0.011 0.0002 0.76 (-2.02)** (1.67)* [2.79]* (-2.29)** (-0.10) [0.01] t=2002 0.158 0.113 0.0563 0.277 0.300 0.0914 0.35 (3.39)** (1.74)* [3.04]* (3.81)** (2.22)** [4.93]** Pooled 0.098 0.180 0.0277 0.099 0.146 0.0228 0.14 (2.73)** (2.20)** [4.82]** (2.66)** (1.86)* [3.46]* Panel B: Pit = α0 + α1 Xit + α2 BVit-1 α0 α1 α2 R² α0 α1 α2 R² t-statistic t=2000 6.337 1.915 2.100 0.1962 27.845 1.542 0.964 0.0360 1.49 * (1.14) (2.48)** (1.69)* [6.71]** (3.45)** (1.38) (0.98) [0.82] t=2001 6.316 1.375 0.262 0.2303 4.182 2.069 1.313 0.3815 1.14 (4.78)** (3.02)** (5.28)** [8.08]** (1.55) (3.11)** (3.00)** [15.11]** t=2002 2.983 0.997 0.257 0.1661 0.489 0.752 0.817 0.3797 1.64 ** (5.10)** (1.47) (1.51) [4.88]** (0.51) (1.34) (2.54)** [14.69]** Pooled 7.559 1.235 0.456 0.0693 9.140 1.440 1.239 0.0788 0.17 (5.58)** (2.59)** (1.82)* [6.10]** (2.99)** (2.07)** (2.82)** [6.29]**
Note. T-statistics on the parameters are presented between ( ) while the overall model's F-test is mentioned between [ ]; *,**= p-value <.10, .05 respectively
IFRS US GAAP
US GAAP IFRS
TABLE 4:VALUE RELEVANCE RESULTS
6.2.2 Timeliness Results
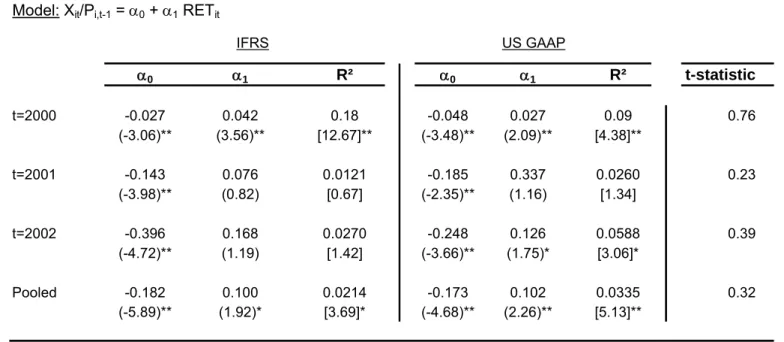
In Table 5, we present results from running model 2, measuring timeliness of accounting data. In all the estimated models, returns are used as an indicator of firm-specific news. Using market-adjusted returns controls for any other, market or economy-wide information reaching the investor public. Results on the pooled sample suggest that IFRS is as timely as US GAAP in reflecting news (t= 0.32), while the overall power of the timeliness models remains relatively low (R² of 2.14% versus 3.35%). Looking at the annual regressions, we notice a drop in the models performance for 2001 and 2002 accounting data, consistent (and not surprisingly, given the high degree of correspondence between the variables) with the value relevance results. Most models even become meaningless, with F-statistics ranging from 1.21 to 5.88.
In sum, and in line with the value relevance models, this seems to suggest that accounting information in itself, whether it is stated according to IFRS or US GAAP, is not value relevant nor timely for the sample firms at hand. Alternatively, it might also be argued that market prices/returns are bad value indicators for these sample firms. To further assess the appropriateness of accounting information in this context (and to discern between one of the two above explanations), we remove pricing associations and concentrate uniquely on accounting data with the next attribute metrics.
Turning to these accounting-based models, we note that the models generally result in higher R²s than the market-based models, consistent with prior findings (e.g., Choi et al. 2003). As documented in Table 6, the R² of the predictability models is generally above 20%, much higher than the R² obtained for the market-based models.
TABLE 5: TIMELINESS RESULTS Model: Xit/Pi,t-1 = α0 + α1 RETit
α0 α1 R² α0 α1 R² t-statistic t=2000 -0.027 0.042 0.18 -0.048 0.027 0.09 0.76 (-3.06)** (3.56)** [12.67]** (-3.48)** (2.09)** [4.38]** t=2001 -0.143 0.076 0.0121 -0.185 0.337 0.0260 0.23 (-3.98)** (0.82) [0.67] (-2.35)** (1.16) [1.34] t=2002 -0.396 0.168 0.0270 -0.248 0.126 0.0588 0.39 (-4.72)** (1.19) [1.42] (-3.66)** (1.75)* [3.06]* Pooled -0.182 0.100 0.0214 -0.173 0.102 0.0335 0.32 (-5.89)** (1.92)* [3.69]* (-4.68)** (2.26)** [5.13]**
Note. T-statistics on the parameters are presented between ( ) while the overall model's F-test is mentioned between [ ]; *,**= p-value <.10, .05 respectively
IFRS US GAAP
6.2.3 Predictability Results
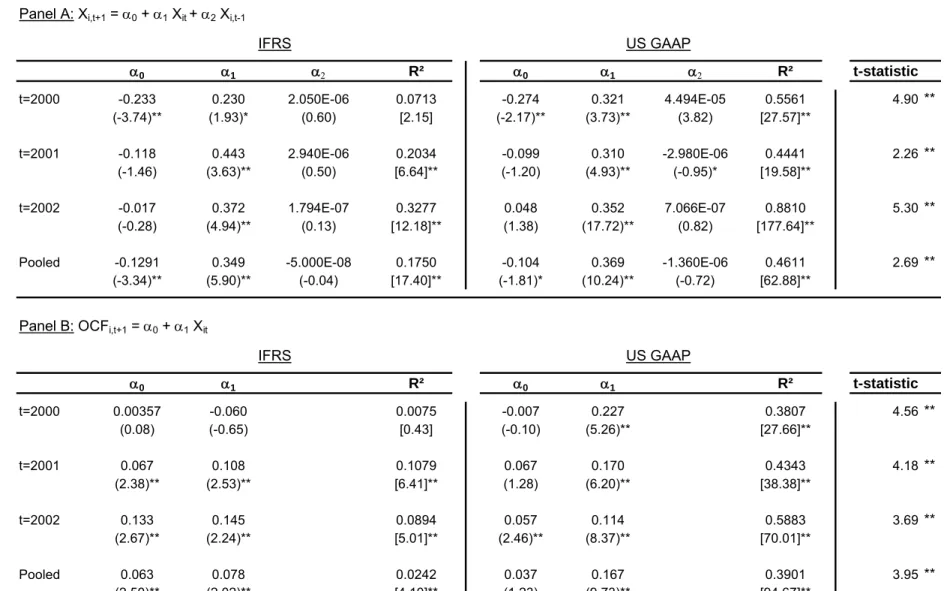
As discussed in the models section, predictability can be measured running an autoregressive earnings model and evaluating the model’s R². The results we obtained on the two samples are presented in Table 6. In general, our results indicate that US GAAP data better predict future performance than IFRS data (R² of 46.11% compared to 17.50%). The difference is significant at the 5% level (t= 2.69). Results from the annual regressions are consistent with the pooled results. In all three years, we find that US GAAP earnings have significantly more predictive ability than IFRS earnings (e.g. R2 of 32.77% for IFRS and 88.10% for US GAAP accounting on 2002 information).
The results on the Dechow et al. (1998) model provide further support for the superiority of US GAAP earnings. Based on the pooled sample, we clearly discriminate between the predictive ability of US GAAP and IFRS information (R² of 39.01% respectively 2.42%; t= 3.95). Remarkably, IFRS accounting data result in overall low performance of this measure (e.g., R2 of 0.75% in 2000)13. Looking on a year-by-year basis, we again find consistency in all three years.
13 Alternatively, we also ran a model where the current earnings number is split up in its major components,
being operating cash flow and accruals. In general, our results show that these models are associated with higher explanatory power (also for the IFRS sample). Consistent with the findings reported here, we find strong evidence for US GAAP superior predictive ability.
Panel A: Xi,t+1 = α0 + α1 Xit + α2 Xi,t-1 α0 α1 α2 R² α0 α1 α2 R² t-statistic t=2000 -0.233 0.230 2.050E-06 0.0713 -0.274 0.321 4.494E-05 0.5561 4.90** (-3.74)** (1.93)* (0.60) [2.15] (-2.17)** (3.73)** (3.82) [27.57]** t=2001 -0.118 0.443 2.940E-06 0.2034 -0.099 0.310 -2.980E-06 0.4441 2.26** (-1.46) (3.63)** (0.50) [6.64]** (-1.20) (4.93)** (-0.95)* [19.58]** t=2002 -0.017 0.372 1.794E-07 0.3277 0.048 0.352 7.066E-07 0.8810 5.30** (-0.28) (4.94)** (0.13) [12.18]** (1.38) (17.72)** (0.82) [177.64]**
Pooled -0.1291 0.349 -5.000E-08 0.1750 -0.104 0.369 -1.360E-06 0.4611 2.69**
(-3.34)** (5.90)** (-0.04) [17.40]** (-1.81)* (10.24)** (-0.72) [62.88]**
Panel B: OCFi,t+1 = α0 + α1 Xit
α0 α1 R² α0 α1 R² t-statistic t=2000 0.00357 -0.060 0.0075 -0.007 0.227 0.3807 4.56** (0.08) (-0.65) [0.43] (-0.10) (5.26)** [27.66]** t=2001 0.067 0.108 0.1079 0.067 0.170 0.4343 4.18** (2.38)** (2.53)** [6.41]** (1.28) (6.20)** [38.38]** t=2002 0.133 0.145 0.0894 0.057 0.114 0.5883 3.69** (2.67)** (2.24)** [5.01]** (2.46)** (8.37)** [70.01]** Pooled 0.063 0.078 0.0242 0.037 0.167 0.3901 3.95** (2.50)** (2.02)** [4.10]** (1.23) (9.73)** [94.67]**
Note. T-statistics on the parameters are presented between ( ) while the overall model's F-test is mentioned between [ ]; *,**= p-value <.10, .05 respectively
IFRS US GAAP
IFRS US GAAP
TABLE 6: PREDICTABILITY RESULTS
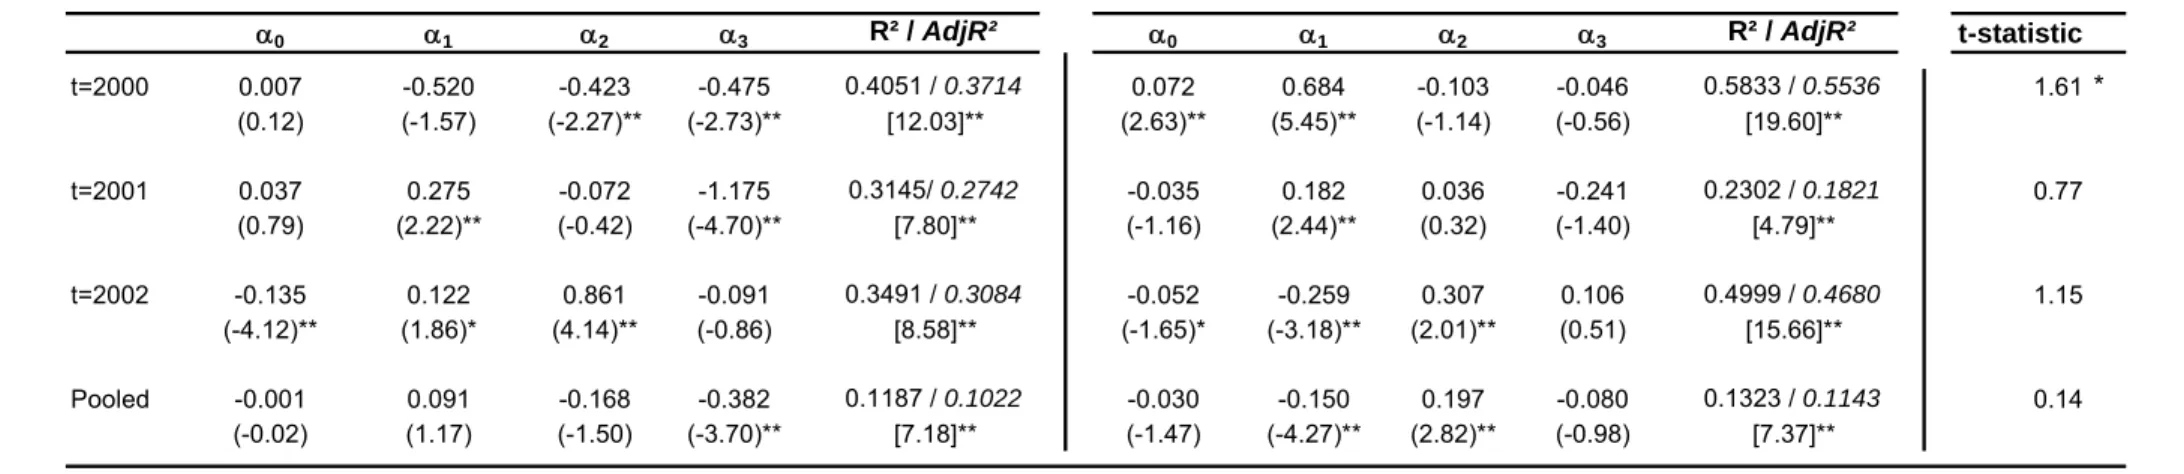
6.2.4 Accrual Quality Results
Finally, the results with regard to accruals quality are reported in Table 7. In general, these results suggest that the quality of accounting accruals does not significantly differ depending on the accounting standards applied. The Dechow&Dechiv measure on the pooled sample, for example, results in R²s of 13.23% for US GAAP observations and 11.87% for IFRS observations (t=0.14).
In an attempt to capture the degree of (working capital) income smoothing, we run working capital accruals only on the current operating cash flow (model 4b). As shown in Panel B of Table 7, both standards sets are associated with some income smoothing. However, in general, there is no significant difference between IFRS and US GAAP smoothing behavior (R² of 4.83% versus 0.77%; t= 0.64). Consistent with Wysocki, we deduct the R² of model 4b from the R² of model 4a to control for any current year income smoothing effects (see Panel C of Table 7). Applying this procedure on our data, we find further evidence that there are no significant differences between the quality of IFRS and US GAAP accruals (adjusted R² differences of 5.97% on the pooled IFRS sample compared to 11.33% on the US GAAP observations; t= 0.66).
Based on model 4a, the year-by-year analyses are mostly consistent with the above results. Nevertheless, further analyses show interesting developments. First, we find that US GAAP accruals are qualitatively better than IFRS accruals for 2000 data (R2 of 58.33% compared to 40.51%; t= 1.61). Moreover, we also find that the application of both standard sets is associated with some (but not significantly different) income smoothing behavior (t= 0.86). In contrast, results from 2001 show that US GAAP firms engage in significantly more income smoothing compared to IFRS firms (t= 1.64). From the large drop in IFRS model performance from 2000 to 2001 (R2 from 27.63% to 1.65%), compared to only a small change for US GAAP firms (from 16.93% to 11.61%), we infer that not as much US GAAP but rather IFRS is causing the overall year difference in accruals quality. For 2003, we again observe no significant differences between the IFRS and US GAAP sample (t=0.72).
TABLE 7: ACCRUALS QUALITY RESULTS
- 31 -
Panel A: ∆WCit = α0 + α1 OCFi,t-1 + α2 OCFit + α3 OCFi,t+1
α0 α1 α2 α3 R² / AdjR² α0 α1 α2 α3 R² / AdjR² t-statistic
t=2000 0.007 -0.520 -0.423 -0.475 0.4051 / 0.3714 0.072 0.684 -0.103 -0.046 0.5833 / 0.5536 1.61* (0.12) (-1.57) (-2.27)** (-2.73)** [12.03]** (2.63)** (5.45)** (-1.14) (-0.56) [19.60]** t=2001 0.037 0.275 -0.072 -1.175 0.3145/ 0.2742 -0.035 0.182 0.036 -0.241 0.2302 / 0.1821 0.77 (0.79) (2.22)** (-0.42) (-4.70)** [7.80]** (-1.16) (2.44)** (0.32) (-1.40) [4.79]** t=2002 -0.135 0.122 0.861 -0.091 0.3491 / 0.3084 -0.052 -0.259 0.307 0.106 0.4999 / 0.4680 1.15 (-4.12)** (1.86)* (4.14)** (-0.86) [8.58]** (-1.65)* (-3.18)** (2.01)** (0.51) [15.66]** Pooled -0.001 0.091 -0.168 -0.382 0.1187 / 0.1022 -0.030 -0.150 0.197 -0.080 0.1323 / 0.1143 0.14 (-0.02) (1.17) (-1.50) (-3.70)** [7.18]** (-1.47) (-4.27)** (2.82)** (-0.98) [7.37]**
α0 α1 R² / AdjR² α0 α1 R² / AdjR² t-statistic
t=2000 -0.011 -0.699 0.2763 / 0.2636 0.053 0.138 0.1693 / 0.1509 0.86 (-0.19) (-4.66)** [21.76]** (1.45) (3.03)** [9.17]** t=2001 -0.038 0.144 0.0165 / 0.0020 -0.064 0.087 0.1161 / 0.0985 1.64** (-0.78) (0.94) [0.89] (-2.23)** (2.56)** [6.57] t=2002 -0.130 0.804 0.2914 / 0.2776 -0.031 -0.164 0.3921 / 0.3797 0.72 (-4.00)** (4.58)** [0.02] (-0.96) (-5.62)** [31.61]** Pooled -0.021 -0.277 0.0483 / 0.0425 -0.028 -0.025 0.0077/ .0010 0.64 (-0.69) (-2.89)** [8.38]** (-1.30) (-1.07) [3.82]*
Note. T-statistics on the parameters are presented between ( ) while the overall model's F-test is mentioned between [ ]; *,**= p-value <.10, .05 respectively
IFRS
Panel B: ∆WCit = α0 + α1 OCFit
US GAAP
Adj R² Adj R² Adj R² Diff Adj R² Adj R² Adj. R² diff t-statistic
(Model 4a) (Model 4b) (Model 4a-4b) (Model 4a) (Model 4b) (Model 4a-4b)
t=2000 0.3714 0.2636 0.1078 0.5536 0.1509 0.4027 2.55 ** [12.03]** [21.76]** [19.60]** [9.17]** t=2001 0.2742 0.0020 0.2722 0.1821 0.0985 0.0836 1.81 ** [7.80]** [0.89] [4.79]** [6.57] t=2002 0.3084 0.2776 0.0308 0.4680 0.3797 0.0883 0.62 [8.58]** [0.02] [15.66]** [31.61]** Pooled 0.1022 0.0425 0.0597 0.1143 0.0010 0.1133 0.66 [7.18]** [8.38]** [7.37]** [3.82]* IFRS US GAAP
Note. T-statistics on the parameters are presented between ( ) while the overall model's F-test is mentioned between [ ]; *,**= p-value <.10, .05 respectively Panel C: Comparing model 4a and 4b
6.2.5 Conclusion
In general, we find no significant differences between US GAAP and IFRS prepared financial statement data. Only with regard to predictability do we find results in favor of US GAAP application.
Two remarks are however in order. First, our results show that the market-based models are under-performing, with an all-time low on the 2001 data. Prior literature in this regard suggests that these results might be caused either by deficiencies in the accounting information or by a misspecification of the model. According to some, the low associations found in the price-earnings literature (e.g., Core et al. 2003) suggest that earnings (and more in general accounting data) have become deficient, and an update of the financial reporting model is needed. However, as our results show, financial statement information still leads to good predictions about future performance, one of the main premises of accounting information. Also, the accounting deficiencies argument cannot fully explain the sudden drop in model performance in 2001, given the reasonably good results in 2000.
In this case, model misspecification is more plausible. Some argue that prices (especially in the new economy market we study) have been increasingly fed by speculative beliefs (e.g., Choi et al. 2003). Accordingly, questions should be raised as to the desirability of prices as firm value indicators (e.g., Penman 2002; US GAAP 2000 value relevance results). Another possible misspecification is further addressed in the extensions section below. In particular, since descriptive statistics showed that relatively more firms are confronted with losses in 2001, price/earnings models in their current specification might be less appropriate for judging earnings quality.
A second remark that needs to be made is with regard to the year-by-year regressions. Especially with regard to the accruals quality metric, we observe some interesting and sometimes inconsistent patterns. Based on these measures, we would conclude that US GAAP initially resulted in qualitatively better accruals, but throughout our sample period, IFRS accruals gained more quality, resulting in increased comparability between IFRS and US GAAP compliant information. The fact that we observe an important change for 2001 IFRS data is perhaps not that surprising. Around that time, the IASB completed its five-year project developing a set of core standards. On May 17th 2000, IOSCO decided to approve and endorse that set, permitting its members
(and thereby also the German New Market participants) to prepare financial statements in accordance with those core standards. As observed, this might have resulted in less income smoothing and higher accruals quality for IFRS compliant financial statements.
However, several arguments can be formulated that challenge this view. First, if the standards were endorsed in 2000, why do we only observe the low model performance on 2001 accounting data (and not on 2000 and 2002 data)? Second, the results on the US 2001 sample seem to indicate that US GAAP application also results in a decrease in accruals quality (and in income smoothing behavior as well), suggesting that the bad economic environment might be causing this result14. Finally, we also need to consider
possible sample size biases. On average, the annual regressions are run on 50 observations. As a result, individual observations can have a significant influence on the estimated model.
6.3 E
XTENSIONIn this section, we further examine possible misspecification of the market-based models. In particular, we respecify some models to distinguish between positive and negative news/earnings periods. Market prices might, for example, react differently to positive and negative earnings, while the earnings number in itself might be timelier in reflecting bad news compared to good news. Given the extreme financial conditions of our sample firms (e.g., reported losses and decreasing prices, see Table 3), we expect this respecification to be highly relevant (see also Hayn 1995).
In this context, we apply measures as developed by Collins et al. (1999) and Basu (1997). More specifically, we test whether there are any asymmetries in the value relevance respectively timeliness of IFRS and US GAAP prepared information. The models we run on the two samples separately are the following:
Model 1’: Pit = α0 + α1 Xit+ α2 DX + α3 Xit * DX + α4 BVt-1
Model 2’: Xit / Pi,t-1 = α0 + α1 RETit + α2 DR + α3 RETit * DR
14 This finding is consistent with the market-based models. As already suggested, this might indicate that
accounting information in general was less appropriate to reflect the financial performance of this type of firms, in economically bad situations. Combined with the accruals quality results from 2002 (i.e. an increase in model performance), this confirms earlier findings on timeliness.