Linking Clientele Needs with Extension Programming Objectives: Using Cluster Analysis to Group New England Dairy Farms
By
Jie Dai, The University of Vermont, Department of Community Development and Applied Economics, 004 Morrill Hall, Burlington, Vermont 05405.
Phone (802) 656 8289 e-mail: [email protected]
Robert Parsons, The University of Vermont, Department of Community Development and Applied Economics, 204 Morrill Hall, Burlington, Vermont 05405.
Phone (802) 656 2109 e-mail: [email protected]
Paper prepared for presentation at the American Agricultural Economics Association Annual Meeting, Montreal, Canada, July 27-30, 2003
Copyright 2003 by Jie Dai and Robert Parsons. All rights reserved. Readers may make verbatim copies of this document for non-commercial purposes by any means, provided that this copyright notice appears on all such copies.
Introduction
This study examines the current status of dairy farmers in Vermont in order to provide Cooperative Extension a more accurate picture and measure of clientele production practices, satisfaction, and future concerns. The driving force behind this study is the need for extension to focus declining resources on the greatest needs of their clientele. In many cases, this can only be done by obtaining the most current image of their state’s agricultural industry.
In Vermont, the dairy industry historically accounts for more than 80% of the states agricultural income. But the dairy industry has been undergoing dynamic changes while remaining in a dominant position. In New England, the dairy industry is primarily located in Vermont and in Maine to a lesser extent. But nationally, the dairy industry has been shifting to bigger herds in western states.
New England farms have not escaped the national trends. Herd sizes have increased from 40 cows in 1970 to 60 cows in 1990 to more than 100 cows per farm in 2001. Cow numbers have remained fairly constant over the past decade but milk
production per cow has increased, with the state average approaching 18,000 pounds of milk per cow. Overall milk production has grown steadily with Vermont maintaining its position in the nation, producing 1.6% of the nation’s milk production in 1970 and the same amount in 2001.
The big change has occurred in the number of dairy farms, which have decreased at an annual rate of 2-5% per year since 1970. Today, Vermont has fewer than 1500 dairy farms which are larger, more productive, but still facing pressures of growing in the future to remain economically viable.
This dynamically changing industry has created new challenges for University of Vermont (UVM) Extension, who is charged with providing production and business education to the state’s ag industry. With fewer resources, there is greater need to put emphasis on educational programs most needed by clientele. But. UVM Extension, as in other states, needs a greater understanding of the changing farm population for planning programing needs.
Mail Survey
In order to obtain an updated picture of the state’s dairy industry, a survey was undertaken by UVM Extension of dairy farm operators. A mail survey instrument was developed that included questions on farmer and farm demographics, uses of technology, future plans, labor practices, satisfaction, and future needs.
The mail survey followed the Dillman (1978) method. The mailing list included all Vermont dairy farmers. The survey was sent as first class mail and included a cover letter and postage return envelope. Names were checked off as surveys were returned. To those farmers who had not responded, a follow-up survey form was mailed 10 days after the initial mailing. A subsequent final mailing was made in another 2 weeks. A total of 870 completed surveys were returned for analysis, for a response rated of 60.0%.
Initial Findings
The surveys were analyzed with SPSS 11.0. Initial analysis provided an updated picture of Vermont dairy farms. The farms averaged 115.cows producing 17,352 pounds of milk per cow. The averages are somewhat influenced by several large herds, as
indicated by the median herd size of 70 cows and milk per cow at 19,0412 (Table 1). The average farm had 281 acres of cropland and 54 acres of pasture.
The most common milking system in Vermont is a round-the-barn pipeline (53.2%) with less than 40% using a parallel, herringbone, or flat parlor. The most common technologies found on dairy farms is the use of manure storage pits and feeding TMR rations. One growing area is the use of custom manure hauling, now used by 35% of the farms. Some reports indicate that up to two-thirds of farms own computers. This survey was more specific, finding that 39.4% of farmers used computers for keeping farm records. This is nearly as high as those farmers using DHIA for dairy production records. Grazing remains a common practice in Vermont, with just less than half of the farms grazing milk cows. Of these herds, only 43.4% practice intensive grazing, moving cows to a new pasture at every day.
The use of bST remains a controversial issue in Vermont. The survey found that only11% of the farms were willing to report they used bST. Although there is no other indication of the use of bST, there is little reason to suspect farmers would report using bST when they don’t. Conversely, because of its controversial nature, there would be reason to believe that some farmers who do use bST may not admit that they do use it to increase milk production. What is more striking is that the herds using bST account for 25% of the state’s dairy cows and nearly 35% of the milk production.. Another measure indicates that herds using bST average nearly 20,900 pounds of milk per cow while the herds not using bST average only 16,400 pounds of milk per cow.
While the survey found major variation among the farms, there was the same level of variation among the farm operators. Average age was 49.2 years, with 37.6% younger than age 45 and 26.6% age 56 or older. Only 11.5% of the farms had less than a high school education and 44.5% had attained a post-high school education. Off-farm income is more the rule than the exception, with only 37.8% of the farms not relying on off-farm income. Debt is not perceived to be a major problem on farms, with only 16.3% of the farms having a debt/asset ratio greater than 50%.
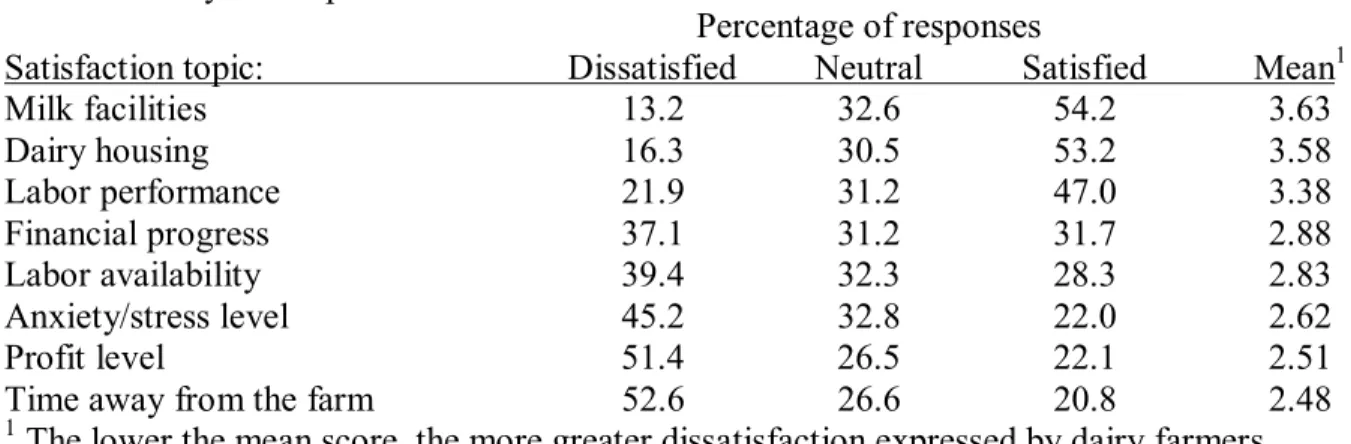
The survey went deeper than also asked the farmers their current satisfaction and future concerns. The farmers were most satisfied with milking facilities and dairy housing on their farms (Table 2). However, they were least satisfied with time away from the farm. This ranked lower than profit level and financial progress. Another major area of dissatisfaction was with anxiety/stress level with running today’s complex dairy farms.
Farmer concerns for the future were more variable than levels of satisfaction (Table 3). To no surprise, the number one concern was milk pricing. Other areas of high concern were real estate taxes, environmental regulations, and local government
regulations. The lowest concern was for development pressures, estate planning, and transferring the farm to the next generation. Labor availability and costs for farm expansion were middle level concerns.
Association with Extension Programming
Extension administrators across the US are under growing pressure from the dual combination of dwindling resources and the demand for greater accountability of
on-going programs. Its not just enough to conduct meetings that reach a number of
individuals. Extension faculty are now required to show the importance of their program and measure the outcome and impact on their clientele. This makes it essential that limited extension programing resources are directed greatest needs. The difficult part of this process can be defining what are the exact needs of clientele. We think we know our clientele but extension faculty keep up with changing needs, and demands. The world and our clientele are changing. Is extension programing meeting the new demands?
In Vermont, more than 80% of ag receipts are from dairy farming. This makes dairy the most important economic ag sector in the state and deserving of the attention of UVM Extension. But there remains the question of whether extension is fully aware of the needs and concerns of today’s dairy farmers and whether they address programs to address specific topics.
One of the primary purposes of this survey was to provide extension with an updated profile of Vermont’s dairy farm operators and their concerns. The initial analysis provides a picture of diversity of the state’s dairy farm population. In addition, the survey revealed several topics of major concern to dairy farmers. However, this information needs further analysis to provide useful information that can provide
valuable insight to design future programming. This issue will be addressed through the use of cluster detailed statistical analysis.
Cluster Analysis
Survey responses were analyzed with cluster analysis in SPSS 11.0 in an effort to identify those groups of farmers with similar concerns. By grouping the farmers, we can
gain greater identification of the individuals that will aid in directing future extension programing efforts.
Cluster analysis is based on the hypothesis that farmers concerns over different issues may differ based on operator demographic characteristics and farm characteristics. The clusters were based on concerns listed in Table 3 (milk price, real estate taxes,
environmental regulations, local government regulations, labor availability, costs for farm expansion, estate planning/taxes, transfer farm to the next generation, and development pressures). Any distinct grouping would permit examining the groups by farm and operator characteristics, and farm operator characteristics among the groups.
The analysis used the K-means clustering partition technique. Cluster analysis was defined Aldenderfer and Blashfield (1984) as a “multivariate statistical procedure that starts with a data set containing information about a sample of entities and attempts to reorganize these entities into relatively homogeneous groups.” Partitioning methods “begin with the partition of observations into a specified number of clusters. This partition may be random or nonrandom basis. Observations are then reassigned to clusters until some stopping criteria is reached. Methods differ in the nature of the reassignment and stopping rules” (Punj and Stewart, 1983). K-means clustering that is carried out in this study is a partitioning method that is used widely in segmentation studies. It assigns observations to the nearest cluster, using an Euclidean distance measure.
The questions on farmers concerns were measured on a Likert scale, with 1 = minimum concern to 5 = greatly concerned. We examined several different clusters and found the most distinct separation of individual observations with 4 clusters. The
clustering procedure converged after 13 iterations. Each cluster was then examined by farm and farmer characteristics and analyzed by chi-square and t-tests to identify key characteristics associated with each cluster.
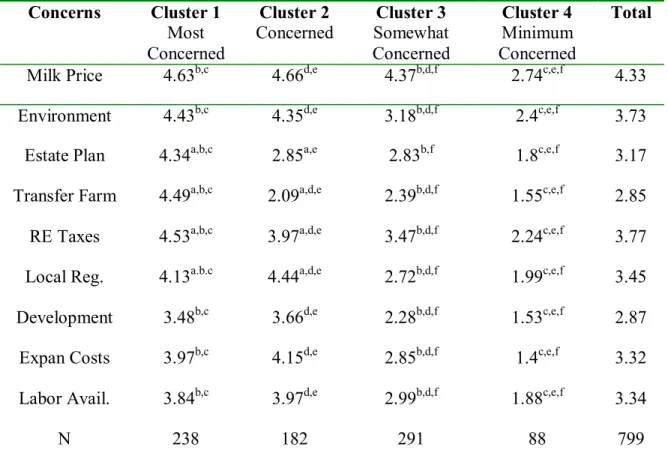
The clusters as related to farmer concerns are shown in Table 4. Cluster 1 was most concerned of all groups about the future of the farm, environmental regulations, and real estate taxes. Cluster 1 was 2nd in concern over local regulations, development, expansion costs, and labor availability. Cluster 2 was most concerned over labor availability, expansion costs, development, and local regulations. Cluster 3 was consistently most the 3rd most concerned group on all topics except estate planning, for which they ranked 2nd. The last cluster was least concerned about all topics, including milk price. Statistically, each cluster showed significant difference between the other clusters on most topics.
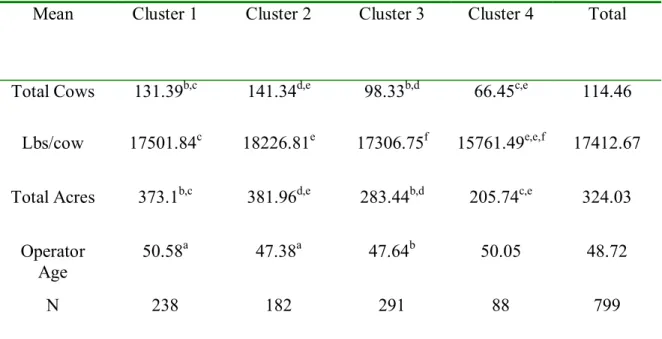
The demographics showed distinct differences between the clusters. Cluster 1 and 2 had similar and above average herd sizes although Cluster 1 had higher milk production (Table 5). Cluster 3 averaged 98 cows and slightly lower milk production. Cluster 4 had significantly fewer cows, lower milk production, and less acres. The age showed to be an interesting factor in determining groups. Cluster 1 and cluster 4 were very similar in age while cluster 2 and 3 were nearly identical in age.
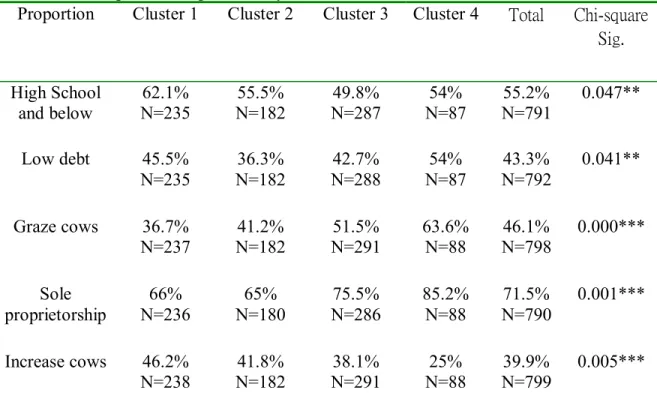
Other demographical characteristics proved to be significant but did not fit a distinct pattern. Cluster 1 was the least likely to have a post high school education and graze their milk cows. Conversely, Cluster 4 was most likely to most likely to have low debt, graze, and be sole proprietor ownership. Cluster 4 was also the lease likely to increase cow numbers and were most satisfied with their financial progress over the past
5 years. An interesting point on the clusters is that the larger the herd size, the most likely they were to plan to increase herd size in the next 3 years.
On the use of technology, Cluster 2, with fewer cows than Cluster 1, is most likely to make use of individual technologies. Closely following is Cluster 1, which is most likely to use most of the technologies as compared to Cluster 3 and 4. Interestingly, Cluster 4 is the least likely to use any of the listed technologies. With smaller herds, and lower milk production, these farmers are not only least concerned about the future, they tend to be more satisfied and use less of the labor saving and informational technologies. However, Cluster 4 makes less use of DHIA, bST, manure pit, and custom manure hauling, these items were not found to show statistical significance between the individual clusters.
Discussion
The different clusters provide a grouping of the dairy farmers. The group of smallest farmers provides an unique picture. This group have the smallest farms, are least productive, are most satisfied with financial progress, and are least concerned about milk prices. This may be difficult to understand but apparently this group are older, more financially secure, and have a shorter time outlook than some of the other farmers. From a programming perspective, this group is not as expansion ro technology driven. The areas of greatest concern seem to be environmental and real estate taxes. In a relative nature, estate planning and transfer farm issues are not as pressing as the other groups.
One major characteristic of Cluster 4 is their use of grazing. These farmers are most likely operating low input production systems based on grazing. Obviously, grazing
programs with less emphasis on technology would be best focused on this group.
However, the relative small size of the cluster would indicate that while grazing programs would greatly benefit this group, a grazing program would not be the ideal program for the majority of dairy farmers.
Cluster 1 provides an insight on that are very concerned about estate planning and transferring the farm business. The farms are bigger than average, with average
productivity, and below average debt levels. Succession is an key concern for many of the farms. There is a worry on many farms about the possibility of estate taxes, providing enough funding for the older generation’s retirement, and not placing too much of a financial burden on the operating farm. This group is letting us know that these topics are the pieces that separate them from the rest of the farm population.
Cluster 2 presents some distinct characteristics. Unlike Cluster 1, this group does not palace a high concern on farm succession and estate planning. This may be directly due to their younger age. Cluster 2 farms are just slightly larger than Cluster 1 but is more productive based on milk per cow. The do have a greater concern over expansion costs and local regulations but are less likely to be planning to expand herd size in the next 3 years. Cluster 2 farms are also more likely to use technology, especially the computer for farm records.
Cluster 3 provides little clear distinction, showing significant differences from Clusters 1,2 and 4 for all concern categories except for estate planning. This group is below average in size, next to youngest in age, and have a general tendency to graze their milk cows. However, they do not make as much use of technology than clusters 1 and 2 but more than cluster 4. One unexplained twist is that Cluster 3 is most likely to use
DHIA as compared to the other groups. Another aspect is that Cluster 3 is the most educated, on average.
Programing Suggestions
The above results provide some guidelines for addressing the needs of the state’s dairy farmers. The two most important programs appear to be estate and business transfer planning and grazing. These specific programs will address the needs of Cluster 1 and 4. These topics are ones that do not seem to go out of style. Although there seems to be an expansion mood on most farms, there does remain a need to provide education programs on grazing and low input production systems. With the high cost of modern dairy farm systems, there does remain a place for grazing systems in the future of for the survival of dairy in Vermont.
Cluster 2 appears to be more focused on future expansion within the pressures with surrounding land development. There is a need to also address the concern for local regulations. This is one category where further identification of the physical location of the farm would be of great benefit. There exists a sizeable amount of variation among local government regulations of local agriculture. Some are much more stringent on certain areas such as zoning or road use by large trucks or farm equipment. These issues indicate an educational effort toward public officials on the needs of modern agriculture would be a beneficial program.
This survey provided a detailed knowledge of Vermont’s dairy farms. The results indicated that average farm size has jumped to 115 cows per farm as compared to 40 cows per farm in 1970. Milk production has jumped to over 17,000 pounds of milk per cow. “However the median farm size is only 70 cows per farm, indicating a sizable presence of small farms.
Barn pipelines are the most common milking system while milking parlors are quite common on larger farms. Other common practices are the use of ATO, TMR, DHIA, and manure pits. Nearly 40% of the farms use computers for farm records. Only 11% use bST but these herds account for nearly 33% of the total milk production.
Farmers were most satisfied with dairy housing and milking facilities while being dissatisfied with time away from the farm and anxiety/stress level. Farmers were most concerned on milk price with other concerns raising the attention of the state’s farmers.
Cluster analysis was used to group the farmers according to concerns. The analysis identified 4 distinct groups. Cluster 1 was most concerned with estate planning and business transfers. Cluster 2 was more concerned with expansion issues and local regulations. Cluster 3 was less concerned with nearly all issues while the 4th cluster showed little concern for all categories, including milk price. Interesting, the 4th cluster had the smallest herd size and milk production while the largest herds were in Clusters 1 and 2.
The cluster analysis provided extension programers a focus for future education efforts. This permits UVM Extension to allocate education efforts toward producer needs and interests. Farmers identified estate planning, farm transfers, grazing management, and understanding of local regulations as key future programing areas.
The importance of this study is not just to do a survey but to get a more accurate picture of the state’s dairy industry, producer demographics, farm characteristics, technology uses, producer satisfaction, and farmer concerns. Cluster analysis will provide a key ingredient of analyzing the survey data and providing extension administrators a more informed basis for future programming needs.
Table 1. Characteristics of Vermont dairy farms and farmers. Dairy cows
Average 115.5 Median 70 Milk production per cow
Average 17,352 Average across herds 19,041 Acres
Average 352.2 Median 240
Cropland (average) 281.5 Permanent pasture (average) 63.7 Technologies
Milking parlor (%) 37.9 Barn pipeline (%) 53.2
Automatic take-offs (ATO) (%) 36.7 Feed TMR rations (%) 47.8
DHIA (%) 46.5
Bovine Somatotrophin (bST) (%) 11.1 Computer for farm records (%) 39.4 Manure storage pit (%) 67.2
Custom manure hauling (%) 35.5 Graze milking cows (%) 46.6
Move to new pasture 1 day or less (%) 43.4 Have non-family employees (%) 50.5
Farm Operator Characteristics Age (average years) 49.2
Age 45 or younger (%) 37.6 Age 56 or older (%) 26.6 Education level
Less than high school (%) 11.5 High school or less( %) 55.6 Post high school (%) 44.5
Farming less than 10 years (%) 20.9 No off-farm income (%) 37.8
Sole proprietorship 71.5
Debt/asset ratio greater than 50% (%) 16.3 Planning to discontinue dairy farming (%) 4.6
Table 2. Dairy farm operator satisfaction.
Percentage of responses
Satisfaction topic: Dissatisfied Neutral Satisfied Mean1
Milk facilities 13.2 32.6 54.2 3.63 Dairy housing 16.3 30.5 53.2 3.58 Labor performance 21.9 31.2 47.0 3.38 Financial progress 37.1 31.2 31.7 2.88 Labor availability 39.4 32.3 28.3 2.83 Anxiety/stress level 45.2 32.8 22.0 2.62 Profit level 51.4 26.5 22.1 2.51
Time away from the farm 52.6 26.6 20.8 2.48
1 The lower the mean score, the more greater dissatisfaction expressed by dairy farmers.
Table 3. Dairy farm operator future concerns.
Percentage of Responses
Concern topic Minimum Concern Neutral Most Concern Mean1
Milk pricing 6.8 11.7 81.5 4.35
Real estate taxes 17.0 20.5 62.5 3.76
Environmental regulations 16.0 22.6 61.3 3.74
Local government regulations 23.1 26.2 50.7 3.44
Labor availability 26.1 24.2 49.5 3.35
Costs for farm expansion 29.7 19.3 50.8 3.30
Estate planning/taxes 27.8 32.6 39.6 3.17
Transfer to next generation 42.8 22.7 34.5 2.84
Development pressures 41.3 25.1 33.7 2.87
Table 4. Cluster analysis results of dairy farm survey.
Concerns Cluster 1
Most Concerned
Cluster 2
Concerned Somewhat Cluster 3 Concerned
Cluster 4 Minimum Concerned
Total
Milk Price 4.63b,c 4.66d,e 4.37b,d,f 2.74c,e,f 4.33 Environment 4.43b,c 4.35d,e 3.18b,d,f 2.4c,e,f 3.73 Estate Plan 4.34a,b,c 2.85a,e 2.83b,f 1.8c,e,f 3.17 Transfer Farm 4.49a,b,c 2.09a,d,e 2.39b,d,f 1.55c,e,f 2.85 RE Taxes 4.53a,b,c 3.97a,d,e 3.47b,d,f 2.24c,e,f 3.77 Local Reg. 4.13a.b.c 4.44a,d,e 2.72b,d,f 1.99c,e,f 3.45 Development 3.48b,c 3.66d,e 2.28b,d,f 1.53c,e,f 2.87 Expan Costs 3.97b,c 4.15d,e 2.85b,d,f 1.4c,e,f 3.32 Labor Avail. 3.84b,c 3.97d,e 2.99b,d,f 1.88c,e,f 3.34
N 238 182 291 88 799
a Statistically significant difference between cluster 1 and 2 at the p < 0.05 level b Statistically significant difference between cluster 1 and 3 at the p < 0.05 level c Statistically significant difference between cluster 1 and 4 at the p < 0.05 level d Statistically significant difference between cluster 2 and 3 at the p < 0.05 level e Statistically significant difference between cluster 2 and 4 at the p < 0.05 level f Statistically significant difference between cluster 3 and 4 at the p < 0.05 level
Table 5. Characteristics of individual clusters.
Mean Cluster 1 Cluster 2 Cluster 3 Cluster 4 Total
Total Cows 131.39b,c 141.34d,e 98.33b,d 66.45c,e 114.46
Lbs/cow 17501.84c 18226.81e 17306.75f 15761.49e,e,f 17412.67
Total Acres 373.1b,c 381.96d,e 283.44b,d 205.74c,e 324.03
Operator Age
50.58a 47.38a 47.64b 50.05 48.72
N 238 182 291 88 799
a Statistically significant difference between cluster 1 and 2 at the p < 0.05 level b Statistically significant difference between cluster 1 and 3 at the p < 0.05 level c Statistically significant difference between cluster 1 and 4 at the p < 0.05 level d Statistically significant difference between cluster 2 and 3 at the p < 0.05 level e Statistically significant difference between cluster 2 and 4 at the p < 0.05 level f Statistically significant difference between cluster 3 and 4 at the p < 0.05 level
Table 6. Farm production practices by cluster.
Proportion Cluster 1 Cluster 2 Cluster 3 Cluster 4 Total Chi-square Sig. High School and below N=235 62.1% N=182 55.5% N=287 49.8% N=87 54% N=791 55.2% 0.047** Low debt 45.5% N=235 36.3% N=182 42.7% N=288 54% N=87 43.3% N=792 0.041** Graze cows 36.7% N=237 N=182 41.2% N=291 51.5% 63.6% N=88 N=798 46.1% 0.000*** Sole proprietorship 66% N=236 65% N=180 75.5% N=286 85.2% N=88 71.5% N=790 0.001*** Increase cows 46.2% N=238 N=182 41.8% N=291 38.1% N=88 25% N=799 39.9% 0.005*** ** Statistically significant difference among 4 clusters at the p < 0.05 level