Procedia - Social and Behavioral Sciences 227 ( 2016 ) 232 – 238
1877-0428 © 2016 Published by Elsevier Ltd. This is an open access article under the CC BY-NC-ND license (http://creativecommons.org/licenses/by-nc-nd/4.0/).
Peer-review under responsibility of the organizing committee of CITIES 2015 doi: 10.1016/j.sbspro.2016.06.066
ScienceDirect
CITIES 2015 International Conference, Intelligent Planning Towards Smart Cities, CITIES 2015,
3-4 November 2015, Surabaya, Indonesia
Spatio temporal analysis trend of land use and land cover change
against temperature based on remote sensing data in Malang City
Purwanto
a*,Dwiyono Hari Utomo
a, Bharadhian Rizki Kurniawan
aa
First affiliation, Address, City and Postcode, Country
b
Second affiliation, Address, City and Postcode, Country
Abstract
The purpose of this study is to assess the land use / land cover change (LULC) against Temperature Based on Remote Sensing Data in 2003-2013. This study uses a spatio temporal approach by using digital remote sensing data. The image data are used Landsat 7 ETM + and Landsat 8. Analysis of LULC change used supervised classification. The temperature data obtained by digital conversion number (DN). The results showed the spatial effect of LULC with the increase of temperature in Malang City. The LULC occurred on constructed land. The change are proven by the decrease of uncovered land and vegetation. The increase of temperature was proved by temperature data in 2013 were dominated by hot temperature class, while in 2003 was dominated by cold temperature class. The spatial distribution of hot temperature followed the pattern of main road including Part of City Region (PCR) Central Malang and Northeast Malang.
© 2016 The Authors. Published by Elsevier Ltd.
Peer-review under responsibility of the organizing committee of CITIES 2015.
Keywords:Spatio Temporal, Land use / land cover (LULC) change, temperature, remote sensing data.
* Corresponding author. Tel.: +6281216099950; fax: +62-0341-585966.
E-mail address: [email protected]
© 2016 Published by Elsevier Ltd. This is an open access article under the CC BY-NC-ND license (http://creativecommons.org/licenses/by-nc-nd/4.0/).
1. Introduction
The temperature increase trend is affected by natural and anthropogenic factors; especially CO2 which produced from human activities that cause greenhouse gas concentrations. Land use has a very important role in controlling the temperature change. Some studies show (Fall. Et al. 2009) that land use / land cover change (LULC) have a significant impact on change in air temperature in the urban areas.
According to Effendy (2007). increasing temperatures in urban areas causes the difference in surface temperature distribution between the suburbs with the area of green open space that is still quite extensive. The phenomenon of differences distribution temperature in urban with the suburban areas is commonly called "Pulau Panas" or "Heat Island". According to Wisnu. 2003 Heat island is a phenomenon of temperature in areas with high concentrations of the building is higher than the temperature of the surrounding open land. The temperature in an area also shows the quality of the air in the area. High tend temperatures contain greenhouse gases such as CO and CO2 with high concentrations that are harmful to human health. Hajji (in Fauzi. 2010: 40) said that generally for normal activities. The limits of the parameters as comfortable condition. The air temperature in range 200C - 260C and 45-60% relative humidity. The land use for the building can affect temperature in the area. This is because of each land cover material has a different ability to absorb and release heat. Temperature balancing can be done by increasing the area of green open space and increase the number of plants in the area.
Malang City as one of the cities in East Java is located at an elevation of 400-500 meters above sea level has a pressure point in the development of education, tourism, and industry. Based on research Hutabarat and Taufiq (2009) from 2005 to 2009 there was an increase in residential area of 14.19 Ha (10.63%). Besides. a small increase in trades and services area of 2,037 ha (1.53%) and public facilities covering an area of 0.824 ha (0.62%). While the green open space (GOS) is reduced 10.078 hectares from the beginning area 90.472 ha.
In recent years there has been increased temperature in Malang City. Based on research Utomo (2000) temperature differences on various land use in Malang City with daily average temperature of agricultural land is 23.83° C, settlement of 25.21° C and 26.77° C industrial land. This condition caused by the material of land use/land cover has a different of absorption and heat storage so it will influence the temperature around it. In 2010, Malang City have increased temperature recorded that the average of temperature ranges from 23 °C – 27 °C, with a maximum temperature of 33 °C, and the minimum temperature reaches 22°C. The same condition is also studied by Hamdani (2011), that during the year 2006 the average of temperature ranges between 22.2 °C - 24.5 °C, the maximum temperature reached 32.3 °C and a minimum temperature of 17.8 °C.
The utilization of remote sensing data allows to get spatial data in a relatively short and vast areas with quite high accuracy and low cost compared with the conventional way. Moreover, remote sensing also be multitemporal which means that the data in previous years can be easily obtained briefly in the form of images or aerial photographs. This allows analysis of land use/land cover change and temperature distribution pattern for a few years with more efficient. Based on these ideas, this research needs to be done with the aim of assessing land use/land cover change against Temperature Based on Remote Sensing Data in 2003-2013.
2. Methods
This is a survey research, which means that the study sought to collect large number of data at the same time. This study aimed to find out the effect of land use/land cover change against surface temperature in Malang City. Parameters of land use / land cover were used that constructed land, an open land and vegetation. To find out land use/land cover change using image data of Landsat 7 ETM+ in 2003 and Landsat 8 in 2013. The parameter of land use/land cover are using constructed land, open land. dan vegetation. While the classification of land use/land cover were using maximum likelihood classification method. Temperature data obtained by Digital Number (DN) value by using band 6 for Landsat ETM+ image and band 10 and 11 for Landsat 8 image. According to USGS (2003) conversion of image data into temperature data using two stages, i.e:
1) Conversion of Digital Number (DN) into Spectral Radiance (LȜ)
offset
+
DN)
(gain x
=
(L?)
Radiance
(1)Where :
x L
Ȝ = Spektral Radian in watt
x Gain is constant: 0.05518
x DN (Digital Number) from the value of image pixel
x Offset is constant 1.2378
2) Conversion of Spectral Radiance into temperature.
Spectral Radian on Landsat 7 thermal band (band 6) can be converted into temperature. Conversion equation
spectral radiant into temperature is:
T = (2)
Where:
x T = Temperature
x K1 = value of constant in watts 666.09 ETM+ and 607.76 for TM
x K2 = value of Kelvin constant 1282.71 for ETM+ and 1260.56 for TM
x L
Ȝ = Spektral Radian in watt.
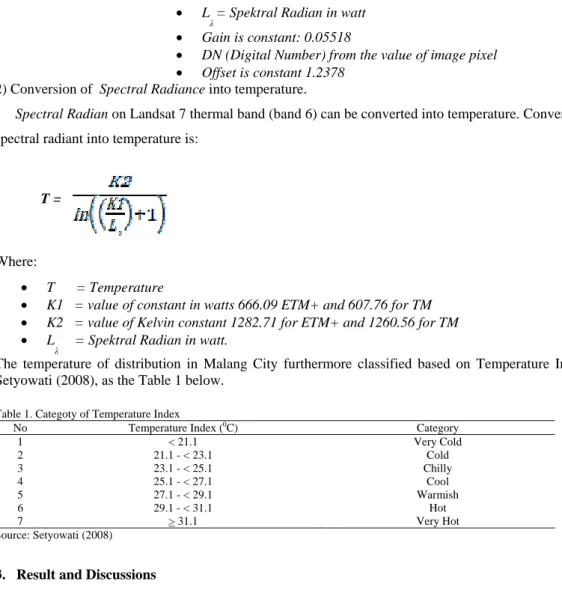
The temperature of distribution in Malang City furthermore classified based on Temperature Index according to Setyowati (2008), as the Table 1 below.
Table 1. Categoty of Temperature Index
No Temperature Index (0 C) Category 1 < 21.1 Very Cold 2 21.1 - < 23.1 Cold 3 23.1 - < 25.1 Chilly 4 25.1 - < 27.1 Cool 5 27.1 - < 29.1 Warmish 6 29.1 - < 31.1 Hot 7 > 31.1 Very Hot Source: Setyowati (2008)
3. Result and Discussions 3.1 land use/land cover change
From the interpretation of land use/land cover from Landsat 7 ETM+ in 2003 and Landsat 8 in 2013 obtained land change as the table 2 below.
Table 2. Land use/land cover change in 2003 and 2013 in Malang City
LULC 2003 2013 Changes
Area (Ha) Percentage (%) Area (Ha) Percentage (%) Area (Ha) Percentage (%)
Vegetation 6016.44 54.48 3924.97 35.54 -2091.47 -18.94
Open Land 800.37 7.25 265.76 2.41 -534.61 -4.84
Constructed
Land 4227.28 38.27 6853.36 62.05 +2626.08 +23.78
11044.09 100 11044.09 100
Based on Table 2, land use/land cover change in 2003-2013. These change are positive and negative. Land cover change that are positive occurred on land use/constructed land cover +23.78%, while the negative change that are occurred on open land -4% and vegetation -18.94%. It means that land use/land cover in Malang City have many changes into a constructed land is vegetation either rice field, urban forest, and mixed farms. The average
a b
each year there was an additional constructed land of 262.686 hectares or 10%.
This result in line with Basanna research, et.al, (2013) that there is a land change in his study that are positive and negative. That change are due to a various of pressure activities in the city, i.e, the development of infrastucture, open land, vegetation and wet land. Vegetation and open land are an aspect of land use/land cover which easy to conversion. Lubis, (2012) also claimed areas that often under pressure of LULC change in lowland areas with flat topograhy. The characteristic of LULC change in Malang City spatially depicted in a map as figure 1 below.
Fig. 1. Map of Land use/land cover change in Malang City a) in 2003 and b) 2013
Based on figure 1, the development trend of Malang City spatially from years 2003 to 2013 has developed to west and southeast. From these data it seems clear that many land changes into constructed land which are settlement of vegetation. Rapidly the growth of settlements is due to a lot of property investors of residential are developing their bussiness especially in countryside areas that relatively low cost and have cool air.
3.1 Temperature change change
The impact of LULC change in Malang City during the periode 2003-2013, also affect the increase of air temperature. From the analysis of Landsat ETM + and Landsat 8 satellite imagery has temperature changed. Quantitatively the wide of temperature change in Malang City over the period 2003-2013 can be viewed in Table 2 below.
Table 2. Data ofTemperature Land Change over the period 2003-2013 in Malang City
Temperature Class
2003 2013 Changes
Area (Ha) Percentage
(%) Area (Ha) Percentage (%) Area (Ha) Percentage (%) Very Hot ( 31.1) 0.18 0.002 1207.08 10.93 +1206.90 + 10.928 Hot (29.1 - < 31.1) 3.78 0.034 3114.41 28.2 +3110.63 + 28.166 Warmish (27.1 - < 29.1) 204.48 1.851 2547.42 23.066 +2342.94 + 21.215 Cool (25.1 - < 27.1) 3195.9 28.938 2036.22 18.437 -1159.68 - 10.501 Chilly (23.1 - < 25.1) 3143.7 28.465 1125.26 10.189 -2018.44 - 18.276 Cold (21.1 - < 23.1) 4323.63 39.149 790.35 7.156 -3533.28 - 31.993 Very Cold (< 21.1) 172.42 1.561 223.35 2.022 +50.93 + 0.461 11044.09 100 11044.09 100
(a) Landuse Map 2003
(b) Landuse Map 2013 U Admin.Bounderis Constructed Land Vegetation Open Land River LEGEND
b a
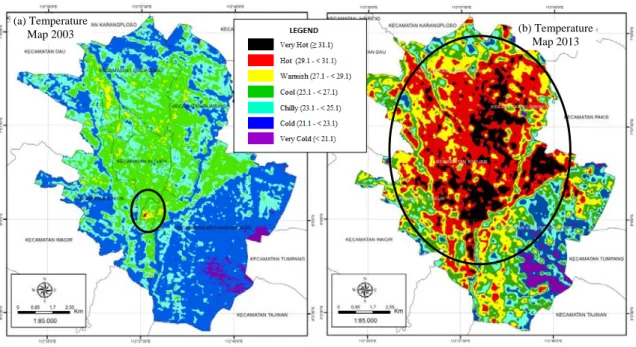
Based on Table 2 known that the most dominant temperature in 2003 was cold temperature that covered 39.1149% from Malang City or 4323.63 Ha. The hot and very hot temperature class in 2003 are the smallest area that covered 3.78% or 0.034% for hot temperature and 0.18% or 0.002% for very hot temperature. In 2013, the most dominant temperature class is hot temperature class which covered 3118.41 Ha or 28.2%. Temperature class has increased significantly is hot temperature class 3110.63 Ha or 28.116%, warmish 2342.92 Ha or 21.215%, and very hot temperature has increased 1206.9 Ha or 10.928%. while cool, chilly, cold, and very cold temperature tend to negative change. The biggest negative change in cold temperature -3533.28 Ha or -31.993%. Spatial trend of temperature change can be seen in figure 2 below.
Fig. 2. Map of Spatial Distribution of Temperature Change in Malang City a) 2003 and b) 2013
The interpretation of land use/land cover showed there is significant effect on land use/land cover change in Malang City 2003 and 2013. Horizontally temperature change increased in line with LULC change in West Malang and East Malang dominated by hot temperature change. The temperature increased from hot into very hot concentrated in the downtown which cover Part of City Region (PCR) Central Malang and Northeast Malang. Hot and very hot temperature in 2003 thrived with covered area is quite cramped that consentrated in Center Malang that is Sub-district Klojen. In 2013 hot and very hot temperature thrive to the North and Northeast. Area that experiencing the temperature change of hot and very hot temperature dominated by the land use of stores area, settlements, road and industrial area. This means that the area has a high pressure of human activity. While the air temperature chilly and cool was dominated by land use characteristics such as vegetation and urban forest and the mixed farms that is predominantly found in East and Southeast Malang. this is in line with research of Fall, Soulemane.et. al. 1996 from their research propound that temperature change besides affected by LULC change, on a micro scale also caused by human activities on land which may cause the greenhouse effect.
According to Bayong (2004), the building will slow down the movement of wind and reduce air movement horizontally. This will trigger some of gas pollutans concentrated close to the surface because of the dispersion of pollutant only depends on vertical air motion which in turn lead to warming close to the surface building. In addition, Miller (1986) in Irwan (2005) suggested that the concrete building and asphalt roads absorb heat during the day and release it slowly at night. This causes the heat that emanating from the solar radiation will be concentrated in areas with the land cover, causing the area with constructed land having a higher temperature than the areas with another land cover.
According to Tauhid (2008), the vegetation can cool down the environment actively by evaporation and
(b) Temperature Map 2013 (a) Temperature
transpiration (evapotranspiration) and passively protect the surface with shade underneath area which can reduce short-wave radiation from the sun.The results of ground checks show that the vegetation land cover, there is a difference temperature between the vegetation such as mixed farms, forests with rice fields. Mixed farms and forest vegetation have a lower temperatures than the rice fields. Trees have a better ability to evapotranspiration due to a tight canopy to protect the content of water vapor under the tree. This type of vegetation is quite good if compared with shrubs or grass (Lakitan, 2002). The tree has the characteristic of structure vegetation that effectively to reduce the temperature and increased humidity than the other vegetation. The higher and more extensive a vegetation canopy.
This condition is slightly different from the research of Mallick (2014)m who conducted the study of analysis LULC change in Alba City by using ASTER image data. From the result of the research revealed that LULC change affect the distribution of town temperature. However, the temperature distribution spatially also affected by topography. More higher place the air temperature decreases. This condition causes the proses of air transformation from high pressure to low pressure, which is from cold area to alower area. But it is not an absolute condition, and in the future need a better arrangement of vegetation.
4. Conclusions
Based on the result that have been obtained from this research can be concluded that land cover change affect the spatial pattern of temperature ditribution in Malang City. During the periode 2003 to 2013, there has been a vast reduction in vegetation land cover in large number of -2091.47 Ha and the addition of constructed land area 2626.08 Ha in Malang City. That changes tend to be followed by increase the area of three classes highest temperature that is very hot, hot and warmish temperature class. Therefore, to reduce the high temperature in the area especially in urban area, the presence of vegetation such as tree are realized into Green Open Space (GOS) or Urban Forest is indispensable. Decreasing the number of vegetation such as tree on an area and increase the number of constructed land area will affect the temperature condition in that region. The balance between the high of human activity in an area wit a large number of vegetation such as tree must be calculated properly. This is related with maximizing land use planning in Regional Spatial Plans (RSP) and monitoring function especially in Malang City that can be created an ideal temperature condition so that the Malang City remains a cool city and comfortable to live in.
Acknowledgements
This research was supported by the Research Group “Group areas of expertise”: Department of Geography fakulty social studies.
References
Basanna, Rita. et.al. 2013. Supervised Classification for LULC Change Analysis.
International Journal of Computer Applications (0975 – 8887) Volume 66– No.21. March 2013
Bayong. T. H. K. 2004. Klimatologi. Penerbit ITB. Bandung Bayong. T. H. K. 2004. Klimatologi. Penerbit ITB.
Bandung
Effendy. S. 2007. Keterkaitan Ruang Terbuka Hijau Dengan Urban Heat Island Wilayah Jabotabek. [Desertasi]. Bogor: Sekolah Pasca Sarjana.
Institut Pertanian Bogor
Hamdani. A. Faruq. 2011. Tingkat Kenyamanan Kawasan Permukiman Berdasarkan Kajian Iklim Mikro di Kecamatan Klojen Kota Malang.
Skripsi. Jurusan Geografi FIS Universitas Negeri Malang.
Hutabarat. F.H dan Taufik. M. Evaluasi Perencanaan Tata Guna Lahan Wilayah Perkotaan (Studi Kasus Kec.Lowokwaru. Kota Malang). Dari
Scrib. (Online). (http://www.scribd.com). diakses 24 Agustus 2013
Irwan. Z. D. 2005. Tantangan Lingkungan Dan Lansekap Hutan Kota. Penerbit Bumi Aksara. Jakarta
Lakitan. B. 2002. Dasar Dasar Klimatologi. PT Raja Grafindo Persada. Jakarta
Lubis, John Piter.G. et.al 2012. Land Use and Land Cover Change Detection
using Remote Sensing and Geographic Informations System in Bodri Watershed, Central Jawa, Indonesia. Journal of International Development
and Cooperation. Volume 18– No.01. 2011,pp.139-151
Mallick, Javed. 2014. Land Characterization Analysis of Surface Temperature of
Semi-Arid Mountainous City Abha. Saudi Arabia Using Remote Sensing and GIS. Journal of Geographic Information System. 2014. 6. 664-676.
Published Online December 2014 in SciRes. http://www.scirp.org/journal/jgis
Setyowati. Dewi Liesnoor. 2008. Iklim Mikro dan Kebutuhan RTH Kota Semarang. Semarang: Jurnal Manusia Dan Lingkungan. Vol 15. No 3.
trends over the continental United States: assessment using the North
American Regional Reanalysis. International Journal of Climatology.int. J. Climatol. (2009) Published online in Wiley InterScience.
(www.interscience.wiley.com) DOI: 10.1002/joc.1996
Tampubolon. T. Darmawan. Wikantika K. Lim H. dan Khiruddin A. 2008. Analisis Hubungan NDVI dan Temperatur Terhadap Tutupan Lahan
Dengan Data Landsat ETM. Universiti Sains Malaysia. Institute of Technology Bandung. Universitas Negeri Medan
Tauhid. 2008. Kajian Jarak Jangkau Efek Vegetasi Pohon Terhadap Temperatur Pada Siang Hari Di Perkotaan (Studi Kasus: Kawasan
Simpang Lima Kota Semarang). [Tesis]. Semarang: Sekolah Pasca Sarjana. Universitas Diponegoro.
Utomo. Dwiyono Hari. 2000. Cuaca Mikro di Kotamadya Malang (Kajian Discomfort Index dan Efective Temperature Berdasarkan Satuan