ABSTRACT
KULKARNI, CHAITANYA DEEPAK. Design and Development of a Smartphone-based Fall Detection and Alerts Generation System. (Under the direction of Dr. Douglas Reeves.)
Falls in people happen due to reasons like old age, dementia, Parkinson’s disease, learning
disabilities and poor motor control. Falls result in broken or fractured bones, cuts, abrasions,
soft tissue damage, and even death. They have psychological consequences, fear of falling
leads to isolation, worsening of mental health, and general degradation of quality of living.
If falls cannot be prevented, the next best option is detecting them accurately, and
summoning the required help immediately. An automatic fall detection system can do this;
however, to be usable, the system should not be prohibitively expensive, should be
convenient to carry on one's person, and should be capable of generating alerts even if the
user is rendered unconscious due to fall. Smartphones are thus uniquely positioned; they can
gather information about their surroundings using built-in sensors, process it in real-time, and
generate alerts in various forms.
In this thesis, we design and develop an Android application that monitors device sensors to
calculate device acceleration and orientation, and detects occurrence of fall using these inputs
and real-time pattern recognition techniques. We also describe sensor data collection,
including fall signature patterns, and alternative approaches tried for fall detection. On
The specifics of alerts to be generated and persons to be contacted are configured by user.
We use speech recognition to reduce false positives and improve fall detection accuracy. We
Design and Development of a Smartphone-based Fall Detection and Alerts Generation System
by
Chaitanya Deepak Kulkarni
A thesis submitted to the Graduate Faculty of North Carolina State University
in partial fulfillment of the requirements for the degree of
Master of Science
Computer Science
Raleigh, North Carolina
2011
APPROVED BY:
________________________ ________________________ Dr. Laurie Williams Dr. Robert St. Amant
______________________________ Dr. Douglas Reeves
ii
DEDICATION
iii
BIOGRAPHY
Chaitanya Kulkarni was born on March 17, 1984 in Maharashtra, India. He holds a
Bachelor’s degree in Computer Science and Engineering, awarded in 2005, by National
Institute of Technology, Calicut, India. He has been a Master’s student at North Carolina
State University, in Department of Computer Science, since August 2009. He has worked at
Cisco Systems as a summer intern, and will be joining them as a Software Engineer on
iv
ACKNOWLEDGMENTS
I thank my parents and my brother for their unwavering support and rock-steady faith in me.
I would not have made it without their constant encouragement and motivation.
I am deeply grateful to my adviser Dr. Douglas Reeves for knowing where my interests lay
and for orienting me in those directions. In addition to his many useful suggestions and
constant guidance, I cherish the trust he placed in me, and the freedom I was allowed during
the course of this work. I would like to thank Dr. Laurie Williams and Dr. St. Amant for
making their courses both fun and valuable, and for graciously agreeing to be in the thesis
committee. Special thanks are due to Dr. Thuente as well, for the support he extended in
difficult times.
I would like to thank my cousin Mr. Mohit Padalkar for his persistence in pushing me to do
more. He wants to see me succeed, and it is good to know that someone cares as much. I
would like to thank my cousin Mr. Prashant Joshi for being there for me when I needed him
the most. I will never forget his driving down to Raleigh to meet me in my initial days in
USA.
I would like to thank my friends for life - Arundhati, Pushkaraj, Abhishek, Neha, and
v Thanks are due to my roommates for two years, Vinay, Prasanna and Bharath Bhushan.
Thanks for making KP the place it is for us.
Thanks Deepshikha, Misha, Bharath Kaushik, Gopal, and Mario, for your support and for all
the help you have extended from time to time.
Thanks Vinay, Srikantha, and Sriprabha for everything - for your genuine interest in my
work, for being my test subjects, for helping me with the presentation, and for doing
everything possible to make my life easier, for such a long time. Thanks a lot. Thanks
Sriprabha, for your patient answers to my even most mundane questions throughout the
course of this work.
Lastly, thanks Smitha! My stint with Android began with you, and I will always remember
that project. Thanks for being the awesome friend you are; thanks for being there in my times
of need. Thanks for all your support, help, encouragement, and for caring so much.
I realize that this work would not have completed without all your contributions, and I am
vi
TABLE OF CONTENTS
LIST OF TABLES...viii
LIST OF FIGURES...ix
Chapter 1 Introduction ... 1
1.1 Falls – Reasons and Impact ... 1
1.2 Current Methods for Automatic Fall Detection ... 3
1.3 Our Solution ... 5
1.4 Thesis Structure ... 6
Chapter 2 Related Work... 7
2.1 Fall Detection Using Sensors ... 7
2.2 Activity Recognition Using Sensors ... 8
Chapter 3 Fall Detection Algorithm ... 11
3.1 Sensors ... 11
3.2 Sensor Data Collection ... 15
3.3 Weka Data Mining Suite ... 21
3.4 Multilayer Perceptron Neural Networks ... 21
3.4.1 Use of two classifiers:... 23
3.5 Algorithm and Implementation ... 23
3.6 Other Approaches ... 25
3.6.1 Threshold-based Fall Detection ... 25
3.6.2 Dynamic Programming based Approach ... 26
3.7 Challenges ... 28
vii
Chapter 4 Implementation and Alerts Generation ... 30
4.1 Why Android ... 30
4.2 Application Design Considerations ... 32
4.2.1 Background Monitoring ... 32
4.2.2 Designing for Responsiveness ... 33
4.3 Alerts ... 35
4.3.1 Settings for Alerts ... 35
4.3.2 User Feedback during Alerts Generation ... 39
4.3.3 Alerts Generation ... 40
Chapter 5 Experiments and Observations ... 44
5.1 Experiment Methodology and Results ... 44
5.2 Evaluation and Observations:... 47
5.3 Battery Consumption... 49
Chapter 6 Summary and Future Work ... 51
6.1 Future Work ... 52
References ... 54
Appendix...60
Appendix A Application for Data Collection ... 61
A.1 Why This Application ... 61
viii
LIST OF TABLES
Table 1 - Parameters for MLP Classifier ... 22
Table 2 - Results for ADL: Walking... 45
Table 3 - Results for ADL: Strolling ... 45
Table 4 - Results for ADL: Sitting ... 46
Table 5 - Results for ADL: Sleeping ... 46
Table 6 - Results for fall ... 47
Table 7 - Comparison of approaches ... 47
Table 8 - Battery power consumption of applications - 1 ... 49
ix
LIST OF FIGURES
Figure 1 - SensorEvent API coordinate system ... 12
Figure 2 - Reference coordinate system for device orientation ... 14
Figure 3 - Acceleration signal - fall pattern ... 17
Figure 4 - Pitch signal - fall pattern ... 17
Figure 5 - Acceleration pattern during walking ... 18
Figure 6 - Acceleration Pattern during strolling ... 18
Figure 7 - Acceleration pattern during sitting ... 19
Figure 8 - Acceleration pattern during sleeping ... 19
Figure 9 - Pitch pattern during walking ... 19
Figure 10 - Pitch pattern during strolling ... 20
Figure 11 - Pitch pattern during sitting ... 20
Figure 12 - Pitch pattern during sleeping ... 20
Figure 13 - Dynamic Time Warping [20] ... 27
Figure 14 - Raw acceleration and orientation data during an ADL ... 29
Figure 15 - Android Application Not Responding (ANR) dialog ... 34
Figure 16 - Settings ... 36
Figure 17 - Waiting duration... 36
Figure 18 - Audio alert settings ... 37
Figure 19 - Text and email alerts ... 38
Figure 20 - Calls settings ... 38
Figure 21 - Alerts generation countdown ... 40
Figure 22 - A received email alert ... 43
1
Chapter 1
Introduction
In this thesis, we address the problem of falls in people. Our approach relies on smartphones
to detect falls and summon the appropriate assistance. We develop an Android application
that monitors the phone’s built-in sensors, detects falls using pattern recognition, and
generates pre-configured alerts on fall detection. We test the application against a number of
Activities of Daily Life (ADLs) and fall events, and present the results.
1.1 Falls – Reasons and Impact
Falls are defined as ‘an unexpected event in which the participant comes to rest on the
ground, floor, or lower level.’ [1] A slip (sliding of the support leg) and a trip (impact of the
swinging leg with an external object or a body part) both represent loss of bodily balance,
and both can cause a fall [2].
A variety of reasons like old age, dementia, Parkinson’s disease, learning disabilities and
poor motor control contribute to falls in people. Falls represent a serious problem among the
elderly. One out of three adults age 65 and older falls each year. Falls are the leading cause of
2 broken or fractured bones, cuts and abrasions, and soft tissue damage, and hospital
admissions. [3] [4] Falls can also result in ‘long-lie’, which is defined as remaining on the
ground for an hour or more following a fall. This occurs in more than 20% of the elderly
people who are admitted to hospital due to fall. Even if no direct fall-related injury has
occurred, half of the elderly people who experience a long-lie die within 6 months of the fall
[4]. Additionally, falls in elderly also have psychological consequences. The fear of falling or
long-lie can lead to the worsening of one’s mental health, isolation, and the general
degradation of quality of living [5]. Fall researchers also describe a ‘fear of falling’ cycle in
which, after a fall, seniors may limit their daily activities due to fear of falling again, leading
to decrease in fitness, mobility and balance, decreased social interactions, reduced
satisfaction and increased depression. This fear may increase the risk of another fall [6].
Falls also occur because of dementia. Studies show an annual fall incidence as high as 60%
among people with dementia, and as many as 400 falls per 100 persons with dementia. In a
misguided attempt to prevent injury, physical restraints are used for such patients [7].
Most patients suffering from Parkinson’s disease (PD) sustain recurrent falls. Researchers
have observed that almost 70% of patients fell during a 1-year follow-up. Recurrent falls
occurred in approximately 50% of patients during 1 year. Compared to healthy subjects, the
relative risk of sustaining recurrent falls during a 6-month period was 9.0 (95% confidence
3 For people with learning disabilities, falling is a common cause of physical injury and
impaired quality of life. Studies have shown that over a 33-month period, more than half of
people with a learning disability who live in residential facilities will have a fall, with a third
of these falls resulting in injury. A recent Scottish study found that 41% of community-based
adults with a learning disability had experienced a fall in the previous 12 months. For the
people involved, falls result in institutionalization, increased incidence of injury, higher
healthcare costs, heightened fear of falls and reduced physical activity [9].
Falls are thus a clinically frequent case, can be caused by a variety of reasons, and adversely
affect a sizable population.
1.2 Current Methods for Automatic Fall Detection
Falls can be prevented from happening through personal care and constant monitoring. A
person who has sustained a fall can be helped by others in the vicinity. However, for falls
that occur in isolation, quick and accurate detection of fall and summoning the much-needed
help becomes important. Automated fall detection systems or Personal Emergency Response
Systems (PERS) are used for this purpose. Such systems attempt to reduce the period
between the fall and arrival of medical attention by generating alerts on detecting a fall.
However, most common form of PERS, a push-button pendant for alerts generation, is not
always a useful method, as the pendant will not be activated if the fall renders the person
4 Automated fall detecting systems commonly use one of following three methods for
classifying a fall: [5]
Acoustic/vibration recognition: This is achieved by having a device, usually implanted in the floor, monitor sound and other vibrations. It listens for the vibratory
signature of a human fall, which is vastly different from the signatures of walking,
small objects falling, and other common activities.
Image recognition: By using overhead cameras in a fixed location, one can track objects and learn movement patterns. The system adapts to the locations in which a
single human enters/exits the room and remains inactive (lying/sitting on bed/chair).
Common paths from entry points to inactive areas are then traced and remembered. It
suspects a fall if a person becomes inactive in the middle of a common path.
Worn Devices: These systems require the user to wear external sensors. The devices track the vector forces exerted on the user. Usually these devices are a tri-axial
accelerometer or gyroscope. If a specific pattern or threshold is broken, the device
alerts a wireless receiver, which then alerts emergency contacts.
Majority of fall detection systems require some application specific hardware and software
design. This increases their cost and limits the commercial viability to the wealthiest, or most
impaired, users. Many also have significant installation and/or training times, also limiting
greater adoption [5]. Systems employing overhead cameras are hardly effective once the
5 users if they are inconvenient and affect mobility/activities of daily life.
1.3 Our Solution
We thus propose using smartphones as fall detection and warning system. Today’s
smartphones include sensors like Accelerometer, Gyroscope, Magnetic Field sensor,
Light/Proximity Sensor to collect information from their environment. They have processing
power required for real-time analysis of collected data to detect a fall, and they can also
generate various forms of alerts like a loud ring, text, email etc., on detecting a fall [11] [12].
They provide access to this functionality via developer API. Moreover, as a phone is carried
on one’s person, there is no need for dedicated sensor hardware, and the fall monitoring is
not dependent on presence of external overhead cameras.
In this thesis, we develop an application on Android platform that runs in the background and
monitors for fall. On detecting a fall, it generates alerts. The specifics of alerts generated are
configured by the user, as are the persons to be contacted. For detecting the fall, the app uses
6
1.4 Thesis Structure
Remainder of this thesis is organized as follows. Chapter 2 presents an overview of the
related work, discussing existing fall-detection algorithms, use of worn sensors, and an
existing Android application. Chapter 3 presents the design and implementation of our fall
detection algorithm, including a discussion of different approaches explored and challenges
faced. Chapter 4 presents the details about implementation and alerts generation. Chapter 5
discusses the experiments performed for validating the app and presents the results. Finally,
7
Chapter 2
Related Work
2.1 Fall Detection Using Sensors
Fall detection using sensors is a well-researched area. The algorithms generally use inputs
from one or more sensors, and are threshold-based – a fall is concluded to have happened if
the thresholds are crossed. The actual thresholds differ based on the specific sensors used,
and the experimental results obtained.
Bourke et al. [4] use a tri-axial accelerometer housed in a plastic case, mounted on thigh and
trunk using harnesses, and conduct experiments using young subjects for performing falls
and elder subjects for Activities of Daily Life (ADLs). Using the experimental data, they
determine upper and lower thresholds for accelerometer data for detecting fall. They also
recommend trunk as the ideal position for the sensor. Hwang et al. [13] develop a
chest-attached fall detection system. They use accelerometer for determining kinetic force,
gyroscope for determining posture transition and a tilt sensor to determine whether people
are standing or are supine. They use buffered windows of sensor data, with readings in each
window averaged out. Due to the use of multiple signals, they increase the accuracy of
8 sensor communicating with a camera-phone over Bluetooth. The phone tries to ascertain
whether the user has indeed fallen, and generates alerts if that is the case. In [6], changes in
acceleration magnitude, followed by orientation and position change; are used as fall
indicators. In [15], Li et al. distinguish between intentional transitions (such as sitting or
lying down) and unintentional transitions (such as falling) – unintentional transitions involve
sudden changes in the sensor readings. Finally, Sposaro and Tyson [5] develop an Android
application that uses a threshold-based algorithm for fall detection, using accelerometer data
and orientation change. They provide a ‘sensitivity setting’ to reduce number of false
positives. Their alerts generation system consists of two-way communication between the
person who has sustained the fall, and his/her social contact. This method also reduces the
impact of false positives.
2.2 Activity Recognition Using Sensors
Sensor inputs are also used for activity recognition. Various machine-learning methods are
usually employed for this purpose.
Yang [16] describes use of Clustering mechanisms from Weka data mining suite for physical
motion recognition using accelerometer sensors in mobile phones. Kwapisz et al. [17] use
decision trees (J48), logistic regression and multilayer neural networks from Weka data
mining suite for inducing models for predicting user activities. Sun et al. [18] develop a SVM
9 specifying six pocket positions for the phone. Brezmes et al. [19] use K-nearest neighbors for
pattern recognition.
Finally, dynamic programming based methods are also used for pattern recognition. Liu et.
al. [20] describe use of Dynamic Time Warping (DTW) for gesture recognition. Dynamic
Time Warping is a method for calculating matching cost for temporally differing patterns
using dynamic programming. [20] uses Euclidean distance as the distance calculation
function for DTW.
Threshold-based algorithms cannot generalize to varied use cases of sensors in mobile
phones, neither can they learn from or adapt to user behavior. Dynamic programming based
algorithms cannot effectively distinguish between patterns involving extended periods of no
activity – a fall that renders the person unconscious versus sleeping, for example.
In this thesis, we develop smartphone-based fall detection and warning system that uses a
supervised learning method for pattern recognition. By re-training the classifier using
user-identified true and false positives, recognition accuracy of our method improves over time,
for the specific user. Moreover, utilizing the capabilities of the smartphone, we can perform
effective alert generation – asking user whether he/she is okay, ringing a bell, and sending
emails/text messages to pre-selected contacts. Our method does not need special-purpose
10 for the user. However, as our method is phone-based, it does not detect falls suffered by users
11
Chapter 3
Fall Detection Algorithm
In this chapter, we describe our fall detection algorithm, preceded by a discussion of sensors
inputs utilized, sensor data collected, and the classifier used. We also discuss the challenges
in algorithm design and alternative approaches tried.
For detecting a fall event, the application monitors the Accelerometer and Magnetic field
sensors in background. A Multilayer Perceptron Classifier is trained on a sample dataset
consisting of both fall and non-fall events, and then used for real-time classification of sensor
data. Multiple, overlapping, sliding windows over the stream of sensor data are utilized to
provide instances for this real-time classification. A fall event is characterized by detection of
changes similar to fall patterns in both acceleration and orientation occurring within a short
interval.
3.1 Sensors
Android API exposes the device sensors through a class called SensorManager. As we need
to track acceleration and orientation changes, we register with SensorManager to listen for
accelerometer and magnetic field sensors. Upon change in sensor values, an object of class
12 information like sensor type, sensor’s data, event timestamp, and accuracy. Following
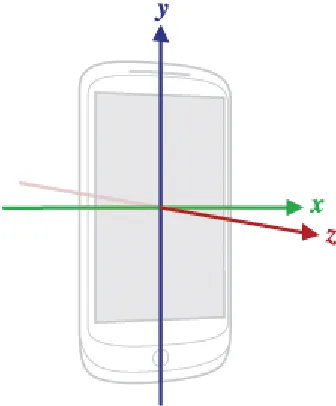
diagram depicts the coordinate system used by the SensorEvent API [32].
Figure 1 - SensorEvent API coordinate system
The coordinate system is defined relative to the screen of the phone in its default orientation.
The axes are not swapped when the device's screen orientation changes. As shown in the
diagram above, X axis is horizontal and points to the right, the Y axis is vertical and points
up and the Z axis points towards the outside of the front face of the screen.
An application subscribing to sensor events is also supposed to unregister the listeners when
it no more requires the sensor monitoring. This is required to prevent the unnecessary battery
drain. Likewise, in our application, we stop listening to sensor events when the user stops the
13
Acceleration:
The SensorEvent object received in the sensor listener contains an array of sensor values.
The length and the contents of this array depend on the type of sensor. For accelerometer,
following values are returned (unit: m/s2): [32]
[0]: acceleration minus Gx on x-axis
[1]: acceleration minus Gy on y-axis
[2]: acceleration minus Gz on z-axis
Accelerometer sensor measures the acceleration applied to the device. The force of gravity is
always influencing the measured acceleration. Thus, for instance, for a device stationary on a
table, accelerometer reads a magnitude of g = 9.81 m/s2. Similarly, when the device is in
free-fall and therefore dangerously accelerating towards to ground at 9.81 m/s2, its
accelerometer reads a magnitude of 0 m/s2.
In our application, we first record the accelerometer sensor values for subsequent use in the
calculation of device orientation. We then find out the acceleration applied to the device by
squaring and adding the acceleration along the three axes, and taking the square root of the
result. We then quantize the result using a non-linear quantization scheme described by Liu
14
Orientation:
Device orientation is calculated using the values obtained by accelerometer as well as
magnetic field sensor. Just as we record the values obtained by accelerometer, we record the
values obtained by magnetic sensor as well, in the sensor event listener. Using these two sets
of the values and the methods provided by the Android API, we first calculate a rotation
matrix transforming a vector in device coordinate system into world coordinate system. We
then calculate the device orientation from this rotation matrix. The reference coordinate
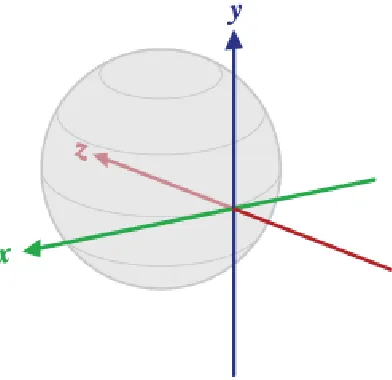
system used for device orientation is depicted below: [33]
Figure 2 - Reference coordinate system for device orientation
In the reference coordinate system
15 current location and roughly points in the West direction).
Y is tangential to the ground at the device's current location and points towards the
magnetic North Pole.
Z points towards the center of the Earth and is perpendicular to the ground.
All three angles above are in radians and positive in the counter-clockwise direction.
These are the values obtained for device orientation: [33]
[0]: azimuth, rotation around the Z axis
[1]: pitch, rotation around the X axis
[2]: roll, rotation around the Y axis
During a fall, user position changes from standing to supine, in a sudden manner. This
change produces a variation in pitch. In our application, the pitch values form the dataset that
is used for real-time classification.
3.2 Sensor Data Collection
We created an application for sensor data collection. This application monitors the sensors in
background using a service, and writes the sensor data to files on phone’s external storage.
This data can then be uploaded to a server from the application. We used Comma-Separated
16 graphs. More details about this application are given in Appendix A.
We conducted a number of experiments involving falls. A fall involves transition from a
standing position to a supine one. We empirically observed the time taken and the number of
sensor data values generated for the stationary->fall->stationary transitions. We also
considered the fact that both acceleration and pitch variations need to be tracked. Using these
observations, we arrived at a length of 40 values for a data instance used for both training the
classifiers and for real-time classification. These values are typically collected over a period
of 6 seconds. The data instance length ‘spans over’ a fall transition. During our experiments,
we observed that longer instance lengths contain additional sensor data, and adversely affect
recognition accuracy.
Fall events produce similar patterns in the sensor data. Acceleration exhibits a sudden change
on fall - it has the pattern of a downward spike followed by an upward one. Pitch also
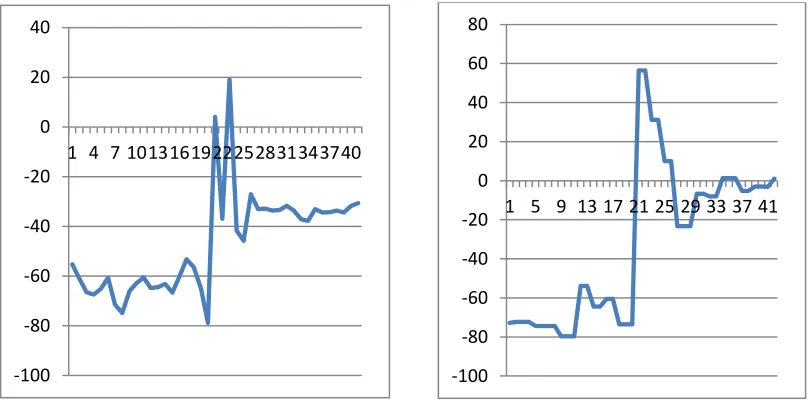
17 Following figure shows the acceleration signal pattern during fall:
Figure 3 - Acceleration signal - fall pattern
Following figure shows the pitch signal pattern during fall:
Figure 4 - Pitch signal - fall pattern
0 2 4 6 8 10 12 14
1 4 7 10 13 16 19 22 2528 31 34 37 40
0 2 4 6 8 10 12 14 16
1 5 9 13 17 21 25 29 33 37 41
-100 -80 -60 -40 -20 0 20 40
1 4 7 1013161922252831343740
-100 -80 -60 -40 -20 0 20 40 60 80
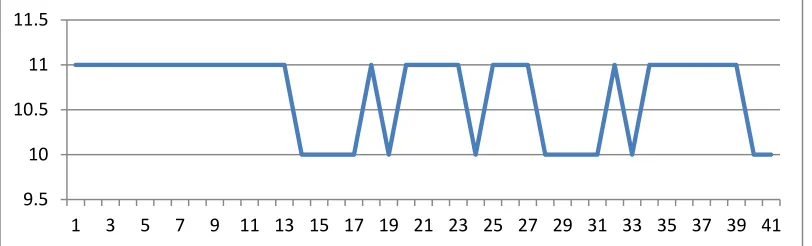
18 We also collected the sensor data for a number of Activities of Daily Life (ADLs), like
walking, sitting, sleeping, and being stationary or strolling. The ADLs are performed from a
starting point of the person standing, with the phone in the front pocket of the trousers. We
selected this particular position, as it is a common one. [18]
Following figures show patterns in acceleration during these ADLs:
Walking:
Figure 5 - Acceleration pattern during walking
Stationary to Strolling:
Figure 6 - Acceleration Pattern during strolling
0 2 4 6 8 10 12 14
1 3 5 7 9 11 13 15 17 19 21 23 25 27 29 31 33 35 37 39 41
9.5 10 10.5 11 11.5
19 Sitting:
Figure 7 - Acceleration pattern during sitting
Sleeping:
Figure 8 - Acceleration pattern during sleeping
Following figures show patterns in pitch during the ADLs:
Walking:
Figure 9 - Pitch pattern during walking
9.5 10 10.5 11 11.5
1 3 5 7 9 11 13 15 17 19 21 23 25 27 29 31 33 35 37 39 41
0 5 10 15
1 3 5 7 9 11 13 15 17 19 21 23 25 27 29 31 33 35 37 39 41
-100 -80 -60 -40 -20 0
20 Stationary to Strolling:
Figure 10 - Pitch pattern during strolling
Sitting:
Figure 11 - Pitch pattern during sitting
Sleeping:
Figure 12 - Pitch pattern during sleeping
-100 -80 -60 -40 -20 0
1 3 5 7 9 11 13 15 17 19 21 23 25 27 29 31 33 35 37 39 41
-100 -50 0 50
1 3 5 7 9 11 13 15 17 19 21 23 25 27 29 31 33 35 37 39 41
-100 -50 0 50
21
3.3 Weka Data Mining Suite
Waikato Environment for Knowledge Analysis (Weka) is a machine learning software suite in Java, developed at the University of Waikato, New Zealand. Weka is open source, and is
available under the GNU General Public License. The machine learning algorithms in Weka
can either be applied directly to a dataset or called from Java code. Weka contains tools for
data pre-processing, classification, regression, clustering, association rules, and visualization
[34].
In our application, we use Weka Multilayer Perceptron classifier for real-time classification
of sensor data. Weka is chosen because of its free availability, java implementation,
portability to Android platform, and finally, ability of performing Classification from Java
code.
3.4 Multilayer Perceptron Neural Networks
An Artificial Neural Network (ANN) is an information-processing paradigm that is inspired
by the way biological nervous systems process information. An ANN consists of a large
number of highly interconnected simple processing elements (neurons) working in unison to
solve specific problems. An ANN is configured for a specific application, such as pattern
recognition or data classification, through a learning process. Once trained, it can be used to
provide projections for given new situations. Adaptive learning, self-organization, and real-
22 A Multilayer Perceptron (MLP) is a feed forward artificial neural network. It has a layered
architecture consisting of input, hidden, and output layers. Each layer consists of a number of
perceptrons. The output of each layer is transmitted to the input of nodes in next layer
through weighted links. Training or weight adaptation is done using supervised
backpropagation learning [35].
Weka uses sigmoid activation function for its Multilayer Perceptron classifier [36].
In our application, we use a network with one hidden layer, one input layer, and one output
layer. Following table presents the parameters and their default values for Weka MLP
classifier configuration. We use the same values in our application.
Table 1 - Parameters for MLP Classifier
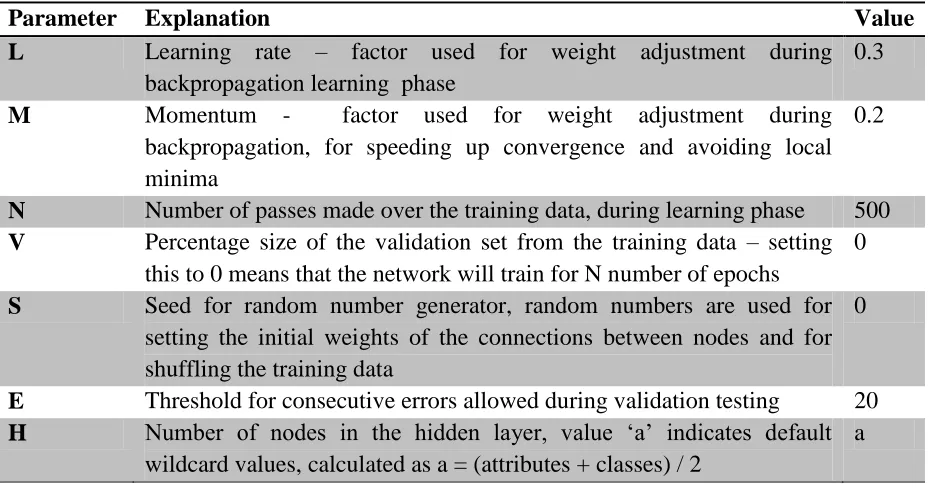
Parameter Explanation Value
L Learning rate – factor used for weight adjustment during backpropagation learning phase
0.3
M Momentum - factor used for weight adjustment during backpropagation, for speeding up convergence and avoiding local minima
0.2
N Number of passes made over the training data, during learning phase 500
V Percentage size of the validation set from the training data – setting this to 0 means that the network will train for N number of epochs
0
S Seed for random number generator, random numbers are used for setting the initial weights of the connections between nodes and for shuffling the training data
0
E Threshold for consecutive errors allowed during validation testing 20
H Number of nodes in the hidden layer, value ‘a’ indicates default
wildcard values, calculated as a = (attributes + classes) / 2
23 The training set for the classifier consists of both fall and non-fall samples. Fall samples all
exhibit similar patterns, while the non-fall samples are selected from sensor data collected
during ADLs. They exhibit patterns markedly different from the fall patterns. As there are
virtually unlimited ADL patterns and our aim is fall detection, our training set contains more
fall patterns than non-fall patterns; it is trained to recognize the presence of a pattern similar
to fall pattern in the sensor output.
3.4.1 Use of two classifiers:
Our experiments showed that fall involves change in both acceleration and in pitch. More
important, changes similar to fall pattern occur in acceleration when one is walking/running
but pitch changes are absent at this time, and changes similar to fall pattern occur in pitch
when one sits or lies down but changes in acceleration are absent at this time. This mutual
exclusivity of the two indicators and the fact that they both are present in a fall leads to our
choice of monitoring them both.
3.5 Algorithm and Implementation
User starts fall monitoring by pressing a button from within the application. On this user
trigger, we start a Service for background sensor monitoring and real-time fall detection.
24 acceleration and pitch signals using pre-stored training data. As this is likely to be a blocking
operation, it is done in a separate thread, thus keeping the application responsive.
Once the classifiers are built, we start the fall detection thread, and start sensor monitoring.
In the sensor event listener, we calculate acceleration using sensor values, quantize the
results, and build data instances, each of length 40. The choice of this window length is
explained earlier, in section 3.2. We use four overlapping, sliding windows over the sensor
data stream. Multiple overlapping windows are required to capture the sensor data patterns
accurately; a fall pattern should not be incorrectly identified because it did not begin at the
start of the window. Similarly, we calculate pitch and build data instances, each of length 40,
with four overlapping, sliding windows over data stream. For both acceleration and pitch,
once an instance is created, we classify it using the corresponding classifier, and signal the
fall detection thread if the result of classification is ‘fall’.
In the fall detection thread, we keep track of the timestamps of the acceleration and pitch fall
indication messages. If both the classifiers report the occurrence of a fall pattern in 3.5
seconds (value slightly higher than instance duration/2) of each other, we conclude that a fall
25
3.6 Other Approaches
In addition to real-time classification of sensor data using a Multilayer Perceptron classifier,
we also explored following approaches for the design of fall detection algorithm.
3.6.1 Threshold-based Fall Detection
This approach endeavors to detect the occurrence of fall by monitoring whether the values
output by sensors cross certain thresholds.
During our experiments involving falls, we observed that a fall produces a downward spike
followed by an upward one in the acceleration pattern. During a fall, acceleration typically
falls below 6 m/s2, and then goes above 12 m/s2, before stabilizing around 10 m/s2. Higher-
impact falls produce variations that are more pronounced; we observed acceleration going
below 2 m/s2 during some falls. Orientation exhibits high-magnitude change, mirroring the
change in position from standing to supine. We observed changes in pitch signal by more
than 75 degrees. We decided our thresholds for fall detection based on these observations. A
fall was characterized as ‘acceleration falling below 6 m/s2
and then going above 12 m/s2,
and pitch changing by more than 75 degrees.’ For fall detection, we monitored both
acceleration and pitch value streams, starting ‘observation windows’ on crossing the
thresholds. For example, we monitored for acceleration crossing the upper threshold of 12
26 However, this approach leads to a large number of false positives due to the noise in sensor
output. We observed that acceleration thresholds are routinely crossed during activities like
walking, and sitting down or sleeping involves position changes that produce variations of
more than 75 degrees in pitch. Additionally, noise leads to out-of-pattern values in the sensor
output, which negatively affect conclusions by a threshold-based algorithm.
As a further improvement, we eliminated effect of out-of-pattern values by tolerating a
certain number of them in the algorithm. For example, we would conclude that the position
has changed only if ‘x’ consecutive values show the change, allowing for ‘y’ out-of-pattern
values, where y << x. We observed occurrence of false positives even with this change.
3.6.2 Dynamic Programming based Approach
Liu et. al. [20] employ Dynamic Time Warping (DTW) for gesture recognition using
accelerometer data. Dynamic Time Warping is a classical algorithm based on dynamic
programming to match two time series with temporal dynamics, given the function for
27
Figure 13 - Dynamic Time Warping [20]
Let S[1…M] and T[1…N] denote the two time series. As shown in the figure above, any
matching between S and T with time warping can be represented as a monotonic path from
the starting point (1, 1) to the endpoint (M, N) on the M by N grid. A point along the path,
say (i, j), indicates that S[i] is matched with T[j]. The matching cost at this point is calculated
as the distance between S[i] and T[j]. The path must be monotonic because the matching can
only move forward. The similarity between S and T is evaluated by the minimum
accumulative distance of all possible paths, or matching cost. DTW employs dynamic
programming to calculate the matching cost and find the corresponding optimal path [20].
In our approach, using dynamic programming for fall detection involved finding similarity
between a real-time sensor data pattern and existing fall templates using DTW. A fall is
identified by matching cost < threshold. The threshold value was chosen by calculating the
28 For distance calculation in DTW implementation, we tried Euclidean distance and
Levenshtein distance. We also tried the Dynamic Programming based algorithm for speech
recognition described by Sakoe and Chiba [38].
We observed that this approach produced very good results for distinction between activities
like sitting and walking, and for distinction between fall and walking. However, as a fall
pattern involves values corresponding to user being stationary after fall, any sensor data
pattern containing values corresponding to user being stationary – for example, sitting or
sleeping - would have a low matching cost with fall patterns. This led to a number of false
positives in fall detection. Additionally, both the approaches made no provisions for using
user feedback about fall classification for improving fall detection accuracy.
3.7 Challenges
3.7.1 Noise in Sensor Data
Output from sensors in smartphones is contains considerable amount of noise, with even
simple motions producing pronounced variations in the output. Following figure shows an
example. The patterns depict changes in raw acceleration and orientation signals for the
29
Figure 14 - Raw acceleration and orientation data during an ADL
For an application relying on sensor data, sensor noise forms a source of false positives and
similar erroneous conclusions. Following techniques are commonly employed for
smoothening out the sensor output:
filtering techniques like low-pass filters, high-pass filters, and Kalman filters
buffering the sensor values and averaging them over window size
using lower and upper thresholds for sensor data based on empirical observations
In our application, both quantization and Multilayer Perceptron based pattern matching help
30
Chapter 4
Implementation and Alerts Generation
The Android application we have developed is comprised of two major parts - fall detection,
and alerts generation. This chapter starts with a discussion of our choice of platform,
followed by some application and platform-specific design considerations. We then discuss
our Alerts mechanism, describing the application settings for alerts generation, various alerts,
and their generation.
4.1 Why Android
Android is a software stack for mobile devices that includes an operating system, middleware
and key applications [21]. The operating system is based on Linux kernel. Android started as
an independent company, which was purchased by Google in 2005 [22]. T-Mobile G1, the
first phone powered by Android, was released in 2008 [23]. As of mid-2011, Android powers
over 310 devices, in 112 countries. Over 100 million Android devices are activated
worldwide, with more than 500, 000 new devices activated every day [24] [25]. In USA,
Android is the mobile platform with highest market share (May 2011) [26].
There are over 200,000 Android applications, and 450,000 developers [24]. Android
application development is done in Java. Every Android application runs in its own process,
31 with its own instance of the Dalvik virtual machine [27]. The executable application can be
deployed using a multitude of ways – via Google’s Android Market, via third-party
distribution websites, and even via email. Applications put on the Android Market do not
need to go through an approval process, and thus avoid the delay in distribution [28].
In summary, Android platform is selected for this work because,
It has a widespread and ever-widening reach in the consumer market.
A thriving developer community surrounds the platform. The collective community
knowledge provides valuable help throughout the application development.
The application development API is Java-based, and it provides access to varied
functionalities, satisfying the needs of this work. For example, the API allows us to
constantly monitor device sensors in the background, track location, obtain user
address, send emails and text messages, and place voice calls.
Hardware and Software Used
For primary application development and testing, we used a Google Nexus S device, running
Android software version 2.3.4, a.k.a. ‘Gingerbread’. We used Eclipse IDE with ADT plugin
running on a Microsoft Windows 7 machine for development. We also used a Motorola
Droid, running Android software version 2.2.2 a.k.a. ‘Froyo’, for additional compatibility
testing. Both the devices have accelerometer and magnetic sensors; the data collected from
32
4.2 Application Design Considerations
4.2.1 Background Monitoring
In our approach, detection of fall requires real-time classification of data from accelerometer
and magnetic field sensors. As the occurrence of fall is an unpredictable event, sensor
monitoring and classification of data needs to go on continuously - even when the user is not
interacting with the app, and even when the phone is locked and its screen is off. We thus use
a ‘Service’ for sensor monitoring, real-time classification of data, and identification of a fall
event.
Android platform makes a distinction between Activity and Service. An activity is an
application component, which is described as a single, focused thing that the user can do, and
almost all activities interact with the user [29]. An activity thus has a user-visible part – a
screen with witch the user interacts. An activity is considered active if it is in the foreground
of the screen. An Activity is paused when it loses focus, and it is stopped when another
Activity completely obscures it. When an Activity transitions to the paused or stopped state,
the process hosting the Activity can be killed by the system at any time depending on
memory requirements. Thus, if the fall detection algorithm is implemented as an activity, it
cannot be guaranteed to run when the user is not directly interacting with the application.
A Service, on the other hand, is an application component representing an application's desire
33 facility, an application tells the system about something it wants to be doing in the
background, i.e., even when the user is not directly interacting with the application. As a
response to the startService() API call, the system schedules work for the Service, to be run
until the Service or someone else explicitly stops it. Moreover, by requesting appropriate
permissions from the system, a Service can be made to run even when the phone is locked
and the screen is switched off. Thus, it is appropriate to implement the sensor monitoring,
real-time classification and fall-detection as a Service.
On detecting a fall, we create an Activity from the Service, giving the user a chance to
interact with the application.
4.2.2 Designing for Responsiveness
On the Android platform, the application has to be designed to be responsive. An application
that is not responsive feels sluggish, hangs or freezes for significant periods, or takes too long
to process input [31]. The system guards against such applications by displaying a dialog to
the user, called the Application Not Responding (ANR) dialog. An example of this dialog is
34
Figure 15 - Android Application Not Responding (ANR) dialog
Though the Service construct can be used to indicate background processing, a Service is
neither a separate process nor a separate thread. Like other application objects, it runs in the
main thread of the process. Thus, for the application to be responsive, tasks that are CPU
intensive (like building the classifier) or blocking (like networking) need to be performed in
separate threads. The main thread that runs the user-interface event loop needs to be kept
free.
In our application, tasks like building the classifier, real-time classification of data, fall
detection, and alerts generation are all performed in separate threads. For uploading of the
35 is an Android standard implementation of a service that has its own thread where it schedules
its work to be done, and finishes itself once done [30].
4.3 Alerts
This section describes alerts configuration and generation, including the user feedback
mechanism.
4.3.1 Settings for Alerts
We provide following alerts: a ‘bell’ to notify those around about the fall; and text message,
email and missed-calls to user-selected contact persons. Multiple contact persons can be
selected. User can choose to include location and a list of hospitals nearby in text messages
and in email. Number of missed-calls to place is configurable as well.
Following screenshots assist in understanding the various configurations.
36
Figure 16 - Settings
Waiting Duration refers to the Alerts Generation countdown duration, explained below.
Figure 17 - Waiting duration
User can choose whether the bell sound should be generated, duration of bell and the sound
37
Figure 18 - Audio alert settings
User can choose whether to generate text and email alerts, and whether to include location
38
Figure 19 - Text and email alerts
Similarly, user can choose whether to place missed-calls to selected contacts, and the number
of calls to place.
39
4.3.2 User Feedback during Alerts Generation
When the monitoring service detects a fall, it starts an Activity to ascertain whether the user
has indeed suffered a fall, and to generate alerts as selected by the user.
If the Android device supports speech recognition, an audio message is played to the user,
informing him/her about the detection of fall, and asking whether he/she is all right. If the
user replies in negative, we generate the alerts as explained below. If the user does not
respond within a fixed time interval, we perform the alerts generation countdown, which is
explained below.
User’s response at this stage also serves the purpose of improving the fall-detection accuracy.
The acceleration and orientation data set classified as fall is used to re-train the classifier,
with the user providing the classification for the data set. If the user fails to respond, no
assumption is made about the accuracy of the classification, and no re-training of the
classifier happens.
If the Android device does not support speech recognition, alerts generation countdown is
40
4.3.3 Alerts Generation
Phone’s speaker volume is set to maximum during alerts generation countdown. Seconds are
counted down to zero from the Waiting Duration selected by user. During this countdown,
user can cancel the alerts generation by pressing the ‘cancel’ button. Following screenshot
demonstrates an ongoing countdown.
Figure 21 - Alerts generation countdown
Alerts are generated after the end of countdown, and a message informing the user about it is
displayed on the screen.
If the audio alert is configured, a thread is started to handle it. This thread plays the selected
41 ringtone for the selected duration. Before playing the ringtone, the phone speaker volume is
set to maximum, and the ‘ring mode’ is set to normal. Ring mode setting enables the sound,
whether the phone vibrates depends on user choice. These changes are reverted at the end of
bell duration.
Several constraints guide the design of text, email and call alerts generation. These alerts can
all be selected individually, and within text and email, location and hospital can be
individually selected. Finding the user location is an expensive operation, so is getting the
details of contact persons. Moreover, sending text and email has to wait on finding user
address and fetching list of hospitals, which in turn have to wait on fetching user location.
Additionally, trying to fetch user location has to (eventually) timeout.
A thread is started if any of text, email, and call alerts are selected. Phone numbers of
selected contacts are fetched if call or txt alerts are selected, and email addresses are fetched
if email alerts are selected. Then, if the user address or ‘list of hospitals’ is selected in either
text or email alerts, a thread is started to fetch user location. Once these common operations
are done, individual threads are started to handle generation of each of the selected alerts.
Now, user’s location can be obtained using GPS or using nearby wireless network access
points and cellphone towers [37]. Accordingly, Android lists two providers for location –
42 Security'. A ‘fix’ obtained using GPS is typically more accurate, but GPS requires a clear
view of sky. We depend on the Network provider if the user is, for example, inside a
building; but a fix using Network provider requires connectivity to cellular or wireless
network.
In the location fetching thread, if GPS provider is enabled, we attempt to obtain a fix using
GPS. On timeout, an attempt is made using the Network provider, if enabled. Connectivity to
the network is verified for obtaining fix using network. On obtaining a fix, user address is
fetched if the option is selected in either text or email alerts. Using Google Places
web-service, a list of hospitals is fetched if the option is selected in either text or email alerts.
Text and email alerts generating threads wait for updates from location thread. For example,
if the user has selected ‘list of hospitals’ in text alerts, the thread waits till the list of hospitals
is fetched, then retrieves it, and appends it to the text message. Once all the required
information is gathered, text messages and emails are sent from the phone. Timeouts ensure
sending of messages, even in case of failures in fetching details.
43
Figure 22 - A received email alert
Finally, user-configured number of missed-calls are placed to selected contact persons in a
44
Chapter 5
Experiments and Observations
In this chapter, we discuss the experiments conducted for evaluating our fall detection
algorithm. We also document the impact of our applications on phone’s battery.
5.1 Experiment Methodology and Results
We evaluate our Multilayer Perceptron based classifier against a number of ADLs and falls.
Additionally, we also evaluate a threshold-based approach that mirrors the algorithm in [5]
against the same activities. The ADLs performed are walking, strolling, sitting, and sleeping.
Each activity, including falls, starts with the user being in an upright position, with the phone
in the trouser pocket. Each activity, including falls, is repeated 5 times for each approach. For
continuous activities like walking and strolling, the duration of one instance in our algorithm
(roughly 6 seconds), is considered as the duration of each repetition as well.
In the following tabulations of our results, the symbols ‘
’ and ‘
’ indicate correct andincorrect identification, respectively. For example, a ‘
’ for ‘walking’ indicates that theactivity was not detected as fall, while a ‘
’ for ‘fall’ indicates that the fall was indeed45 Results for Walking:
Table 2 - Results for ADL: Walking
Count Classifier-based Threshold-based
1
2
3
4
5
Results for Strolling:
Table 3 - Results for ADL: Strolling
Count Classifier-based Threshold-based
1
2
3
4
46
Results for Sitting:
Table 4 - Results for ADL: Sitting
Count Classifier-based Threshold-based
1
2
3
4
5
Results for Sleeping:
Table 5 - Results for ADL: Sleeping
Count Classifier-based Threshold-based
1
2
3
4
47
Results for fall:
Table 6 - Results for fall
Count Classifier-based Threshold-based
1
2
3
4
5
5.2 Evaluation and Observations:
Following table provides a comparison of the approaches:
Table 7 - Comparison of approaches
Approach True
Positives False Positives True Negatives False Negatives Threshold-based fall detection
3 2 18 2
Classifier-based fall detection
4 1 19 1
48 During our experiments, in addition to the results presented above, we observed a large
number of false positives for the threshold-based approach; falls were reported while taking
the phone out of pocket, keeping it in, taking it off the ear at the end of a call, and while
performing high-impact activities like walking, running, and climbing up the stairs. A large
number of false positives are hazardous as a detection system that produces too many false
alarms can be rejected by the users [5]. We observed that the classifier-based approach too
produced false positives during such ADLs, but to a significantly lesser extent; and on
classifying such instances as non-falls, they were not falsely identified again, as the classified
‘learnt’ from them.
Finally, threshold-based approach also reported false-negatives for falls. This was also
observed during our work with threshold-based approach. The reason behind such false
negatives is – pitch does not change by a value close to 90 degrees in all falls, the change is
mostly about 75 degrees.
Limitations
The experiments and results above document only a small sample of tests. Though we have
observed that classifier-based approach yields better results than threshold-based approach, it
would be beneficial to perform the experiments with a wider variation of test subjects, falls,
and activities of daily life. Such data, in addition to sensor data patterns from real falls (as
49 in building a better classifier, further improving fall-detection accuracy. We plan to address
some of these issues as explained in section ‘Future Work’ in Chapter 6 below.
5.3 Battery Consumption
Following table presents a measure of battery consumption for both the applications
developed by us. We calculated the time taken for the battery power level to reduce from
100% to 80%, with and without our applications running. Phone’s usage conditions for these
measurements included audio playback, voice calls, and moderate internet access over both
WiFi and 3G networks.
Table 8 - Battery power consumption of applications - 1
Application Time taken for battery
power level to reduce by 20%
Neither applications running, phone’s normal usage conditions
117 minutes
Data Collection application running, two successful uploads of sensor data, coupled with phone’s normal usage
99 minutes
Fall Detection application running – fall detection, alerts generation and classifier retraining; coupled with phone’s normal usage
91 minutes
We also evaluated time taken for the battery power level to reduce from 100% to 5%, with
50
Table 9 - Battery power consumption of applications - 2
Application Time taken for battery power level to reduce by 95%
Neither applications running 23 hours and 18 minutes
Data Collection application running 13 hours and 40 minutes
Fall Detection application running 13 hours and 10 minutes
Thus, we observed that both Data Collection and Fall Detection applications have an impact
on battery life; it took 18 minutes less for the battery to lose same amount of power with Data
Collection application running, and it took 26 minutes less with the Fall Detection
application running. For a complete discharge, the differences become more pronounced,
with constant sensor monitoring and background processing by our applications resulting in
51
Chapter 6
Summary and Future Work
In this thesis, we developed an Android application for automatic fall-detection and alerts
generation. The application monitors the built-in accelerometer and magnetic field sensors in
the background using a Service, to calculate device acceleration and orientation. A
Multilayer Perceptron classifier from Weka Data Mining Suite is trained on training data
comprised of both fall and non-fall samples, and is used for real-time classification of sensor
data. Multiple, overlapping, sliding windows over the sensor data stream are used to provide
instances for classification. A fall is characterized by near-simultaneous occurrence of
fall-patterns in both acceleration and orientation.
The alerts to be generated and the persons to be contacted on fall detection are configurable
by user. We provided following alerts: an audible bell with the phone's volume set to
maximum to alert those nearby, and emails, text messages and missed-calls to selected
contact persons. Additionally, users can choose to include their location and a list of hospitals
in their vicinity, with addresses and phone numbers, in the email and/or text message.
To reduce the false positives, we used following method. On detecting a fall, the application
asks the user about his/her condition and seeks a spoken response from the user. The
52 response serves two purposes - it is used to re-train the classifier, and in case of a false
positive, it aborts the alert generation. In the absence of response, alerts are generated,
preceded by user-configured waiting duration. Users can cancel alerts generation during this
waiting duration as well, in case of a false positive.
In addition to an Artificial Neural Network based classifier, we also explored threshold-based
and Dynamic Programming based approaches for fall detection.
6.1 Future Work
Classifier accuracy could be improved by using real-world data from application users. We
propose the following scheme. Sensor data instances that are classified by users as true or
false positives are currently used to improve the classifier locally. These instances could be
communicated to a server, where they could serve as training data for the classifier. A
better-trained classifier could be delivered to users through periodic updates of the application via
Android Market. This would also improve application performance as the blocking task of
building the classifier would be transferred to a server.
Collected data could also serve further research requirements in this domain. We have not
come across publically available sensor data involving fall patterns during the course of this
53 available in Android Market. Via an update to this application, we are making possible the
collection of raw acceleration and orientation data, and uploading it to a public server.
We have used two classifiers, one each for acceleration and pitch signal. Our fall signal
considers outputs from both the classifiers. Instead of using multiple separate classifiers and
combining their outputs, an approach utilizing a multidimensional classifier could be
explored.
Additionally, in the fall detection application, users could be provided a 'sensitivity setting'
for fall detection. Provided setting value could be used while interpreting the classifier
54
References
[1] S. E. Lamb, E. C. Jostad-Stein, K. Hauer and C. Becker, "Development of a Common Outcome Data Set for Fall Injury Prevention Trials: The Prevention of Falls Network Europe Consensus," Journal of the American Geriatrics Society, vol. 53, no. 9, pp. 1618-1622, September 2005.
[2] A. A. Zecevic, A. W. Salmoni, M. Speechley and A. A. Vandervoort, "Defining a Fall and Reasons for Falling: Comparisons Among the Views of Seniors, Health Care Providers, and the Research Literature," The Gerontologist, vol. 43, no. 3, pp. 367-376, 2006.
[3] "Falls Among Older Adults: An Overview," Centers for Disease Control and Prevention, National Center for Injury Prevention and Control, Division of Unintentional Injury Prevention, 8 December 2010. [Online]. Available:
http://www.cdc.gov/HomeandRecreationalSafety/Falls/adultfalls.html. [Accessed 20 July 2011].
[4] A. K. Bourke, J. V. O' Brian and G. M. Lyons, "Evaluation of a threshold-based tri-axial accelerometer fall detection algorithm," Gait and Posture, vol. 26, no. 2, pp. 194-199, 2007.
[5] F. Sposaro and G. Tyson, "iFall: An Android Application for Fall Monitoring and Response," in 31st Annual International Conference of the IEEE EMBS, Minneapolis, Minnesota, USA, 2009.

![Figure 13 - Dynamic Time Warping [20]](https://thumb-us.123doks.com/thumbv2/123dok_us/1325092.1165411/39.612.213.420.70.232/figure-dynamic-time-warping.webp)