PREDICTION OF CAR CABIN ENVIRONMENT BY MEANS OF 1D
AND 3D CABIN MODEL
Fišer J.*, Pokorný J.* ,Jícha M.*•
Abstract:
Thermal comfort and also reduction of energy requirements of air-conditioning system in vehicle cabins are currently very intensively investigated and up-to-date issues. The article deals with two approaches of modelling of car cabin environment; the first model was created in simulation language Modelica (typical 1D approach without cabin geometry) and the second one was created in specialized software Theseus-FE (3D approach with cabin geometry). Performance and capabilities of this tools are demonstrated on the example of the car cabin and the results from simulations are compared with the results from the real car cabin climate chamber measurements.
1. I
NTRODUCTION!" # $ % & ' % ( ) * + & ',-) . & / + & 0 0 + & 1& +23
• 4 5 26 4 5 )'7 4 0 58 9 : ;
2 0 3 '< ! ===> ?
'!@? A? BC!D @ CC 1!C! BC!D @ CC 1!=C BC!D@CC1!E
This is an Open Access article distributed under the terms of the Creative Commons Attribution License 2.0, which permits unrestricted use, distribution, and reproduction in any medium, provided the original work is properly cited.
2. C
ABIN ENVIRONMENT SIMULATION BY1
D APPROACH0 * 0 * 0 & % * '(' 3( 3 A 1R( % / . @% 2( %
4 2 / ( R S + + S + 9+ T + U,.9+'
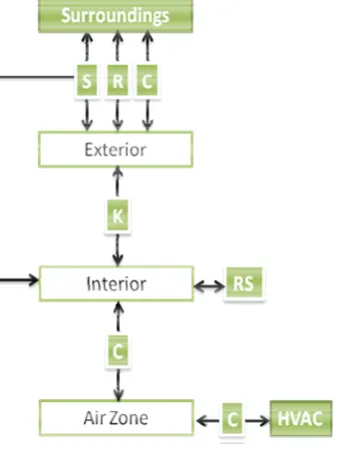
Figure 1 Heat transfer scheme - 1D cabin in Modelica language
3. C
ABIN ENVIRONMENT SIMULATION BY3
D APPROACH
( V 2 ! W C W!+X WY+X WE+X2 + 2 1 :
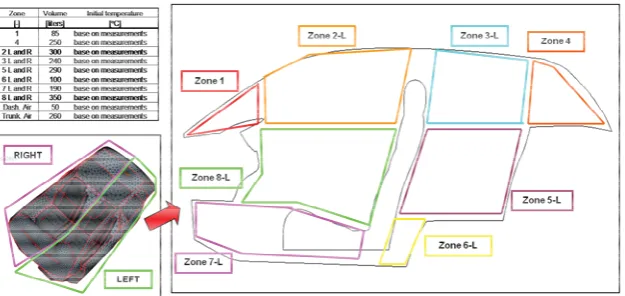
Figure 2 Cabin interior - air zones definitions
9 % ( VV ( A % 2 ( % %(
Figure 3 Advection scheme in the car cabin in case of cooling by air conditioning during a hot summer day, and
setting of the environment boundary conditions
: 2 1 , ' ) % + DDD -V! 9
Solar load 1000 W/m2, 2800 mm above f loor
Sun rays perpendicular to f loor Sun without moving
Wind speed 5 km/h Air temperature 20/30 °C Relative humidity 40 %
VW POLO vehicle Special setup f or each
case see table 1
Cabin
Z5-L
Z6-L 34,5 dm3
/s
Z7-L 10 dm3
/s Z8-L
Z2-L Z3-L 11,5 dm3
/s
11,5 dm3
/s 23 dm3
/s Z
1
5 dm3
/s
Z 4 Advection scheme on
the left side
23 dm3
/s
23 dm3
/s
23 dm3
/s
10 dm3
/s 15 dm3/s 15 dm3/s 5 dm3/s
To environment
To environment
% 1! 'V 1=DD = 'VYDD C1Z9 CD[. DDE 'V 2C
4. D
ISCUSSION OF RESULTS2C= 2 C + # ' + W1+XW1+)U ( ( 9 2 C . 1& CZ9 1!='V1& !Z9 * 0 & &
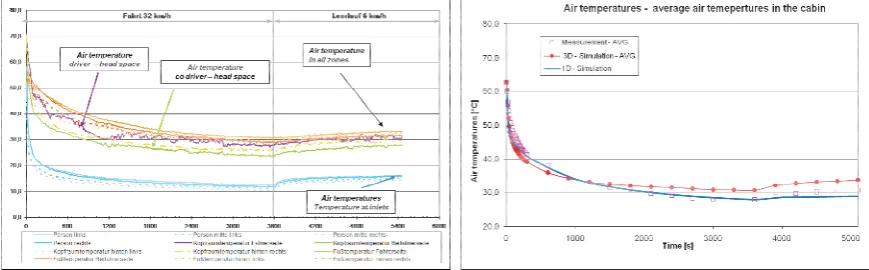
Figure 4 Air temperature (measurement) in each air zones vs. time (on the left) and comparison of the average
air temperature from measurement and simulation for the entire cabin (on the right)
42@ 1& .
2 @ + 1& 4
' '
Figure 5 Temperatures distribution - interior surfaces: time 0s (on the left) and at 5400s (on the right)
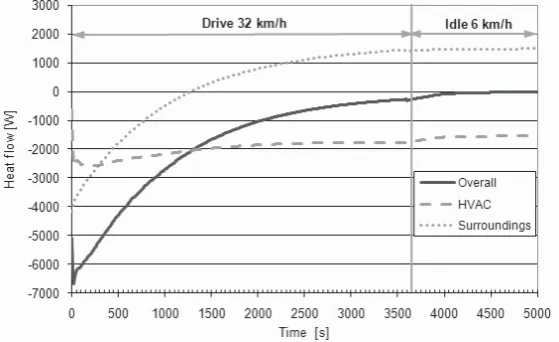
4= U,.9 = ; !=D . U,.9 U,.9 0 = CDDD
Figure 6 Heat flow in 1D Modelica model time from 0s till 5400s
5. C
ONCLUSIONS,- ) 0 & 23 1D ' - & '& 1& + 4 *&0 & . #( ( 9); 0 (
.' R A :&1DDDDE 9 ( , ' '
6. R
EFERENCES" U T&\ \5 \9 -.+ + $SSOLHG(QHUJ\ , Y1 4= 5!DD= @C@+ @@E 4$D1D=+!=>
!" $ 2\- &&, R39 6$(SDSHUQ .3 >>!