962 | P a g e
Bivariate Linear Regression Analysis of Impact of Faults
on OO Software
Dr. Brij Mohan Goel
Assistant Professor, Vaish College of Engineering, Rohtak
ABSTRACT
In this research paper two variable linear regression analysis of impact of faults of the three projects InterCafe1,
TermoProjekt1 and Zuzel1 are discussed. This means it is used to examine the usefulness of the metrics when
used collectively. It informs the user about the levels of predictive performance that can be achieved. It also tells
which metrics may play significant and more dominant role in predicting fault-proneness.
I.INTRODUCTION
Bivariate LR can be used to build a prediction model for the fault-proneness of classes. The Multivariate LR
uses the combination of metrics to identify the effect on the dependent variable.
The following statistics are noted down for each of the metric
R2 Statistic- It is the proportion of the variance in the dependent variable that is explained by the variance of the independent variables. The large the effect of the model's explanatory variables, the better the accuracy
of the given model.
R2(adjusted)–It is the modified version of R2. It has been adjusted for the number of predictors in the model. If the value of adjusted R2 increases, this means the new variable improves the model more than would be
expected by chance. If the value decreases this means the new variable improves the model by less than
expected by chance. This value is always smaller than the R2.
Standard Error – It is ameasure of the statistical accuracy of an estimate. The smaller values of the standard error indicate that the observations are closer to the fitted line and are better.
These statistics are analysed and reported using the SPSS package.In this research paper multivariate (two,
three, four, five and six) variable linear regression analysis of impact of faults of the three projects InterCafe1,
TermoProjekt1 and Zuzel1 are discussed.
II. REVIEW OF LITERATURE
N. Rajkumar et al. established the relationship, at class level, among object oriented metrics and fault proneness.
The fault was taken as a function of DIT, CBO, WMC, NOC, RFC, and LCOM. All these metrics were of the
CK metric suite. The authors showed that for prediction of fault proneness, conceptual relations between classes
963 | P a g e
multivariate analysis. They showed that it is possible to derive accurate models to predict the classes that
contain most of the faults. They showed that when predicting fault prone classes, the best model shows 80% of
correct classifications and finds over 90% of faulty classes.
Tang, M.H., Kao, M.H., & Chen, M.H. worked on an empirical study on object-oriented metrics. The study was
based on three real-time systems. These systems contain several natural faults. The faults were classified into
three categories namely object-oriented faults, object management faults and traditional faults. The study used
CK metrics to validate these faults. The study used logistic regression analysis. The study revalidates CK
metrics using three real-time systems. The authors found that WMC metric was a good indicator for faulty
classes. The RFC metric was a good indicator for OO faults.
Briand, L., Daly, J., Porter, V., & Wust, J. worked on the comprehensive empirical validation of design
measures for object-oriented systems. The study used descriptive statistics, principal component analysis, and
univariate regression analysis against the fault data. The study concluded that the univariate analysis results
have shown that many coupling and inheritance measures are strongly related to the probability of fault
detection in a class. On the other hand, cohesion did not have a significant impact on fault-proneness.
III. OBJECTIVE
To study Bivariate analysis of object oriented metrics model for fault prediction to improve the performance of
software product.
IV.BIVARIATELINEAR REGRESSION ANALYSIS
The objective of the bivariate linear regression analysis is to study how accurately the differentcombinations of
considered metrics could predict the number-of-faults. We have selected various combinations of bivariate
metrics as independent variables and variable “Bug” as dependent variable at a time to predict the faults.Table 1
gives the bivariate subsets regression analysis (i.e. values of R2, R2 (Adjusted) and Standard Error) for various
combinations of metrics, when two metrics are considered as independent variables, in case of the project
InterCafe1.
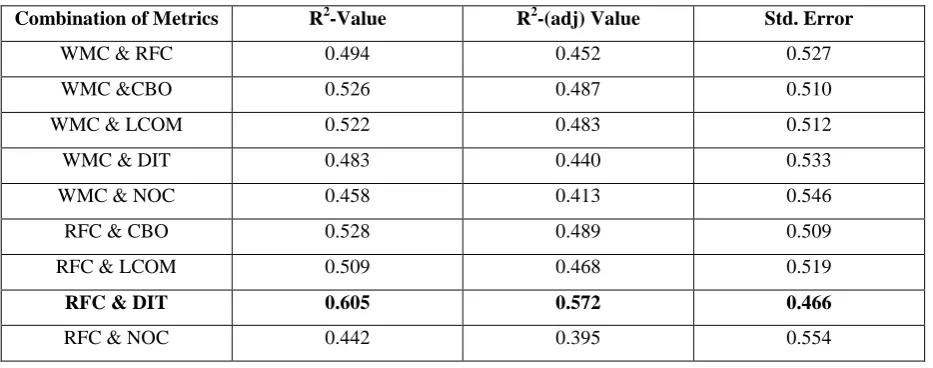
Table 1:Result of Bivariate Logistic Regression for InterCafe1
Combination of Metrics R2-Value R2-(adj) Value Std. Error
WMC & RFC 0.494 0.452 0.527
WMC &CBO 0.526 0.487 0.510
WMC & LCOM 0.522 0.483 0.512
WMC & DIT 0.483 0.440 0.533
WMC & NOC 0.458 0.413 0.546
RFC & CBO 0.528 0.489 0.509
RFC & LCOM 0.509 0.468 0.519
RFC & DIT 0.605 0.572 0.466
964 | P a g e
CBO & LCOM 0.510 0.469 0.519
CBO & DIT 0.505 0.464 0.521
CBO & NOC 0.501 0.459 0.524
LCOM & DIT 0.137 0.065 0.689
LCOM & NOC 0.126 0.054 0.693
DIT & NOC 0.017 0.000 0.735
Figure 1: Comparison chart of R2-(adj) Values for the project InterCafe1
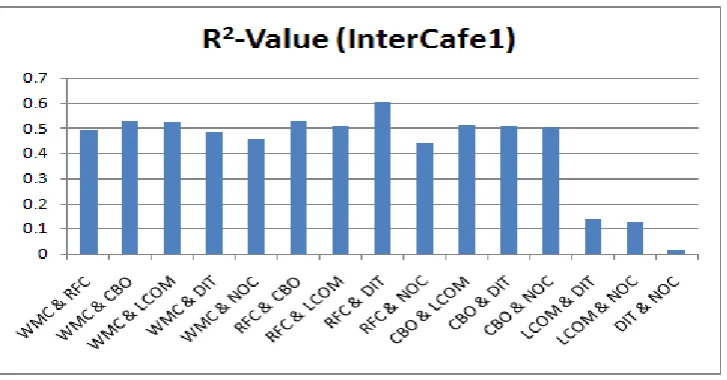
Figure 2: Comparison chart of R2 Values for the project InterCafe1
965 | P a g e
From the Table 1 and Figure1, it has been observed that the R2 (adj)-value is maximum (i.e. 0.572) for the
combination of metrics RFC& DIT among all the combination of metrics. Also, the R2-vlaue for this model as
shown in Table 1 and Figure2 is 0.605 which is again the highest. The Std. Error value (i.e 0.466) as shown in
Table 1 and Figure3 is the lowest for the combination of metrics RFC& DIT among all the combination of
metrics. As higher the values of R2(adj), R2 and lowest the value of Std. Error means that RFC & DIT is best
combination of metrics among all the combination of metrics for the Project InterCafe1.
The Table 2 gives the bivariate subsets regression analysis (i.e. values of R2, R2 (Adjusted) and Standard Error)
for various combinations of metrics, when two metrics are considered as independent variables, in case of the
project TermoProjekt1.
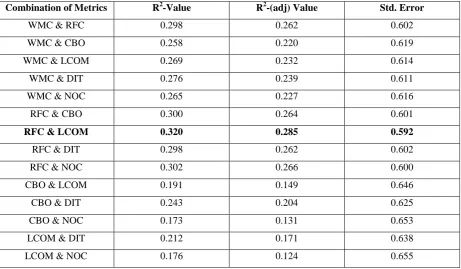
Table 2: Result of Bivariate Logistic Regression for TermoProjekt1
Combination of Metrics R2-Value R2-(adj) Value Std. Error
WMC & RFC 0.298 0.262 0.602
WMC & CBO 0.258 0.220 0.619
WMC & LCOM 0.269 0.232 0.614
WMC & DIT 0.276 0.239 0.611
WMC & NOC 0.265 0.227 0.616
RFC & CBO 0.300 0.264 0.601
RFC & LCOM 0.320 0.285 0.592
RFC & DIT 0.298 0.262 0.602
RFC & NOC 0.302 0.266 0.600
CBO & LCOM 0.191 0.149 0.646
CBO & DIT 0.243 0.204 0.625
CBO & NOC 0.173 0.131 0.653
LCOM & DIT 0.212 0.171 0.638
966 | P a g e
DIT & NOC 0.142 0.098 0.665
Figure 4: Comparison chart of R2-(adj) Values for the project TermoProjekt1
967 | P a g e
Figure 6: Comparison chart of Standard Error Values for the project TermoProjekt1
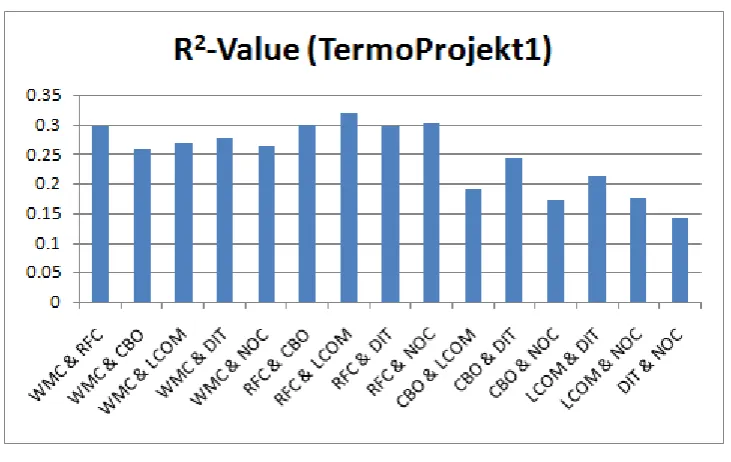
From the Table 2 and Figure4, it has been observed that the R2 (adj)-value is maximum (i.e. 0.285) for the
combination of metrics RFC &LCOM among all the combination of metrics. Also, the R2-vlaue for this model
as shown in Table 2 and Figure5 is 0.320 which is again the highest. The Std. Error value (i.e. 0.592) as shown
in Table 2 and Figure6 is the lowest for the combination of metrics RFC &LCOM among all the combination of
metrics. As higher the values of R2(adj), R2 and lowest the value of Std. Error means that RFC &LCOM is best
combination of metrics among all the combination of metrics for the Project TermoProjekt1.
The Table 3 gives the bivariate subsets regression analysis (i.e. values of R2, R2 (Adjusted) and Standard Error)
for various combinations of metrics, when two metrics are considered as independent variables, in case of the
project Zuzel1.
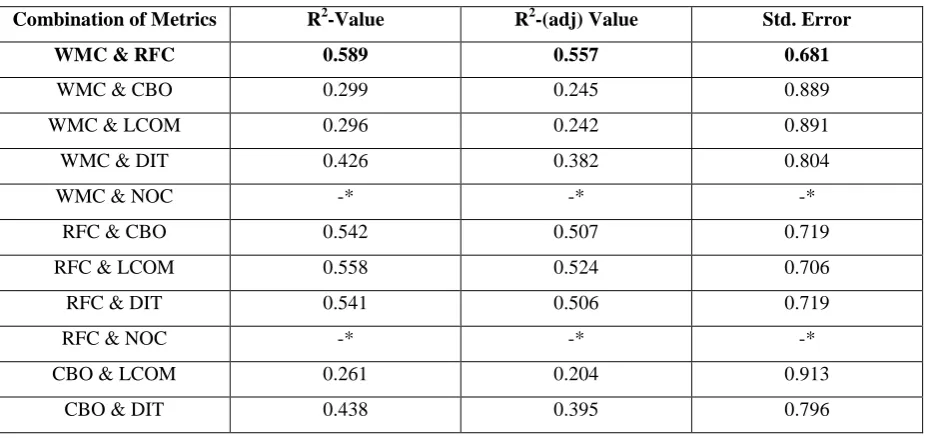
Table 3:Result of Bivariate Logistic Regression for Zuzel1
Combination of Metrics R2-Value R2-(adj) Value Std. Error
WMC & RFC 0.589 0.557 0.681
WMC & CBO 0.299 0.245 0.889
WMC & LCOM 0.296 0.242 0.891
WMC & DIT 0.426 0.382 0.804
WMC & NOC -* -* -*
RFC & CBO 0.542 0.507 0.719
RFC & LCOM 0.558 0.524 0.706
RFC & DIT 0.541 0.506 0.719
RFC & NOC -* -* -*
CBO & LCOM 0.261 0.204 0.913
968 | P a g e
CBO & NOC -* -* -*
LCOM & DIT 0.407 0.361 0.818
LCOM & NOC -* -* -*
DIT & NOC -* -* -*
*The value of NOC is zero in all columns.
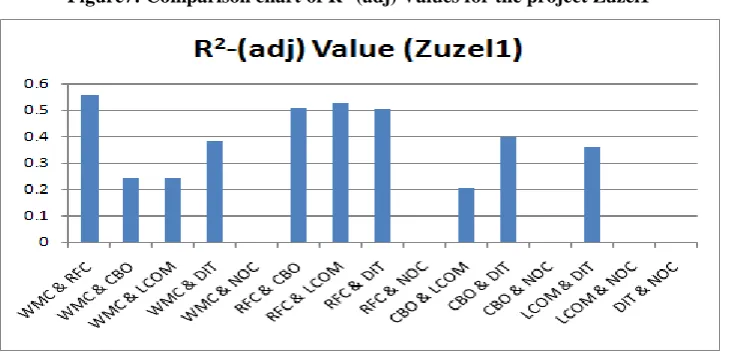
Figure7: Comparison chart of R2-(adj) Values for the project Zuzel1
Figure 8: Comparison chart of R2 Values for the project Zuzel1
969 | P a g e
From the Table 3 and Figure7, it has been observed that the R2 (adj)-value is maximum (i.e. 0.557) for
the combination of metrics WMC & RFC among all the combination of metrics. Also, the R2-vlaue for this
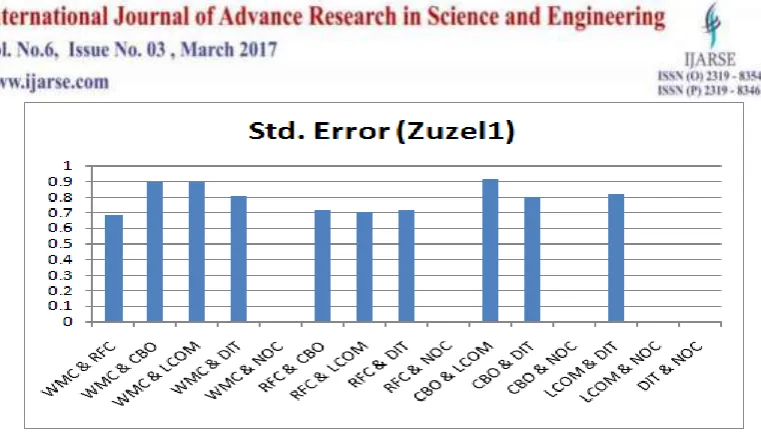
model as shown in Table 3 and Figure8 is 0.589 which is again the highest. The Std. Error value (i.e. 0.681) as
shown in Table 3 and Figure9 is the lowest for the combination of metrics WMC & RFC among all the
combination of metrics. As higher the values of R2(adj), R2 and lowest the value of Std. Error means that WMC
& RFC is best combination of metrics among all the combination of metrics for the Project Zuzel1.
V. LINEAR REGRESSION ANALYSIS PROJECT WISE
The Table 4 is obtained by taking the best values of the projects InterCafe1, TermoProjekt1 and Zuzel1
from the Tables 1, 2 and 3. The Corresponding column chart is shown in Figure10.
Table 4: Comparison Table for best combination of Two Metrics project-wise
Combination of Metrics (Project)
R
2-Value
R
2-(adj) Value
Std. Error
RFC & DIT (InterCafe1) 0.605 0.572 0.466
RFC & LCOM (TermoProjekt1) 0.32 0.285 0.592
WMC & RFC (Zuzel1) 0.589 0.557 0.681
970 | P a g e
From Table 4 and Figure 10, it is clearly shown that R2-(adj) and R2 values for the combination of metrics in
InterCafe1 is highest means having best values. The Std. Error value for the combination of metrics in
InterCafe1 is lowest. By definition of R2-(adj), if adding a variable raises the R2 (adjust) for a regression, that’s a
better indication that is has improved the model as given. By definition of R2, the high value of R2has the
indication that the model’s independent variables have higher effect the model is more accurate the model. By
definition of Std. Error, The lower standard error is, the lower the impact of the faults in a class and the higher
standard error is, the higher the impact of faults in a class. So InterCafe1 has low impact of faults in the classes.
VI.CONCLUSION
To see the result of Two Variables, it is noted that by the definition of R2-(adj), R2 and Std. Error, as discussed
of the Bivariate regression analysis in connection with fault-proneness prediction in terms of low/medium/high
impact of faults,the following points have been noted down. The InterCafe1 project has low impact of faults in
the classes. The TermoProjekt1 project has medium impact of faults in the classes. The Zuzel1 project has high
impact of faults in the classes.
REFERENCES
[1] N. Rajkumar et al., “Fault Prediction of Object Oriented Design using a Hybrid ANFIS Prediction Model”,
International Journal of Advanced Engineering Technology, Vol. VII, Issue –III, pp. 179-183, 2016.
[2] Tang, M.H., Kao, M.H. and Chen, M.H., An Empirical Study on Object Oriented Metrics. In proceedings
of the 6th International Software Metrics Symposium, Boca Raton, 242-249, 4-6 November 1999.
[3] L. C. Briand, J. W. Daly, V. Porter, and J. Wust., A Comprehensive Empirical Validation of Product
971 | P a g e
[4] S. R. Chidamber and C. F. Kemerer, Towards a metrics suite for Object- Oriented design, vol. 26, ACM,
1991.
[5] T. Menzies, B. Caglayan, Z. He, E. Kocaguneli, J. Krall, F. Peters, and B. Turhan, The Promise Repository
of Empirical Software Engineering Data, June 2012.
[6] V.R. Basili, L.C. Briand, and W.L. Melo, “A Validation of Object-Oriented Design Metrics as Quality
Indicators,” IEEE Trans. Software Eng., vol. 22, no. 10, pp. 751-761, Oct. 1996.
[7] L.C. Briand, J. Wust, J.W. Daly, and D.V. Porter, “Exploring the Relationships between Design Measures
and Software Quality in Object-Oriented Systems,” J. Systems and Software, vol. 51, no. 3,pp. 245-273,
2000.
[8] W.G. Hopkins, A New View of Statistics. Sport Science, 2003.
[9] L.C. Briand and J. Wust, “Modeling Development Effort in Object-Oriented Systems Using Design
Properties,” IEEE Trans. Software Eng., vol. 27, no. 11, pp. 963-986, Nov. 2001.
[10] Love Kumar, Software Fault Prediction using Object-Oriented Metrics, e-thesis, Department of Computer
Science and Engineering, National Institute of Technology Rourkela, India, 2014.
[11] Goel, Brij Mohan, and Pradeep Kumar Bhatia. "Investigating of high and low impact faults in