doi: 10.3389/fphys.2019.00019
Edited by:
Mikel Izquierdo, Universidad Pública de Navarra, Spain
Reviewed by:
Thierry Busso, Université Jean Monnet, France Laurent Bosquet, University of Poitiers, France
*Correspondence:
Jeff S. Coombes [email protected]
Specialty section:
This article was submitted to Exercise Physiology, a section of the journal Frontiers in Physiology
Received:20 October 2018
Accepted:10 January 2019
Published:05 February 2019
Citation:
Williams CJ, Gurd BJ, Bonafiglia JT, Voisin S, Li Z, Harvey N, Croci I, Taylor JL, Gajanand T, Ramos JS, Fassett RG, Little JP, Francois ME, Hearon CM Jr, Sarma S, Janssen SLJE, Van Craenenbroeck EM, Beckers P, Cornelissen VA, Pattyn N, Howden EJ, Keating SE, Bye A, Stensvold D, Wisloff U, Papadimitriou I, Yan X, Bishop DJ, Eynon N and Coombes JS (2019) A Multi-Center Comparison ofVO˙
2peak Trainability Between Interval Training and Moderate Intensity Continuous Training. Front. Physiol. 10:19. doi: 10.3389/fphys.2019.00019
A Multi-Center Comparison of
˙
VO
2peak
Trainability Between Interval
Training and Moderate Intensity
Continuous Training
Camilla J. Williams1, Brendon J. Gurd2, Jacob T. Bonafiglia2, Sarah Voisin3, Zhixiu Li4,
Nicholas Harvey5, Ilaria Croci1,6, Jenna L. Taylor1, Trishan Gajanand1, Joyce S. Ramos7,
Robert G. Fassett1, Jonathan P. Little8, Monique E. Francois8,
Christopher M. Hearon Jr9, Satyam Sarma9, Sylvan L.J.E. Janssen9,10,
Emeline M. Van Craenenbroeck11, Paul Beckers11, Véronique A. Cornelissen12,
Nele Pattyn12, Erin J. Howden13, Shelley E. Keating1, Anja Bye6,14, Dorthe Stensvold6,
Ulrik Wisloff1,6, Ioannis Papadimitriou3, Xu Yan3,15, David J. Bishop3,16, Nir Eynon3and
Jeff S. Coombes1*
1School of Human Movement and Nutrition Sciences, The University of Queensland, Brisbane, QLD, Australia,2School
of Kinesiology and Health Studies, Queen’s University, Kingston, ON, Canada,3Institute for Health and Sport (iHeS), Victoria
University, Melbourne, VIC, Australia,4Translational Genomics Group, Institute of Health and Biomedical Innovation,
Queensland University of Technology at Translational Research Institute, Princess Alexandra Hospital, Brisbane, QLD, Australia,5Faculty of Health Sciences and Medicine, Bond University, Robina, QLD, Australia,6K.G. Jebsen Center
of Exercise in Medicine, Department of Circulation and Medical Imaging, Faculty of Medicine, Norwegian University of Science and Technology, Trondheim, Norway,7SHAPE Research Centre, Exercise Science and Clinical Exercise
Physiology, College of Nursing and Health Sciences, Flinders University, Adelaide, SA, Australia,8School of Health
and Exercise Sciences, University of British Columbia, Kelowna, BC, Canada,9Internal Medicine, Institute for Exercise
and Environmental Medicine, University of Texas Southwestern Medical Center, Dallas, TX, United States,10Department of
Physiology, Radboud University Medical Center, Nijmegen, Netherlands,11Cardiology Department, Antwerp University
Hospital, Antwerp, Belgium,12Department of Rehabilitation Sciences – Research Group for Rehabilitation in Internal
Disorders, Catholic University of Leuven, Leuven, Belgium,13Baker Heart and Diabetes Institute, Melbourne, VIC, Australia, 14St. Olavs Hospital, Trondheim, Norway,15Australian Institute for Musculoskeletal Science (AIMSS), Melbourne, VIC,
Australia,16School of Medical and Health Sciences, Edith Cowan University, Joondalup, WA, Australia
There is heterogeneity in the observed VO˙ 2peak response to similar exercise training,
and different exercise approaches produce variable degrees of exercise response (trainability). The aim of this study was to combine data from different laboratories to compareVO˙ 2peaktrainability between various volumes of interval training and Moderate
Intensity Continuous Training (MICT). For interval training, volumes were classified by the duration of total interval time. High-volume High Intensity Interval Training (HIIT) included studies that had participants complete more than 15 min of high intensity efforts per session. Low-volume HIIT/Sprint Interval Training (SIT) included studies using less than 15 min of high intensity efforts per session. In total, 677 participants across 18 aerobic exercise training interventions from eight different universities in five countries were included in the analysis. Participants had completed 3 weeks or more of either high-volume HIIT (n= 299), low-volume HIIT/SIT (n= 116), or MICT (n= 262) and were predominately men (n = 495) with a mix of healthy, elderly and clinical populations. Each training intervention improved meanVO˙ 2peak at the group level (P<0.001). After
adjusting for covariates, high-volume HIIT had a significantly greater (P<0.05) absolute
˙
VO2peak increase (0.29 L/min) compared to MICT (0.20 L/min) and low-volume HIIT/SIT
in high-volume HIIT (3.3 ml/kg/min) than MICT (2.4 ml/kg/min) and insignificantly greater (P = 0.09) than low-volume HIIT/SIT (2.5 mL/kg/min). Based on a high threshold for a likely response (technical error of measurement plus the minimal clinically important difference), high-volume HIIT had significantly more (P <0.01) likely responders (31%) compared to low-volume HIIT/SIT (16%) and MICT (21%). Covariates such as age, sex, the individual study, population group, sessions per week, study duration and the average between pre and postVO˙ 2peakexplained only 17.3% of the variance inVO˙ 2peak
trainability. In conclusion, high-volume HIIT had more likely responders to improvements
inVO˙ 2peak compared to low-volume HIIT/SIT and MICT.
Keywords: cardiorespiratory fitness,VO2max,˙ VO2peak, exercise training, response heterogeneity, trainability˙
INTRODUCTION
Health guidelines recommend aerobic exercise training for improving cardiorespiratory fitness (CRF) and reducing the risk of chronic disease and premature mortality (WHO, 2015;
Ross et al., 2016). An increase of one metabolic equivalent
(3.5 mL/kg/min) results in a 10–25% improvement in survival over an approximate 10-year follow-up (Blair et al., 1995;Gulati
et al., 2003;Myers, 2003; Myers et al., 2011; Nes et al., 2014).
There are various forms of aerobic exercise training that can be differentiated by their intensity and duration. Moderate Intensity Continuous Training (MICT) generally consists of 30–60 min of aerobic exercise at 64–76% peak heart rate (ACOS Medicine, 2017), while interval training involves more intense bouts interspersed by recovery periods (Weston et al., 2014). Interval training can be separated based on intensity into High-Intensity Interval Training (HIIT) or Sprint Interval Training (SIT). HIIT can be further defined by volume. Although classically associated with weekly loads in athletes, volume has gained acceptance to define the total duration of HIIT interval lengths (Boyd et al.,
2013;Scribbans et al., 2014;Ramos et al., 2017;Eigendorf et al.,
2018; Reljic et al., 2018). High-volume High-Intensity Interval
Training (HIIT) typically includes repeated intervals of near maximal aerobic efforts for a specific period (e.g., 4×4-minute intervals at 90% peak heart rate), with a rest/recovery period in between (e.g., 3 min at 65% peak heart rate). Low-volume HIIT has fewer or shorter intervals (e.g., 6×1-minute intervals at 120% peak work rate) and SIT is defined as supramaximal exertion (e.g., 8× 20-second intervals at 170% peak work rate) with active recovery/rest between intervals. Interval training has recently become popular because it is more time efficient (Phillips
et al., 2017), and sometimes more enjoyable than MICT (Bartlett
et al., 2011;Jung et al., 2014).
Meta-analyses have shown that high-volume HIIT is comparable, if not superior, to MICT for improving CRF (VO˙ 2max/VO˙
2peak) and other health biomarkers (Gist et al.,
2014;Weston et al., 2014;Milanovic et al., 2015;Ramos et al.,
2015;Batacan et al., 2017). High-volume HIIT produces greater
˙
VO2max/VO˙ 2peak changes than low-volume HIIT and SIT
protocols at the group level (Bacon et al., 2013; Astorino and
Schubert, 2014;Gist et al., 2014;Milanovic et al., 2015); where
˙
VO2maxis a maximal effort on graded exercise test with a plateau in oxygen consumption, and VO˙
2peakis a maximal effort on a
graded exercise test without a plateau in oxygen consumption
(Coombes and Skinner, 2014). However, there is heterogeneity
in the observed CRF response to an exercise intervention (i.e., the “trainability” of an individual). Some individuals show large improvements in CRF (often described as “responders”), whereas others show little to no-improvements (“low-responders”) following the same apparent exercise training stimulus (Bacon
et al., 2013;Astorino and Schubert, 2014;Coombes and Skinner,
2014; Mann et al., 2014; Bouchard et al., 2015). Optimizing
exercise training to improve CRF is imperative to long-term health; therefore, it is important to understand how factors such as the type of aerobic exercise intervention can influence observed rates of CRF trainability.
In the largest study to date on CRF trainability (The HERITAGE study; n= 742),VO˙ 2max gain following 20 weeks of endurance training was 400 mL on average, with 7% of participants gaining 100 mL/min or less and 8% gaining 700 mL/min or more (Bouchard et al., 1999). However, this observed heterogeneity inVO˙
2maxtrainability may have resulted from technical error of measurement (TEM); a combination of random within-individual variation and/or measurement error (Atkinson and Batterham, 2015; Hecksteden et al., 2015,
2018; Hopkins, 2015; Williamson et al., 2017). Furthermore,
the variability in training response should consider the minimal clinically important difference (MCID). Without considering the TEM and the MCID, identifying the probability of an individual’s response is inconclusive and CRF trainability may be misclassified (Atkinson and Batterham, 2015). Despite this, many studies to-date have used zero-change or a proportion of a group to classify “adverse-responders”, “non-responders”, “low-responders” and “high “low-responders” to CRF training (
Scharhag-Rosenberger et al., 2012;Mann et al., 2014;Gurd et al., 2016).
Using this terminology based on arbitrary indicators for response is problematic and has created much debate (Montero and
Lundby, 2017;Hecksteden et al., 2018). Some investigators have
proposed that the concept of “non-responders” is a myth and that simply increasing the training load converts the majority of “non-responders” to “responders” (Bacon et al., 2013;Joyner,
2017;Montero and Lundby, 2017). Training load considers both
stroke volume and cardiac output (Howden et al., 2015, 2018), both of which are imperative for increasing the ability of the heart to improveVO2max (˙ Levine, 2008).
The primary aim of this study was to utilize a large multi-center approach (n = 677 participants across 18 studies) to compare the number of likely responders between different training loads: high-volume HIIT, low-volume HIIT/SIT, and MICT interventions. In this study, we have taken into account the TEM and the MCID to categorize participants as either a “likely responder”, “likely non-responder”, “likely adverse responder” or “uncertain”. The use of these categories provides information on the spread of participant responses relative to the MCID. Based on the literature to date, we hypothesized that high-volume HIIT will have more likely responders compared to MICT and low-volume HIIT/SIT.
MATERIALS AND METHODS
Participant Characteristics and
Recruiting
This study includes the initial results of a larger study (PREDICT-HIIT) examining genetic predictors for VO˙
2peak trainability
from HIIT/SIT and MICT interventions. Studies and potential participants were identified by contacts made through university affiliations (i.e., researchers involved in relevant studies). Studies were included if they met the following criteria: (1) participated in a HIIT, SIT, or MICT training study three or more weeks in duration within the last 15 years, (2) had an objective measure ofVO˙
2peak(indirect calorimetry from a graded exercise
test to volitional fatigue on a cycle ergometer or treadmill) before and after training, and (3) participant DNA collection was possible. Eligibility was open to male and female adults over the age of 18. Participants were included if they had greater than 80% attendance to the supervised protocol. Ethical approval was obtained from the various institutions and by the Bellberry ethical committee at the host institution (#2016-02-062-A-1).
High Intensity Interval Training (HIIT) and SIT were classified according to the intensity thresholds provided by
(Weston et al., 2014). High-volume HIIT was further defined
as≥15 min of high-intensity efforts in total during the session and low-volume HIIT was defined as<15 min of high-intensity efforts in total during the session. SIT was classified as repeats of<1 min above maximal efforts (per bout). MICT was defined as 30 min or more of continuous exercise at 64–76% maximum heart rate (HR max) or equivalent. For analysis purposes, low-volume HIIT and SIT studies were combined because their training loads were similar. Training loads were based on Edwards’ training impulse (TRIMP); time in each training heart rate zone multiplied by the relative weighting factor of exercise intensity (Edwards, 1993).
Data Analysis
Normality and homoscedasticity for VO˙ 2peak response were assessed using the Shapiro–Wilk and Levene’s tests. Data are presented as mean ± standard deviation where appropriate.
We used a paired sample t-test to calculate the group mean ˙
VO2peakresponse for high-volume HIIT, low-volume HIIT/SIT
and MICT. Effect sizes were based on Cohen’s d. We used an analysis of covariance (ANCOVA) to compare adjusted relative VO˙
2peak responses between high-volume HIIT,
low-volume HIIT/SIT and MICT. Values were adjusted for age, sex, individual study, duration of individual study, number of sessions each week, population group (e.g., coronary artery disease) and the average between pre and post-test scores (to avoid regression to the mean) (Barnett et al., 2015). The ANCOVA for absolute VO˙
2peak also included baseline weight
as a covariate. Ethnicity was not a common identifier across studies and therefore was not included as a covariate.Post hoc
testing used Tukey’s least significance difference test. A regression analysis determined the contribution of the covariates to the VO˙
2peak response. We used an analysis of variance
(ANOVA) to compare men and women group mean VO˙ 2peak responses within each intervention, and to compare VO˙
2peak responses between population groups. Statistical analyses were completed using SPSS (version 23.0, SPSS Inc., Chicago, IL, United States).
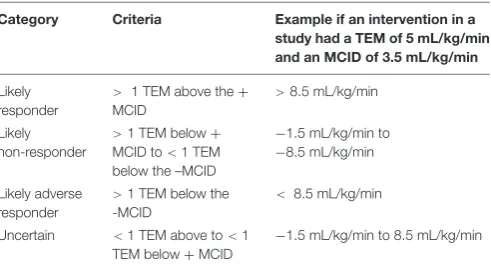
The thresholds for response categories used a combination of the TEM and the MCID. Categories included “likely responder”, “likely non-responder”, “likely adverse responder” and “uncertain”. Table 1 shows the categories illustrated with an example. Combining the MCID and TEM for the threshold improves the confidence in the “likely responder”/“non responder” classifications (e.g., compared to 2 TEM threshold
(Hecksteden et al., 2018)). The TEMs for each individual study
were first estimated by multiplying the mean baseline VO˙ 2peak value by a previously published coefficient of variation (CV) for VO˙
2peak of 5.6% (Katch et al., 1982). These were then
averaged to obtain the TEM for each group that was used in the calculation to categorize individuals. The use of a CV of 5.6% has been suggested by others (Hecksteden et al., 2018) and is more conservative than what has been previously used (3.5%) (Edgett et al., 2018). It has been demonstrated that as little as a 1 mL/kg/min can be clinically important in individuals with coronary artery disease (Keteyian et al., 2008). Despite this, we used 3.5 mL/kg/min as the MCID based on evidence that it is associated with a 10–25% decreased risk of all-cause mortality in studies with an approximate 10-year
TABLE 1 |Criteria for the responder categories with examples.
Category Criteria Example if an intervention in a
study had a TEM of 5 mL/kg/min and an MCID of 3.5 mL/kg/min
Likely responder
> 1 TEM above the+
MCID
>8.5 mL/kg/min
Likely non-responder
>1 TEM below+
MCID to<1 TEM below the –MCID
−1.5 mL/kg/min to
−8.5 mL/kg/min
Likely adverse responder
>1 TEM below the -MCID
< 8.5 mL/kg/min
Uncertain <1 TEM above to<1
TEM below+MCID
follow-up (Blair et al., 1995; Gulati et al., 2003; Myers et al.,
2011; Nes et al., 2014). A likely responder was considered
a VO2peak response of above one MCID plus the TEM.˙ Individual TEMs were calculated for each study resulting in different thresholds. These individual TEMs were averaged to provide a threshold for each training intervention (high-volume HIIT, low-volume HIIT/SIT and MICT). A likely responder for the high-volume HIIT group was above 5.3 mL/kg/min, low-volume HIIT/SIT group was 5.2 mL/kg/min and MICT group was 5.0 mL/kg/min. A comparison of likely responders between interventions was calculated using Medcalc statistical software, based on the “n-1” Chi-squared test (MedCalc,
2018).
RESULTS
In total, 677 participants across 18 studies from eight different universities provided data for this analysis (Table 2). These came from the University of Queensland, Australia (n= 191), Antwerp University and the Catholic University of Leuven, Belgium (n= 180), the Norwegian University of Science and Technology, Norway (n= 126), The Gene SMART cohort (PMID: 29143594) at Victoria University, Australia (n = 59), Queens University, Canada (n= 55), the University of British Columbia, Canada (n = 38), and the University of Texas Southwestern Medical Center, United States (n= 28).
Participants were from various populations including those with coronary artery disease (n= 256), type-2 diabetes (n= 73), the metabolic syndrome (n= 76), as well as individuals who were active and healthy (n= 118) and individuals middle-aged or over 75 years (n= 154). We collated data from females (n= 182) and males (n= 495). The mean age was 56.3±16.0 years.
Relative
VO
˙
2peakTable 3andFigure 1provide the changes in unadjusted relative
˙
VO2peak. Group mean relative VO˙ 2peak scores significantly
increased after all intervention types, with small effect sizes after high-volume HIIT (3.4 mL/kg/min, 95% CI 3.0 to 3.9 mL/kg/min,
P < 0.001) Cohen’s d = 0.3; MICT (2.5 mL/kg/min, 95% CI 2.1 to 3.0 mL/kg/min, P < 0.001) Cohen’s d = 0.3; and low-volume HIIT/SIT (2.0 mL/kg/min, 95% CI 1.5 to 2.5 mL/kg/min,
P < 0.001) Cohen’s d = 0.2. Table 4 presents the adjusted group means. A significant group difference (P = 0.01) was found with ANCOVA for relative VO˙ 2peak response between high-volume HIIT and MICT (0.84 mL/kg/min, 95% CI 0.2 to 1.5 mL/kg/min). There was no significant difference (P= 0.09) between high-volume HIIT and low-volume HIIT/SIT (0.78 mL/kg/min, 95% CI −0.13 to 1.67 mL/kg/min). There was no significant difference (P = 0.9) between MICT and low-volume HIIT/SIT (−0.06 mL/kg/min, 95% CI −0.89 to 1.02).
Absolute
VO
˙
2peak Absolute VO˙2peak values were significantly increased after all
intervention types (Table 4). There were small effect sizes
after high-volume HIIT (0.27 L/min, 95% CI −0.33 to – 0.23, P < 0.001) Cohen’s d = 0.3; MICT (0.19 L/min, 95% CI −0.24 to −0.12, P < 0.001) Cohen’s d = 0.2; and low-volume HIIT/SIT (0.16 L/min, 95% CI −0.22 to −0.10 to,
P < 0.001) Cohen’s d = 0.2. Table 4 presents the adjusted group means. Small significant group differences were found with ANCOVA for the change in absolute VO˙
2peak between
high-volume and low-high-volume HIIT/SIT (0.12 L/min, 95% CI 0.02 to 0.22 L/min,P<0.05) and between high-volume HIIT and MICT (0.09 mL/kg/min, 95% CI 0.02 to 0.17 L/min,P= 0.01). There was no significant difference (P= 0.61) between MICT and low-volume HIIT/SIT (−0.02 L/min, 95% CI−0.13 to 0.08 L/min).
Different Populations
There was a significant difference between the increases in men and women’s absoluteVO˙
2peakvalues in high-volume HIIT. Men
had a greater (P<0.01) increase (0.49 L/min, 95% CI 0.26 to 0.38) compared to women (0.15 L/min, 95% CI 0.09 to 0.21). There were no other significant differences between men and women’s relative and absolute VO˙
2peak responses to high-volume HIIT,
low-volume HIIT/SIT or MICT.
Table 5shows that when analyzed according to the population
type, middle-aged and elderly participants had a significantly greater (P<0.001) increase in relativeVO˙
2peakwith high-volume
HIIT than MICT. Young and healthy participants responded significantly more favorably (P<0.05) to MICT than low-volume HIIT/SIT and high-volume HIIT. Participants with coronary artery disease and middle-aged and elderly participants in the high-volume HIIT group had aVO˙ 2peak response greater than the MCID. Those with coronary artery disease and young and healthy participants also had a VO˙
2peak response greater than
the MCID with MICT. All other population groups and training interventions failed to reach the MCID.
Overall, the covariates examined (sex, age, individual study, study duration, sessions per week, population group and the average between pre and post-test scores) contributed to 17.3% of the change in relativeVO˙
2peak(P<0.001). Individual studies
had the largest impact, explaining 13.5% of VO˙
2peak response
(P<0.001).
Categories of
VO
˙
2peakResponders
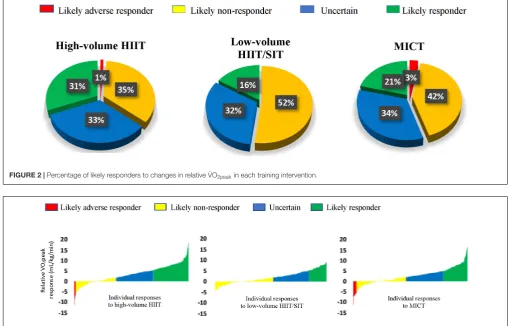
Table 3 andFigure 2 outlines the thresholds and percentages
of likely responders, likely non-responders, likely adverse responders and those uncertain (not classified as a likely responder or likely non-responder) for each training intervention, and the individual studies contributing to these training interventions. High-volume HIIT had significantly more likely responders (31%) compared to MICT (21%) and low-volume HIIT/SIT (16%),P<0.01. There were comparable responders classified as uncertain (∼33%) across high-volume HIIT, low-volume HIIT/SIT and MICT. On average, high-volume HIIT had a greater training load (∼100 Arbitrary Units (AU)) compared to low-volume HIIT/SIT (∼33 AU) and MICT (∼75 AU).
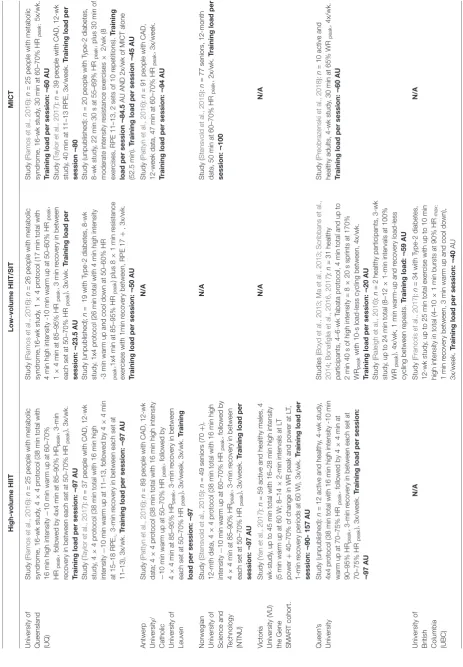
T ABLE 2 | Included studies for each intervention. High-volume HIIT Low-volume HIIT/SIT MICT University of Queensland (UQ) Study ( Ramos et al. , 2016 ): n = 25 people with metabolic syndr ome, 16-wk study , 4 × 4 pr otocol (38 min total with 16 min high intensity − 10 min warm up at 60–70% HR peak , followed by 4x4 min at 85–90% HR peak , 3-min recovery in between each set at 50–70% HR peak ), 3x/wk. T raining load per session: ¬ 97 AU Study ( Taylor et al. , 2017 ): n = 37 people with CAD, 12-wk study , 4 × 4 pr otocol (38 min total with 16 min high intensity − 10 min warm up at 11–13, followed by 4 × 4 min at 15–18 RPE, , 3-min recovery in between each set at 11–13), 3x/wk. T raining load per session: ¬ 97 AU Study ( Ramos et al. , 2016 ): n = 26 people with metabolic syndr ome,16-wk study , 1 × 4 pr otocol (17 min total with 4 min high intensity -10 min warm up at 50–60% HR peak , 1 × 4 min at 85–95% HR peak , 3 min recovery in between each set at 50–70% HR peak ), 3x/wk. T raining load per session: ¬ 23.5 AU Study (unpublished); n = 19 with Type-2 diabetes, 8-wk study , 1x4 pr otocol (26 min total with 4 min high intensity -3 min warm up and cool down at 50–60% HR peak ,1x4 min at 85–95% HR peak ) plus 8 × 1 min resistance exer cises with 1min recovery between, RPE 17 + , 3x/wk. T raining load per session: ¬ 50 AU Study ( Ramos et al. , 2016 ): n = 25 people with metabolic syndr ome, 16-wk study , 30 min at 60–70% HR peak ; 5x/wk. T raining load per session: ¬ 60 AU Study ( Taylor et al. , 2017 ): n = 39 people with CAD, 12-wk study , 40 min at 11–13 RPE, 3x/week. T raining load per session ¬ 80 Study (unpublished): n = 20 people with Type-2 diabetes, 8-wk study , 22 min 30 s at 55–69% HR peak , plus 30 min of moderate intensity resistance exer cises × 2/wk (8 exer cises, RPE 11–13, 2 sets of 10 repetitions). T raining load per session ¬ 84.5 AU AND 2x/wk of MICT alone (52.5 min). T raining load per session ¬ 45 AU
Antwerp University/ Catholic University
of Leuven Study ( Pattyn et al. , 2016 ): n = 89 people with CAD, 12-wk data; 4 × 4 pr otocol (38 min total with 16 min high intensity − 10 min warm up at 50–70% HR peak , followed by 4 × 4 min at 85–95% HR peak , 3-min recovery in between each set at 50–70% HR peak ), 3x/week, 3x/wk. T raining load per session: ¬ 97 N/A Study ( Pattyn et al. , 2016 ): n = 91 people with CAD, 12-week data, 47 min at 60–70% HR peak , 3x/week. T raining load per session: ¬ 94 AU Norwegian University of Science and Technology (NTNU) Study ( Stensvold et al. , 2015 ): n = 49 seniors (70 + ), 12-mth data, 4 × 4 pr otocol (38 min total with 16 min high intensity − 10 min warm up at 60–70% HR peak , followed by 4 × 4 min at 85–90% HR peak , 3-min recovery in between each set at 50–70% HR peak ), 3x/week. T raining load per session: ¬ 97 AU N/A Study ( Stensvold et al. , 2015 ): n = 77 seniors, 12-month data, 50 min at 60–70% HR peak , 2x/wk. T raining load per session: ¬ 100 V ictoria University (VU) the Gene SMAR T cohort. Study ( Y an et al. , 2017 ): n = 59 active and healthy males, 4 wk-study , up to 45 min total with 16–28 min high intensity (5 min warm up at 60 W ; 8–14 × 2-min intervals at LT power + 40–70% of change in WR peak and power at LT , 1-min recovery periods at 60 W), 3x/wk. T raining load per session: ¬ 90-157 AU N/A N/A Queen’ s University Study (unpublished): n = 12 active and healthy , 4-wk study , 4x4 pr otocol (38 min total with 16 min high intensity -10 min warm up at 70–75% HR peak , followed by 4 × 4 min at 90–95% HR peak , 3-min recovery in between each set at 70–75% HR peak ), 3x/week. T raining load per session: ¬ 97 AU Studies ( Boyd et al. , 2013 ; Ma et al. , 2013 ; Scribbans et al. , 2014 ; Bonafiglia et al. , 2016 , 2017 ): n = 31 healthy participants, 4–6-wk Tabata pr otocol, 4 min total and up to 2 min 40 s of high intensity = 8 × 20 s sprints at 170% WR peak with 10-s load-less cycling between, 4x/wk. T raining load per session: ¬ 20 AU Study ( Raleigh et al. , 2016 ): n = 2 healthy participants, 3-wk study , up to 24 min total (8–12 × 1-min intervals at 100% WR peak ), 4x/wk, 1 min warm-up and recovery load-less cycling between repeats. T raining load: ¬ 59 AU Study ( Pr eobrazenski et al. , 2018 ): n = 10 active and healthy adults, 4-wk study , 30 min at 65% WR peak , 4x/wk. T raining load per session: ¬ 60 AU University of
British Columbia (UBC)
T
ABLE
2
|
Continued
High-volume
HIIT
Low-volume
HIIT/SIT
MICT
Study
(
Forbes
et
al.
,
2017
):
n
=
4
healthy
females,
3-wk
study
,
3
sessions
each
wk,
up
to
25
min
in
total,
with
10
min
high
intensity
.
Session
1
=
30-sec
all-out
cycling
sprints
with
4
min
recovery
(pr
ogr
essing
fr
om
4
to
6
repeats).
T
raining
load
per
session
:
¬
32.5
AU
.
Session
2
=
6-s
all-out
sprints
with
24
sec
rest
(pr
ogr
ess
fr
om
10
to
20
repeats).
T
raining
load
per
session:
¬
10–20
AU.
S
ession
3
=
1
min
sprints
and
recovery
(pr
ogr
essing
fr
om
8
to
10
repeats).
High
intensity
intervals
=
85%
W
max
.
Recovery
intervals
=
15%
Wmax
.
T
raining
load
per
session:
¬
45
AU
University
of
Texas Southwester
n
Medical
Center
(UTSW)
Study
(
Howden
et
al.
,
2018
):
n
=
28
sedentary
middle-aged
men
and
women,
2-y
longitudinal
study
,
4
×
4
pr
otocol
∗up
to
2x/wk
in
first
6
mth
and
1/wk
maintenance.
T
raining
load
per
session:
¬
97
AU
.
Base
training,
30–60
min,
2
x/wk.
T
raining
load
per
session:
¬
60–120
AU.
MSS
lactate
training,
30
min,
1x/wk.
T
raining
load
per
session:
¬
120–150
AU
.
Recovery
training,
30
min,
1x/wk.
T
raining
load
per
session:
¬
60
AU.
Str
ength
training
1–2
days/wk.
N/A
N/A
Total
(n)
299
116
262
Numbers
(n),
percentage
(%),
heart
rate
(HR),
work
rate
(WR),
rating
of
perceived
exertion
(RPE),
maximal
steady
state
(MSS),
W
atts
(W),
lactate
threshold
(L
T)coronar
y
arter
y
disease
(CAD),
second
(s),
minutes
(min),
week
(wk),
months
(mth),
year
,
(y),
repetitions
(reps),
4
×
4
protocol
∗(38
min
total
with
16
min
high
intensity
–
10
min
warm
up
at
70–75%
HR
peak
,
followed
by
4
×
4
min
above
95%
HR
peak
,
3-min
recover
y
in
between
each
set
at
60–75%
HR
peak
).
T
abata
protocol
=
8
×
20
s
sprints
at
170%
WR
peak
with
10-s
load-less
cycling
between,
4x/wk.
T
raining
load
=
(time
in
each
training
zone
multiplied
by
relative
weighting
of
exercise
intensity),
arbitrar
y
units
(AU).
intervention was high-volume HIIT, low-volume HIIT/SIT or MICT (Boyd et al., 2013;Ma et al., 2013;Scribbans et al., 2014;
Bonafiglia et al., 2016, 2017;Raleigh et al., 2016;Yan et al., 2017).
Participants from the shorter duration studies were younger (mean - 23.1 years) and had a higherVO˙
2peak(44.4 mL/kg/min)
prior to the intervention (Stensvold et al., 2015;Howden et al., 2018). From the individual studies over 4 weeks in duration, the study (Howden et al., 2018) with the most likely responders (53%) had the greatest average training load per session (up to∼ 150 AU), the longest-running intervention (2 years) and the most training sessions each week (up to five). Most studies had three training sessions per week with 28% of participants classified as a likely responder (Stensvold et al., 2015;Pattyn et al., 2016;
Ramos et al., 2016;Forbes et al., 2017;Francois et al., 2017;Yan
et al., 2017). One study had two sessions each week, with 13%
of participants classified as a likely responder (Stensvold et al.,
2015).
Studies with middle-aged (50–60 years) and elderly participants (70+ years) had significantly (P < 0.001) more likely responders with high-volume HIIT (44% average) compared to MICT (13% average) (Stensvold et al., 2015;
Howden et al., 2018). Studies with coronary artery disease
participants had comparable likely responders with high-volume HIIT (38% average) and MICT (27% average),P= 0.06 (Pattyn
et al., 2016;Taylor et al., 2017). Those with metabolic syndrome
and/or type-2 diabetes (Ramos et al., 2016;Francois et al., 2017) had significantly more likely responders with high-volume HIIT (34% average) compared to low-volume HIIT/SIT (17% average) and MICT (8% average),P<0.001. Likely adverse responders were from studies with elderly participants; three participants came from a MICT intervention (Stensvold et al., 2015) and two participants came from a high-volume HIIT intervention
(Stensvold et al., 2015). Likely adverse responders also included
one participant with coronary artery disease from a high-volume HIIT intervention and two from a MICT intervention (Pattyn
et al., 2016), and one participant with metabolic syndrome from a
high-volume HIIT intervention and 1 from a MICT intervention
(Ramos et al., 2016).
DISCUSSION
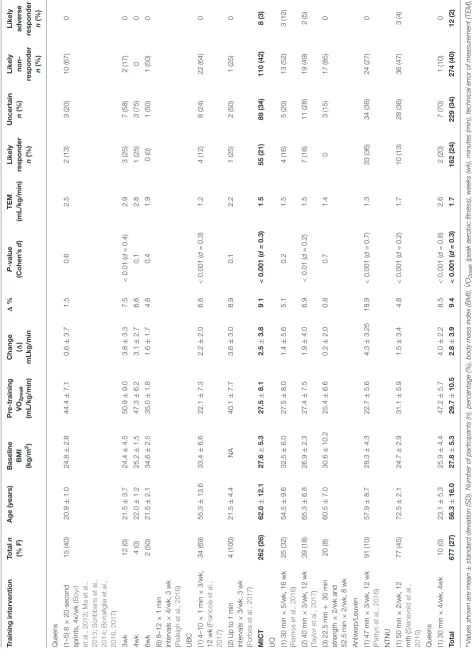
T ABLE 3 | Baseline and relative ˙VO 2 peak response for each individual study , as well as averages for all studies combined. T raining intervention T otal n (% F) Age (years) Baseline BMI (kg/m 2) Pr
e-training ˙VO
2 peak (mL/kg/min) Change ( 1 ) mLkg/min 1 % P -value (Cohen’ s d ) TEM (mL/kg/min) Likely responder n (%) Uncertain n (%) Likely non-responder n (%) Likely adverse responder n (%) High-volume HIIT total 299 (22) 54.3 ± 16.5 27.0 ± 4.4 31.4 ± 11.0 3.4 ± 4.2 10 . 8 < 0.001 ( d = 0.3) 1 . 8 92 (31) 98 (33) 105 (35) 4 (1) UQ (1) 4 × 4 × 3/wk, 16 wk ( Ramos et al. , 2016 ) 25 (52) 57 . 4 ± 1 . 8 32 . 4 ± 7 . 2 24 . 8 ± 5 . 0 2 . 9 ± 5 . 8 11 . 7 0.02 ( d = 0.5) 1.4 9 (36) 4 (16) 11 (44) 1 (4) (2) 4 × 4 × 3/wk, 12 wk ( Taylor et al. , 2017 ) 37 (14) 66 . 0 ± 6 . 7 28 . 7 ± 3 . 7 27 . 3 ± 5 . 7 2 . 6 ± 4 . 0 9 . 5 < 0.001 ( d = 0.4) 1.5 12 (32) 8 (22) 17 (46) 0
Antwerp/Leuven 4×
4 × 3/wk, 12-wk ( Pattyn et al. , 2016 ): 89 (8) 58 . 3 ± 10 . 0 28 . 0 ± 4 . 4 23 . 3 ± 5 . 9 4 . 9 ± 4 . 0 21 . 0 < 0.001 ( d = 0.7) 1.6 38 (43) 28 (32) 21 (24) 1 (1) NTNU (1) 4 × 4 × 3/wk, 1 year ( Stensvold et al. , 2015 ) 49 (39) 71 . 7 ± 1 . 8 25 . 3 ± 3 . 2 31 . 8 ± 6 . 7 3 . 9 ± 4 . 3 12 . 3 < 0.001 ( d = 0.6) 1.8 17 (35) 19 (39) 11 (22) 2 (4) VU (1) 8–14 × 2min × 3/wk, 4 wk ( Y an et al. , 2017 ) 59 (0) 31 . 0 ± 8 . 2 25 . 2 ± 3 . 2 46 . 7 ± 7 . 1 0 . 1 ± 2 . 7 0 . 2 0.053 2.6 0 20 (34) 39 (68) 0 Queen’ s (1) 4 × 4 × 3/wk, 3wk 12 (50) 22 . 0 ± 2 . 2 25 . 4 ± 4 . 9 46 . 7 ± 8 . 6 2 . 5 ± 2 . 6 5 . 3 < 0.01 ( d = 0.3) 2.6 1 (8) 7 (59) 4 (33) 0 UTS (1) 4 × 4 × 1/wk, base and recovery × 1–2/wk, MSS × 1/wk, str ength × 2/wk, 2 years ( Howden et al. , 2018 ) 28 (54) 53 . 5 ± 4 . 8 25 . 6 ± 3 . 0 28 . 8 ± 5 . 0 5 . 6 ± 2 . 9 19 . 4 < 0.001 ( d = 1.0) 1.6 15 (53) 10 (36) 3 (11) 0 Low-volume HIIT/SIT 116 (43) 48.1 ± 18.1 30.3 ± 6.6 30.6 ± 12.8 2.0 ± 2.9 6 . 5 < 0.001 ( d = 0.2) 1 . 7 18 (16) 37 (32) 61 (52) 0 UQ (1) 1 × 4, × 3/wk, 16 wk ( Ramos et al. , 2016 ) 26 (35) 57 . 1 ± 7 . 4 31 . 0 ± 5 . 2 26 . 5 ± 6 . 3 2 . 3 ± 2 . 7 8 . 7 < 0.001 ( d = 1.0) 1.5 3 (12) 10 (38) 13 (50) 0
(2) 1×
T ABLE 3 | Continued T raining intervention T otal n (% F) Age (years) Baseline BMI (kg/m 2) Pr
e-training ˙VO
FIGURE 1 |Mean relativeVO2peak˙ response following each training
intervention (raw data). Boxes contain the median (horizontal line), 25th and 75th percentile (bottom and top of box, respectively), the minimum and maximum response (bottom and top of whiskers). Individual “outliers” are dots above and below whiskers.
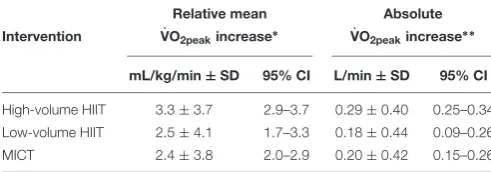
TABLE 4 |Adjusted means for absolute and relativeVO2peak˙ response.
Relative mean Absolute
Intervention VO2peak˙ increase∗ VO2peak˙ increase∗ ∗
mL/kg/min±SD 95% CI L/min±SD 95% CI
High-volume HIIT 3.3±3.7 2.9–3.7 0.29±0.40 0.25–0.34
Low-volume HIIT 2.5±4.1 1.7–3.3 0.18±0.44 0.09–0.26
MICT 2.4±3.8 2.0–2.9 0.20±0.42 0.15–0.26
∗
Adjusted for sex, age, individual study, study duration, sessions per week, population group and the average between pre and post-test scores.∗ ∗
Adjusted for sex, age, individual study, study duration, sessions per week, population group, baseline weight, and the average between pre and post-test scores and the pre weight.
between a variety of aerobic training interventions. Our study adds to the current literature by showing high-volume HIIT has significantly more likely responders compared to low-volume HIIT/SIT and MICT.
Meta-analyses have shown that high-volume HIIT is comparable, if not superior, to MICT for improving CRF (VO˙
2max/VO˙ 2peak) and other health biomarkers (Gist et al.,
2014;Weston et al., 2014;Milanovic et al., 2015;Ramos et al.,
2015; Batacan et al., 2017). The group mean changes from
this study were similar to previous research indicating that high-volume HIIT had a larger meanVO˙
2peakgain than MICT
and low-volume HIIT/SIT and studies with the greatestVO˙ 2peak gains used longer high intensity intervals/high-volume HIIT
(Bacon et al., 2013). Despite these group mean changes, there
was considerable heterogeneity in VO˙
2peak responses in each
intervention (Figure 3). An approach to assess whether the inter-individual training response is true that has gained much support involves comparing the adjusted standard deviations between the training group and a control comparator group
TABLE 5 |VO2peak˙ response in different population groups.
RelativeVO2peak˙
Population increase (mL/kg/min±SD)
High-volume Low-volume
HIIT HIIT/SIT MICT
Coronary artery disease 4.19±4.12 NA 3.59±3.66
Type II diabetes and/or metabolic syndrome
2.73±4.13 1.86±4.07 0.95±4.01
Middle-aged and elderly 4.50±3.93ˆ NA 1.50±3.36
Young and healthy 1.10±3.11∗ 2.28±3.53 4.02±2.23
Not assessed due to no participants (NA). Significantly different to MICT∗
P<0.05, ˆP<0.001.
(Atkinson and Batterham, 2015;Williamson et al., 2017). If the
standard deviation of the training group is clinically significant and larger than the control group, it can be assumed that a true individual response has occurred. Because our data did not include a control comparator group, we felt this approach was not warranted. Nonetheless, when looking at the standard deviation changes of the adjusted group means, they were all greater than the MCID (3.5 mL/kg/min). Overall, the number of “responders” for each intervention was slightly lower in comparison to previous reports (Scharhag-Rosenberger et al., 2012;Gurd et al.,
2016;Hecksteden et al., 2018). However, many studies to-date
have based thresholds for response on a percentage of change or one TEM away from zero; a lower threshold will produce more “responders” (Scharhag-Rosenberger et al., 2012; Gurd et al.,
2016;Hecksteden et al., 2018). Furthermore, these studies have
predominantly examined healthy but sedentary populations, whereas our data had a mix of clinical and healthy populations
(Timmons et al., 2010;Scharhag-Rosenberger et al., 2012;Gurd
et al., 2016; Hecksteden et al., 2018). For example, our data
demonstrated that participants with coronary artery disease and middle-aged and elderly participants in the high-volume HIIT group had a VO˙
2peak response greater than the MCID. Those
with coronary artery disease and young and healthy participants also had aVO˙ 2peakresponse greater than the MCID with MICT. All other population groups and training interventions failed to reach the MCID. Middle-aged adults and the elderly, participants with type II diabetes and/or metabolic syndrome had a greater proportion of responders with high-volume HIIT; whereas response rates between exercise training loads were similar in participants with coronary artery disease and those who were young and healthy. There were 4 participants from our data that were classified as “likely adverse responders”; rather than a true adverse response, these participants may have performed poorly on the testing day.
It has been argued that some people are “dose-sensitive” as opposed to a “non-responder” (Montero and Lundby, 2017;
Williamson et al., 2017). If physiological systems are maximized,
it seems possible that everyone can improve their VO˙ 2peak
(Bacon et al., 2013; Joyner, 2017;Montero and Lundby, 2017).
FIGURE 2 |Percentage of likely responders to changes in relativeVO2peak˙ in each training intervention.
FIGURE 3 |Waterfall plots of the relativeVO2peak˙ (mL/kg/min) response rates for each intervention (raw data).
the expression of genes related to mitochondrial function and energy use (Barres et al., 2012;Denham et al., 2015). Methylation can increase gene expression and affect metabolic adaptions in skeletal muscle (Barres et al., 2012). In skeletal muscle, most genes related to metabolism are demethylated following long-term exercise training (Voisin et al., 2014). These changes appear to be dose dependent and transient, with higher intensity exercise (80% heart rate maximum) causing greater demethylation and gene expression compared to lower-intensity exercise (40% heart rate maximum) where the total volume of exercise (caloric expenditure) is similar (Barres et al., 2012). To summarize, a higher training load may be more effective in those “dose sensitive” or those considered a “low responder” to training because participants are working at a threshold high enough to activate certain genes and molecular pathways required to induce a clinically meaningful exercise training response (Mann
et al., 2014). Our analysis demonstrated that studies with the
longest duration intervention and highest overall training loads produced the greatestVO˙ 2peakgains and more likely responders
(Stensvold et al., 2015;Pattyn et al., 2016;Howden et al., 2018).
Typically these studies included high-volume HIIT. Our results complement previous research that indicates a greater training load correlates with fewer non-responders. For example, a recent study on 78 young males found that when training was increased from 60 to 180 min to 240–300 min per week, the number
of responders (1× technical error of measurement relative to zero) increased from 30–71 to 100%, respectively, (Montero
and Lundby, 2017). It would be interesting to see if those who
were deemed a “likely non-responder” from our analysis would “respond” with an increase in training duration, frequency or intensity.
Our analysis showed that age, sex, the individual study, study duration, number of sessions each week, the population group and the average between pre and post-test scores predicted 17.3% of the variance in training response; with the individual study being the highest predictor (13.5%) forVO˙
2peakresponse.
This suggests there were other more substantial factors that affected VO˙
2peak trainability. In the HERITAGE study, 15%
of the variation in the response to MICT was attributed to baselineVO˙
2peak, age, sex, body mass and ethnicity combined;
with approximately 6% attributed to workload fluctuations, 20% to technical error and daily changes, and up to 50% to genetic make-up (Sarzynski et al., 2017). A systematic review from our group identified 97 genetic variants that have been associated with VO˙
2peak trainability (Williams et al., 2017).
It would be interesting to explore if those classified as a likely non-responder within our study have common genetic variants that may contribute to them being “dose sensitive”. This will be investigated in our PREDICT-HIIT Study by combining the
˙
Although there were several limitations to our study, the heterogeneity of the participants and training approaches should improve external ecological validity. Combining meaningful data from small, individual studies, as we have presented here, is necessary if we seek robust, reproducible, and translational results in exercise science (Eynon et al., 2017). Data was collated from 18 different studies with different protocols and equipment for testing. Participants were predominantly males, training status varied between studies (active vs. sedentary populations), and there was a mixture of clinical (CAD, diabetes, metabolic syndrome) and healthy populations. The age (between groups, 18–81 years), volume of work (60 min to 4 min and 50% heart rate peak to 170% work rate peak) and overall duration (3 to 104 weeks) varied considerably for the individual studies included in the current analysis. These factors are very likely to contribute to training response. Furthermore, some of the individual studies did not control for variables like diet, medication use, smoking status, sleep and recovery time. Lack of sleep or poor nutrition may negatively affect the intensity an individual can train and how fast they can recover between sessions; possibly combining to reduce training response through several interactions, such as genetic and epigenetic changes
(Timmons, 2011;Voisin et al., 2014;Hecksteden et al., 2015;Paul
et al., 2015;Yan et al., 2016). Our TEM was calculated using one
that has been previously published (Katch et al., 1982). A more robust approach is to measure an individual’sVO˙
2peakresponse
in a test-retest study (Hopkins, 2000) or with a time-matched control group. This information was not collected for each individual intervention from our study. We also acknowledge that our research focuses on several select studies and represents a small portion of MICT, HIIT and SIT related literature. Finally, adherence to the exercise training prescription has been found to impact on studies comparing HIIT to MICT (Pattyn et al., 2016;
Ellingsen et al., 2017). In these studies people allocated to the
HIIT group did not meet the target exercise intensities and those in the MICT group trained at a higher intensity. In our analysis we have not taken this into account and used an intention to treat analysis approach with the belief that it would be more externally valid.
Future research with cross-over designs will determine if a participant may have a better response to an alternative intervention. Such a design is costly and seldom used but potentially decreases the random variation that may occur from comparing just one pre and post-test score, and measures how an individual will respond to different training interventions
(Hecksteden et al., 2015). A recent cross over study (Bonafiglia
et al., 2016) compared the number of responders to SIT with
MICT. Participants (n = 21) had to complete four sessions a
week of SIT or MICT (separated by a 3-month washout period). Both interventions produced similar group mean changes in
˙
VO2peak, and similar rates of response (based on 2 × TEM).
Some individuals responded to MICT, but not to SIT and vice versa; whereas others did not improve their VO˙
2peak in either
intervention (Bonafiglia et al., 2016). Thus, those who fail to have a clinically meaningfulVO˙
2peakresponse to an exercise training
approach within our study may benefit from another form of training.
In conclusion, high-volume HIIT had a greater average training load and significantly more likely responders compared to low-volume HIIT/SIT and MICT. Individual studies with the smallest duration and training loads generally had the least significant gains and fewer clinically meaningful VO˙
2peak responders. Future large, well-controlled studies with comparator groups and cross-over designs may help to identify influential variables and the ideal training load forVO˙ 2peaktrainability.
DATA AVAILABILITY
The raw data supporting the conclusions of this manuscript will be made available by the authors, without undue reservation, to any qualified researcher.
AUTHOR CONTRIBUTIONS
CW, JC, and NE contributed to the conception and design of the study. CW organized the database and wrote the first draft of the manuscript. CW, SV, and ZL performed the statistical analysis. NH, IC, NH, JT, TG, JR, RF, JL, MF, BG, JB, CH, SS, SK, SJ, EVC, PB, VC, NP, EH, UW, AB, DS, DB, IP, and XY were investigators involved with the studies used in analysis and assisted with data collation. All authors contributed to manuscript revision, read, and approved the submitted version.
FUNDING
This research was made possible from the funding received through the Collaborative Research Network for Advancing Exercise & Sports Science (CRN-AEESS) – Bond University, Robina, Australia. The Gene SMART Study was partly supported by the Australian Research Council Discovery Early Career Research Award (ARC DECRA DE#140100864), and the National Health and Medical Research Council (NHMRC CDF # APP1140644) to NE.
REFERENCES
ACOS Medicine (2017).ACSM’s Guidelines for Exercise Testing and Prescription, 10 Edn. Alphen aan den Rijn: Wolters Kluwer, 480.
Astorino, T., and Schubert, M. (2014). Individual responses to completion of short-term and chronic interval training: a retrospective study.PLoS One9:e97638. doi: 10.1371/journal.pone.0097638
Atkinson, G., and Batterham, A. (2015). True and false interindividual differences in the physiological response to an intervention.Exp. Physiol.100, 577–588. doi: 10.1113/EP085070
Banister, E. W., Morton, R. H., and Fitz-Clarke, J. (1992). Dose/response effects of exercise modeled from training: physical and biochemical measures.Ann.
Physiol. Anthropol.11, 345–356. doi: 10.2114/ahs1983.11.345
Barnett, A. G., Van Der Pols, J. C., and Dobson, A. J. (2015). Correction to: regression to the mean: what it is and how to deal with it.Int. J. Epidemiol.
44:1748. doi: 10.1093/ije/dyv161
Barres, R., Yan, J., Egan, B., Treebak, J., Rasmussen, M., and Fritz, T. (2012). Acute exercise remodels promoter methylation in human skeletal muscle.Cell Metab.
15, 405–411. doi: 10.1016/j.cmet.2012.01.001
Bartlett, J. D., Close, G. L., MacLaren, D. P., Gregson, W., Drust, B., and Morton, J. P. (2011). High-intensity interval running is perceived to be more enjoyable than moderate-intensity continuous exercise: implications for exercise adherence.J. Sports Sci.29, 547–553. doi: 10.1080/02640414.2010. 545427
Batacan, RB Jr, Duncan, M. J., Dalbo, V. J., Tucker, P. S., and Fenning, A. S. (2017). Effects of high-intensity interval training on cardiometabolic health: a systematic review and meta-analysis of intervention studies.Br. J. Sports Med.
51, 494–503. doi: 10.1136/bjsports-2015-095841
Blair, S. N., Kohl, H. W. III, Barlow, C. E., Paffenbarger, R. S. Jr., Gibbons, L. W., and Macera, C. A. (1995). Changes in physical fitness and all-cause mortality. A prospective study of healthy and unhealthy men.JAMA273, 1093–1098. doi: 10.1001/jama.1995.03520380029031
Bonafiglia, J. T., Edgett, B. A., Baechler, B. L., Nelms, M. W., Simpson, C. A., Quadrilatero, J., et al. (2017). Acute upregulation of PGC-1αmRNA correlates with training-induced increases in SDH activity in human skeletal muscle.Appl.
Physiol. Nutr. Metab.42, 656–666. doi: 10.1139/apnm-2016-0463
Bonafiglia, J. T., Rotundo, M. P., Whittall, J. P., Scribbans, T. D., Graham, R. B., and Gurd, B. J. (2016). Inter-individual variability in the adaptive responses to endurance and sprint interval training: a randomised crossover study.PLoS One
11:e0167790. doi: 10.1371/journal.pone.0167790
Bouchard, C., An, P., Rice, T., Skinner, J., Wilmore, J., Gagnon, J., et al. (1999). Familial aggregation of VO(2max) response to exercise training: results from the HERITAGE family study.J. Appl. Physiol.87, 1003–1008. doi: 10.1152/jappl. 1999.87.3.1003
Bouchard, C., Antunes-Correa, L., Ashley, E., Franklin, N., Hwang, P., Mattsson, C., et al. (2015). Personalized preventive medicine: genetics and the response to regular exercise in preventive interventions.Prog. Cardiovasc. Dis.
57, 337–346. doi: 10.1016/j.pcad.2014.08.005
Boyd, C. J., Simpson, C. A., Jung, M. E., and Gurd, B. J. (2013). Reducing the intensity and volume of interval training diminishes cardiovascular adaptation but not mitochondrial biogenesis in overweight/obese men.PLoS One8:e68091. doi: 10.1371/journal.pone.0068091
Coombes, J. S., and Skinner, T. (2014).ESSA’s Student Manual for Health, Exercise
and Sport Assessment. Brisbane, QLD: Elsevier, 444.
Denham, J., O’Brien, B., Marques, F., and Charchar, F. (2015). Changes in the leukocyte methylome and its effect on cardiovascular-related genes after exercise.J. Appl. Physiol.118, 475–488. doi: 10.1152/japplphysiol.00878.2014 Edgett, B. A., Bonafiglia, J. T., Raleigh, J. P., Rotundo, M. P., Giles, M. D., Whittall,
J. P., et al. (2018). Reproducibility of peak oxygen consumption and the impact of test variability on classification of individual training responses in young recreationally active adults.Clin. Physiol. Funct. Imaging 38, 630–638. doi: 10.1111/cpf.12459
Edwards, S. (1993).High Performance Training and Racing.The Heart Rate Monitor Book. Sacramento: Feet Fleet Press.
Eigendorf, J., May, M., Friedrich, J., Engeli, S., Maassen, N., Gros, G., et al. (2018). High intensity high volume interval training improves endurance performance and induces a nearly complete slow-to-fast fiber transformation on the mRNA level.Front. Physiol.9:601. doi: 10.3389/fphys.2018.00601
Ellingsen, O., Halle, M., Conraads, V., Stoylen, A., Dalen, H., Delagardelle, C., et al. (2017). High-intensity interval training in patients with heart failure with reduced ejection fraction. Circulation 135, 839–849. doi: 10.1161/ CIRCULATIONAHA.116.022924
Eynon, N., Voisin, S., Lucia, A., Wang, G., and Pitsiladis, Y. (2017). Preface: genomics and biology of exercise is undergoing a paradigm shift. BMC
Genomics18(Suppl. 8):825. doi: 10.1186/s12864-017-4184-6
Forbes, S. C., Sletten, N., Durrer, C., Myette-Cote, E., Candow, D., and Little, J. P. (2017). Creatine monohydrate supplementation does not augment fitness, performance, or body composition adaptations in response to four weeks of
high-intensity interval training in young females.Int. J. Sport Nutr. Exerc.
Metab.27, 285–292. doi: 10.1123/ijsnem.2016-0129
Francois, M., Pistawka, K. J., Halperin, F. A., and Little, J. P. (2017). Cardiovascular benefits of combined interval training and post-exercise nutrition in type 2 diabetes. J. Diabet. Complicat. 32, 226–233. doi: 10.1016/j.jdiacomp.2017. 10.002
Gist, N. H., Fedew, M. V., Dishman, R. K., and Cureton, K. J. (2014). Sprint interval training effects on aerobic capacity: a systematic review and meta-analysis.
Sports Med.44, 269–279. doi: 10.1007/s40279-013-0115-0
Gulati, M., Pandey, D. K., Arnsdorf, M. F., Lauderdale, D. S., Thisted, R. A., Wicklund, R. H., et al. (2003). Exercise capacity and the risk of death in women: the St James Women Take Heart Project.Circulation108, 1554–1559. doi: 10.1161/01.CIR.0000091080.57509.E9
Gurd, B. J., Giles, M. D., Bonafiglia, J. T., Raleigh, J. P., Boyd, J. C., Ma, J. K., et al. (2016). Incidence of nonresponse and individual patterns of response following sprint interval training.Appl. Physiol. Nutr. Metab.41, 229–234. doi: 10.1139/apnm-2015-0449
Hecksteden, A., Kraushaar, J., Scharhag-Rosenberger, F., Theisen, D., Senn, S., and Meyer, T. (2015). Individual response to exercise training – a statistical perspective.J. Appl. Physiol.118, 1450–1459. doi: 10.1152/japplphysiol.00714. 2014
Hecksteden, A., Pitsch, W., Rosenberger, F., and Meyer, T. (2018). Repeated testing for the assessment of individual response to exercise training.J. Appl. Physiol.
124, 1567–1579. doi: 10.1152/japplphysiol.00896.2017
Hopkins, W. G. (2000). Measures of reliability in sports medicine and science.
Sports Med.30, 1–15. doi: 10.2165/00007256-200030010-00001
Hopkins, W. G. (2015). Individual responses made easy.J. Appl. Physiol.118, 1444–1446. doi: 10.1152/japplphysiol.00098.2015
Howden, E. J., Perhonen, M., Peshock, R. M., Zhang, R., Arbab-Zadeh, A., Adams-Huet, B., et al. (2015). Females have a blunted cardiovascular response to one year of intensive supervised endurance training.J. Appl. Physiol.119, 37–46. doi: 10.1152/japplphysiol.00092.2015
Howden, E. J., Sarma, S., Lawley, J. S., Opondo, M., Cornwell, W., Stoller, D., et al. (2018). Reversing the cardiac effects of sedentary aging in middle age-a randomized controlled trial: implications for heart failure prevention.
Circulation137, 1549–1560. doi: 10.1161/CIRCULATIONAHA.117.030617
Joyner, M. J. (2017). Exercise and trainability: contexts and consequences.J. Physiol.
595, 3239–3240. doi: 10.1113/JP274031
Jung, M. E., Bourne, J. E., and Little, J. P. (2014). Where does HIT fit? An examination of the affective response to high-intensity intervals in comparison to continuous moderate- and continuous vigorous-intensity exercise in the exercise intensity-affect continuum.PLoS One9:e114541. doi: 10.1371/journal. pone.0114541
Katch, V. L., Sady, S. S., and Freedson, P. (1982). Biological variability in maximum aerobic power.Med. Sci. Sports Exerc. 14, 21–25. doi: 10.1249/00005768-198201000-00004
Keteyian, S. J., Brawner, C. A., Savage, P. D., Ehrman, J. K., Schairer, J., Divine, G., et al. (2008). Peak aerobic capacity predicts prognosis in patients with coronary heart disease.Am. Heart J.156, 292–300. doi: 10.1016/j.ahj.2008.03.017 Levine, B. D. (2008).V(O(2),max): what do we know, and what do we still need to˙
know?J. Physiol.586(Pt 1), 25–34.
Ma, J. K., Scribbans, T. D., Edgett, B. A., Boyd, C., Simpson, C. A., Little, J. P., et al. (2013). Extremely low-volume, high intensity interval training improves exercise capacity and increases mitochondrial protein content in human skeletal muscle.Eur. J. Mol. Integr. Physiol.3, 202–210. doi: 10.4236/ojmip.2013.34027 Mann, T., Lamberts, R., and Lambert, M. (2014). High responders and low
responders: factors associated with individual variation in response to standardized training.Sports Med.44, 1113–1124. doi: 10.1007/s40279-014-0197-3
MedCalc (2018).MEDCALC: Easy to Use Statistical Software. Available at: https: //www.medcalc.org/calc/comparison_of_proportions.php
Milanovic, Z., Sporis, G., and Weston, M. (2015). Effectiveness of High-Intensity Interval Training (HIT) and continuous endurance training for VO2max improvements: a systematic review and meta-analysis of controlled trials.Sports Med.45, 1469–1481. doi: 10.1007/s40279-015-0365-0
Myers, J. (2003). Cardiology patient pages. Exercise and cardiovascular health.
Circulation107, e2–e5. doi: 10.1161/01.CIR.0000048890.59383.8D
Myers, J., Lata, K., Chowdhury, S., McAuley, P., Jain, N., and Froelicher, V. (2011). The obesity paradox and weight loss.Am. J. Med.124, 924–930. doi: 10.1016/j. amjmed.2011.04.018
Nes, B. M., Vatten, L. J., Nauman, J., Janszky, I., and Wisloff, U. (2014). A simple nonexercise model of cardiorespiratory fitness predicts long-term mortality.
Med. Sci. Sports Exerc.46, 1159–1165. doi: 10.1249/MSS.0000000000000219
Pattyn, N., Vanhees, L., Cornelissen, V. A., Coekelberghs, E., De Maeyer, C., Goetschalckx, K., et al. (2016). The long-term effects of a randomised trial comparing aerobic interval training versus continuous training in coronary artery disease: 1-year data from the SAINTEX-CAD study.Eur. J. Prev. Cardiol.
23, 1154–1164. doi: 10.1177/2047487316631200
Paul, B., Denmark-Wahnefried, W., Morrow, C., Salvador, C., Skibola, C., and Toolefsbol, T. (2015). Influences of diet and the gut microbiome on epigenetic modulation in cancer and other diseases.Clin. Epigenetics7:112. doi: 10.1186/ s13148-015-0144-7
Phillips, B., Kelly, B. M., Lija, M., Ponce-Gonzalez, J. G., Brogan, R. J., Morris, D. L., et al. (2017). A practical and time-efficient high-intensity interval training program modifies cardio-metabolic risk factors in adults with risk factors for type II diabetes.Front. Endocrinol.8:229. doi: 10.3389/fendo.2017.00229 Preobrazenski, N., Bonafiglia, J. T., Nelms, M. W., Lu, S., Robins, L., LeBlanc, C.,
et al. (2018). Does blood lactate predict the chronic adaptive response to training: a comparison of traditional and talk test prescription methods.Appl.
Physiol. Nutr. Metab.doi: 10.1139/apnm-2018-0343 [Epub ahead of print].
doi: 10.1139/apnm-2018-0343
Raleigh, J. P., Giles, M. D., Scribbans, T. D., Edgett, B. A., Sawula, L. J., Bonafiglia, J. T., et al. (2016). The impact of work-matched interval training on VO2peak and VO2 kinetics: diminishing returns with increasing intensity.Appl. Physiol.
Nutr. Metab.41, 706–713. doi: 10.1139/apnm-2015-0614
Ramos, J., Dalleck, L., Tjonna, A., Beetham, K., and Coombes, J. (2015). The impact of high-intensity interval training versus moderate-intensity continuous training on vascular function: a systematic review and meta-analysis.Sports Med.45, 679–692. doi: 10.1007/s40279-015-0321-z
Ramos, J. S., Dalleck, L. C., Borrani, F., Beetham, K. S., Wallen, M. P., Mallard, A. R., et al. (2017). Low-volume high-intensity interval training is sufficient to ameliorate the severity of metabolic syndrome.Metab. Syndrome Relat. Disord.
15, 319–328. doi: 10.1089/met.2017.0042
Ramos, J. S., Dalleck, L. C., Borrani, F., Mallard, A. R., Clark, B., Keating, S. E., et al. (2016). The effect of different volumes of high-intensity interval training on proinsulin in participants with the metabolic syndrome: randomised trial.
Dibetologia59, 2308–2320. doi: 10.1007/s00125-016-4064-7
Reljic, D., Wittmann, F., and Fischer, J. E. (2018). Effects of low-volume high-intensity interval training in a community setting: a pilot study.Eur. J. Appl.
physiol.118, 1153–1167. doi: 10.1007/s00421-018-3845-8
Ross, R., Blair, S. N., Arena, R., Church, T. S., Despres, J. P., Franklin, B. A., et al. (2016). Importance of assessing cardiorespiratory fitness in clinical practice: a case for fitness as a clinical vital sign: a scientific statement from the american heart association.Circulation134, e653–e699. doi: 10.1161/CIR. 0000000000000461
Sarzynski, M. A., Ghosh, S., and Bouchard, C. (2017). Genomic and transcriptomic predictors of response levels to endurance exercise training.J. Physiol.595, 2931–2939. doi: 10.1113/JP272559
Scharhag-Rosenberger, F., Walitzek, S., Kindermann, W., and Meyer, T. (2012). Differences in adaptations to 1 year of aerobic endurance training: individual
patterns of nonresponse.Scand. J. Med. Sci. Sports22, 113–118. doi: 10.1111/j. 1600-0838.2010.01139.x
Scribbans, T. D., Edgett, B. A., Vorobei, K., Mitchell, A. S., LIoanisse, S. D., Matusiak, J. B. L., et al. (2014). Fibre-specific response to endurance and low-volume high intensity interval training: striking similarities in acute and chronic adaptation.PLoS One9:e98119. doi: 10.1371/journal.pone.0098119
Stensvold, D., Viken, H., Rognmo, O., Skogvoll, E., Vatten, L. J., Coombes, J. S., et al. (2015). A randomised controlled study of the long-term effects of exercise training on mortality in elderly people: study protocol for the Generation 100 study.BMJ Open12:e007519. doi: 10.1136/bmjopen-2014-007519
Taylor, J., Keating, S. E., Leveritt, M. D., Holland, D. J., Gomersall, S. R., and Coombes, J. S. (2017). Study protocol for the FITR Heart Study: feasibility, safety, adherence, and efficacy of high intensity interval training in a hospital-initiated rehabilitation program for coronary heart disease.Contemp. Clin.
Trials Commun.8, 181–191. doi: 10.1016/j.conctc.2017.10.002
Timmons, J. A. (2011). Variability in training-induced skeletal muscle adaptation.
J. Appl. Physiol.110, 846–853. doi: 10.1152/japplphysiol.00934.2010
Timmons, J. A., Knudsen, S., Rankinen, T., Koch, L. G., Sarzynski, M., Jensen, T., et al. (2010). Using molecular classification to predict gains in maximal aerobic capacity following endurance exercise training in humans.J. Appl. Physiol.108, 1487–1496. doi: 10.1152/japplphysiol.01295.2009
Voisin, S., Eynon, N., and Bishop, D. (2014). Exercise training and DNA methylation in humans.Acta Physiol.213, 39–59. doi: 10.1111/apha.12414 Weston, K., Wisloff, U., and Coombes, J. (2014). High-intensity interval training
in patients with lifestyle-induced cardiometabolic disease: a systematic review and meta analysis.Br. J. Sorts Med.48, 1227–1234. doi: 10.1136/bjsports-2013-092576
WHO (2015). Chronic Diseases and Health Promotion: The World Health
Organisation. Available at: http://www.who.int/chp/en/
Williams, C. J., Williams, M. G., Eynon, N., Ashton, K. J., Little, J. P., Wisloff, U., et al. (2017). Genes to predict VO2max trainability: a systematic review.BMC
Genomics18:831. doi: 10.1186/s12864-017-4192-6
Williamson, P., Atkinson, G., and Batterham, A. (2017). Inter-individual responses of maximal oxygen uptake to exercise training: a critical review.Sports Med.47, 1501–1513. doi: 10.1007/s40279-017-0680-8
Yan, X., Eynon, N., Papadimitriou, I. D., Kuang, J., Munson, F., Tirosh, O., et al. (2017). The gene SMART study: method, study design, and preliminary findings.BMC Genomics18(Suppl. 8):821. doi: 10.1186/s12864-017-4186-4 Yan, X., Papadimitriou, I., Lidor, R., and Eynon, N. (2016). Nature versus nurture in
determining athletic ability.Med. Sport Sci.61, 15–28. doi: 10.1159/000445238
Conflict of Interest Statement: The authors declare that the research was conducted in the absence of any commercial or financial relationships that could be construed as a potential conflict of interest.