Modulation of endoplasmatic reticulum Ca
2+storage by Amyloid Precursor Protein and its
cleavage products
Thesis
Submitted for a Doctoral Degree in Natural Sciences
at the Department of Biology
Ludwig Maximilians University, Munich, Germany
Submitted by
Runa Hamid
From Bareilly, India
Modulation of endoplasmatic reticulum Ca
2+storage by Amyloid Precursor Protein and its
cleavage products
Dissertation
zur Erlangung des Doktorgrades
- Dr. rer. nat.-
des Fachbereichs Biologie
der Ludwig Maximilian Universität, München
Vorgelegt von
Runa Hamid
aus Bareilly, Indien
Declaration
I solemnly declare that this Dissertation is solely my own work and I have not taken any impermissible aid in completing it.
Ich versichere hiermit ehrenwörtlich, daß die Dissertation von mir selbständig, ohne unerlaubte beihilfe angefertigt ist.
Feodor-Lynen Str.23, 81377- Munich, Germany
First reviewer:
Prof. Dr. Elisabeth Weiss
Second reviewer:
PD Dr. Angelika Böttger
Supervisor:
Prof. Dr. Jochen Herms
Feodor-Lynen str.23
81377- München, Deutschland
Erstgutachter:
Prof. Dr. Elisabeth Weiss
Zweitgutachter:
PD Dr. Angelika Böttger
Sondergutachter:
Prof. Dr. Jochen Herms
With love
to
Table of Contents
Abbreviations and units... -1-
1 Summary ... 5
-2 Introduction... 7
-2.1 Alzheimer’s disease... 7
-2.2 Pathology of Alzheimer’s disease... 8
-2.2.1 Amyloid Plaques... 8
-2.2.2 Neurofibrillary tangles... 9
-2.3 Genetics of Alzheimer’s disease... 9
-2.3.1 The Presenilin ... 10
-2.3.2 The Amyloid Precursor Protein... 12
-2.3.2.1 Amyloid Precursor Protein gene... 12
-2.3.2.2 Amyloid Precursor Protein expression ... 12
-2.3.2.3 Amyloid Precursor Protein processing ... 13
-2.4 Cellular Ca2+ homeostasis ... 19
-2.4.1 “Ca2+ ON” mechanisms ... 20
-2.4.2 “Ca2+OFF” mechanisms ... 21
-2.5 Alzheimer’s disease and Ca2+ dyshomeostasis... 22
-2.5.1 Presenilins and Ca2+ dyshomeostasis ... 23
-2.5.2 Amyloid Precursor Protein and Ca2+ dyshomeostasis ... 24
-2.5.3 Mitochondrial dysfunction and Ca2+ homeostasis... 26
-3 Aim of the study... 30
-4 Materials ... 31
-4.1 Cell lines ... 31
-4.1.1 Human embryonic kidney cells (HEK293 cells) ... 31
-4.1.2 Human neuroglioma cells (H4 cells) ... 31
-4.1.3 Primary culture of mouse astrocytes ... 31
-4.2 Bacterial strain... 31
-4.3 Plasmids ... 32
-4.5 Filter sets ... 32
-4.6 Antibodies... 33
-4.7 Commercial kits ... 33
-4.8 Buffers ... 33
-4.8.1 Buffers for Ca2+ imaging ... 33
-4.8.2 Buffers for crude mitochondrial extraction ... 34
-4.8.3 Buffers for western blotting... 35
-4.8.4 Buffer for agarose gel electrophoresis... 36
-4.8.5 Growth medium for bacterial cultures ... 36
-4.9 Equipments... 37
-4.10 Chemicals... 38
-4.11 Other materials ... 39
-4.12 Softwares... 40
-5 Methods ... 41
-5.1 Cell culture... 41
-5.2 Preparation of primary culture of mouse astrocytes ... 41
-5.3 Freezing of mammalian cells ... 42
-5.4 Thawing of mammalian cells ... 42
-5.5 DNA isolation from rodent tails ... 42
-5.6 Genotyping ... 43
-5.7 Agarose gel electrophoresis ... 44
-5.8 Ca2+ Imaging... 44
-5.9 In vitro Ca2+ calibration ... 48
-5.10 Analysis of mitochondrial membrane potential ... 48
-5.11 Bioluminescent ATP assay ... 49
-5.12 Isolation of mitochondria from cultured cells... 49
-5.13 Bradford method of protein estimation... 50
-5.14 Western Blotting ... 51
-5.15 Preparation of electrocompetent cells... 51
-5.16 Electrotransformation... 52
-5.18 Transient transfection ... 53
-5.19 Statistical analysis ... 54
-6 Results... 55
-6.1 An enhanced cytosolic concentration of Ca2+ was observed in cells lacking APP or its Cterminal cleavage products. ... 55
-6.2 ER Ca2+ storage is modulated in cells lacking APP or its C-terminal cleavage products. ... 60
-6.3 Cells lacking AICD have decreased ATP production and enhanced mitochondrial membrane potential. ... 67
-6.4 The basal cytosolic free Ca2+ level was enhanced and ER Ca2+ was reduced on inhibition of oxidative phosphorylation ... 71
-6.5 Responses of cells lacking AICD were reversed on the application of Complex I and II substrates. ... 75
-6.6 AICD was not detected in isolated mitochondria. ... 78
-6.7 Responses of cells lacking AICD was reversed on application of Li2+... 80
-7 Discussion... 84
-7.1 AICD regulates cellular Ca2+ homeostasis... 84
-7.2 AICD regulates Ca2+ buffering by ER through mitochondrial ATP generation ... 85
-7.3 AICD might regulate Ca2+ homeostasis and mitochondrial function through gene transcription. ... 87
-7.4 AICD might regulate mitochondrial function directly ... 89
-7.5 AICD and Alzheimer’s Disease... 89
-7.6 Consequences of gamma secretase inhibitors as therapeutic drug targets for Alzheimer’s disease ... - 93 -
8 Literature ... - 94 -
Acknowledgements...-114-
Abbreviations and units
AA Amino acid
AD Alzheimer’s disease
ADAM a disintegrin and metalloprotease AICD APP intracellular domain
Aph-1 Anterior pharynx defective protein-1 APLP Amyloid precursor like protein APP Amyloid precursor protein App0/0 Amyloid precursor protein knockout APPs soluble APP
Aβ Amyloid beta peptide
BACE Beta site APP cleaving enzyme
BCIP 5-bromo-4-chlor-indolyl-phosphate BP1 APP binding protein 1
BSA Bovine serum albumin Ca2+ATPase Calcium ATPase
CCE Capacitative calcium entry CPA Cyclopiazonic acid
CSF Cerebrospinal fluid C-terminus Carboxyl terminus
CTFs Carboxy terminal fragments DMEM Dulbecco’s modified eagle’s medium
Dox Doxycycline
DTT Dithiothreitol
EDTA Ethylenediamine tetra aceticacid
EOFAD Early onset of familial Alzheimer’s disease ER Endoplasmatic reticulum
FAD Familial Alzheimer’s disease
GSK Glycogen synthase kinase H4 cells Human neuroglioma cells HBSS Hank’s basal salt solution Hek cells Human embryonic kidney cells ICD Intracellular domain
IDE Insulin degrading enzyme IP3 Inositol-1,4,5-triphosphate
IP3R Inositol-1,4,5-triphosphate receptor(s) KPI Kunitz protease inhibitor
LDL Low density lipids
MAP Microtubule associated protein NaCN Sodium cyanide
NBT Nitroblue tetrazolium chloride NFT Neurofibrillary tangles
NICD Notch intracellular domain PAT Protein interacting with APP tail PDL poly-D-lysine
PEN-2 Presenilin enhancer protein-2 PHF Paired helical fragment
PiP2 Phosphatidyl inositol-4,5-biphosphate
PLC Phospholipase C
PMCA Plasmamembrane calcium ATPase
PS1 Presenilin 1
PS2 Presenilin 2
ROCC Receptor operated calcium channels ROS Reactive oxygen species
RYR Ryanodine receptor
sAPPα soluble alpha APP ectodomain sAPPβ soluble beta APP ectodomain SDS Sodium dodecyl sulphate
SOCC Store operated calcium channel SR Sarcoendoplasmic reticulum
TACE Tumor necrosis factor alpha converting enzyme TBS Tris buffered saline
TGN trans-Golgi network
TMPD 2,3,5,6-tetramethyl-p-phenylenediamine
TNF Tumor necrosis factor
VOCC Voltage operated calcium channels VSV tag Vesicular somatitis virus tag
α-secretase alpha secretase
β-secretase beta secretase
γ-secretase gamma secretase
ε-secretase epsilon secretase
Units
µF microfarad
µg microgram
µl microlitre
µm micrometer
µM micromolar
bp base pair
cm centimeter
hrs hours
kb kilobase
kDa kilodalton
kV kilovolt
M molar (= moles per liter)
mA milliampere
mg milligram
MHz megahertz
ml milliliter
mm millimeter
mM millimolar
ng nanogram
nm nanometer
oC degree Celsius pmol picomole
rpm revolutions per minute v/v volume per volume w/v weight per volume x g relative centrifugal force
1 Summary
The work presented in this thesis is aimed to contribute to the understanding of the physiological role of APP and its underlying mechanism controlling the Ca2+ homeostasis. In addition, it aims to understand the pathophysiological role of Amyloid precursor protein (APP) and its cleavage products in Alzheimer’s disease (AD) particularly focussing on the disturbances in normal Ca2+ homeostasis resulting fromaltered APP processing. A central hypothesis to the pathogenesis of AD is that the accumulation of amyloid-β peptide (Aβ) and/or Aβ-containing plaques play an important role in the development of the disease. Mutations in APP, Presenilin 1 (PS1), or Presenilin 2 (PS2) are linked to the inherited forms of the disease and result in an increased production of Aβ, particularly of the Aβ42 isoform. Most mutations in APP, PS1, or PS2 that are associated with Familial Alzheimer’s Disease (FAD) alter the γ-secretase cleavage, resulting in increased levels of Aβ42 species and affecting the generation of corresponding C-terminal fragments (CTFs), for instance, the APP intracellular domain (AICD). Recently, several studies have indicated that not only altered production of Aβ42 affect neuronal survival, but also the CTFs, predominantly AICD, have a critical pathophysiological role by modulating neuronal Ca2+ homeostasis.
2 Introduction
2.1 Alzheimer’s disease
Age related impairment of memory and of cognitive functions, defined as ‘dementia’, is a brain disorder that seriously affects a person’s capability to carry out day to day activities. The most common form of dementia is ‘Alzheimer’s disease’, accounting for 60-80% of all dementia cases. This involves the part of brain that control thought, memory and language. AD affects 7-10% of individuals older than 65 years and up to 40% of persons older than 80 years (Evans et al., 1989). The word “Alzheimer’s” is named after a German doctor, Dr. Alois Alzheimer. In 1907, he described this condition in a 51 year old woman who died of an unusual mental illness showing impaired memory, orientation problems and disturbed behaviour (Alzheimer, 1907; Alzheimer et al., 1995). In the woman’s brain tissue he found abnormal clumps (now called neuritic or amyloid plaques) and tangled bundles of fibres (now called neurofibrillary tangles) (Fig 2.1).
Fig 2.1: Photograph of an original section of the first case described by Alois Alzheimer in 1907 (from the archives of Dept. of Neuropathology, Munich). Photograph shows a neurofibrillary tangle and the neuritic plaques.
Neuritic plaques Neurofibrillary
tangle Neuritic plaques Neurofibrillary
Today, these plaques and tangles in the brain are considered signs of Alzheimer’s disease. Early and objective diagnosis is however still impossible and only definitive by pathological diagnosis of the brain postmortem.
2.2 Pathology of Alzheimer’s disease
Clinically, the disease is initially characterized by subtle short-term memory problems and orientation disturbances. As the disease progresses, all higher cognitive functions become affected and the patients become completely dependent. The pathology of AD is restricted to the central nervous system and is pathologically characterized by the presence of extracellular senile amyloid plaques and intracellular neurofibrillary tangles. In addition, amyloid deposits in the walls of cerebral blood vessels (cerebral amyloid angiopathy), loss of neuronal cell bodies and synapses, as well as severe reactive astrogliosis can be observed.
2.2.1 Amyloid Plaques
amyloid core and, at most, only few or no neuritic processes. While both plaque types are found in the brains of non-demented old people, large number of neuritic plaques are only found in the brains of AD patients. Amyloid plaques are particularly abundant in the neocortex, the hippocampus, and the amygdale regions of the brain.
2.2.2 Neurofibrillary tangles
The second pathological hallmark in brain of AD patients is intracellular neurofibrillary tangles (NFT). The tangles consist mainly of paired helical filaments (PHF) of about 10 nm which are wound into helices. Some are straight filaments of about 15 nm interspersed with PHF. Extensive biochemical and immunological studies of these poorly soluble filaments demonstrated that the principal and probably the sole protein subunit is hyperphosphorylated protein Tau, a major neuronal microtubule-associated protein (MAP) (Kosik et al., 1986; Nukina and Ihara, 1986; Wood et al., 1986; Grundke-Iqbal et al., 1986a; Grundke-Iqbal et al., 1986b; Wischik et al., 1988; Lee et al., 1991).
In AD, about 95% of Tau filaments are in the form of PHF, while the remainder are straight filaments (Spillantini and Goedert, 1998). In normal brain, Tau protein binds to and stabilize microtubules, in contrast to PHF where Tau is unable to bind to microtubules.
2.3 Genetics of Alzheimer’s disease
Three genes have been identified associated with early onset of familial Alzheimer’s disease (EOFAD): the PS1, PS2 and APP genes located at chromosomes 14, 1, and 21 respectively (Hardy and Higgins, 1992; Hardy, 1997).
2.3.1 The Presenilin
Mammalian PS1 and PS2 are evolutionary conserved integral membrane proteins with a molecular weight of 50 kDa, each is predicted to traverse the membrane 6-10 times. The amino and carboxyl termini are both oriented towards the cytoplasm (Hutton and Hardy, 1997). Endoproteolytic cleavage generates two fragments that remain associated. The presenilin holoproteins and their endoproteolytically cleaved fragments are components of high molecular weight protein complexes that reside in the ER and the Golgi apparatus (Annaert et al., 1999). The amino acid sequence identity between PS1 and PS2 is approximately 60% as a whole and about 90% within the transmembrane domain. Human PS1
and PS2 express distinctly in human tissue. PS1 is transcribed uniformly throughout the brain and peripheral tissue. On the other hand, PS2 is transcribed at relatively low levels in the brain, except for the high levels in corpus callosum. It is highly expressed in some peripheral tissue, such as pancreas, heart, and skeletal muscle (Rogaev et al., 1997). It has been well established that presenilins are required for the γ-secretase cleavage of APP to generate Aβ and AICD and also for the S3 cleavage of Notch family receptors generating notch intracellular domain (NICD) (Kopan and Goate, 2000). Presenilins are important components of γ-secretase assembly along with other components: Nicastrin, aph-1 and Pen-2 (see below).
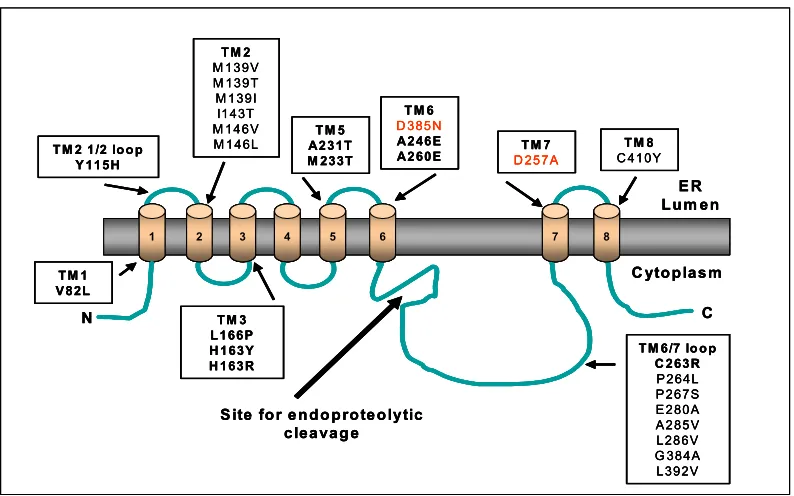
the important mutations identified are of two highly conserved aspartate residues in the transmembrane domains 6 and 7 of PS1 (Asp257 and Asp385). These mutations inhibit the biological function of presenilin required for γ-secretase activity (Wolfe et al., 1999). It has beenshown that PS1 D385N mutation acts like a dominant negative mutation (Steiner et al., 1999b). Both aspartate residues at 257 and 385 are supposed to form the catalytic centre of the γ-secretase complex (Edbauer et al., 2003; Iwatsubo, 2004). PS1 with A257 and A385 mutations integrate poorly into the heteromeric complex of γ-secretase, raising the possibility that these transmembrane domain mutations disable PS1 structurally (Yu et al., 2000a).
Fig 2.2: Schematic representation of PS1 showing eight transmembrane domains (TM). The boxes indicate some of the mutations identified in various regions of PS1. Mutations of two highly conserved aspartate residues (shown in red) in the transmembrane domain 6 and 7 inactivate
γ-secretase activity and reduce Aβ and AICD generation (Diagram is compiled from the
information in Steiner and Haass, 2000and Tandon and Fraser, 2002)
E R Lum en
C ytoplasm
1 2 3 4 5 6 7 8
N C
T M 2 M 139V M 139T M 139I I143T M 146V M 146L T M 2 1/2 lo o p
Y 115H
T M 3 L 166P H 163Y H 163R
T M 5 A231T M 233T
T M 6 D 385N A2 46E
A2 60E D 257AT M 7 C 410YT M 8
T M 6/7 lo o p C 263R P 264L P 267S E 280A A 285V L286V G 384A L392V T M 1
V 82L
S ite for endo proteolytic cleavag e
E R Lum en
C ytoplasm
1 2 3 4 5 6 7 8
N C
T M 2 M 139V M 139T M 139I I143T M 146V M 146L T M 2 1/2 lo o p
Y 115H
T M 3 L 166P H 163Y H 163R
T M 5 A231T M 233T
T M 6 D 385N A2 46E
A2 60E D 257AT M 7 C 410YT M 8
T M 6/7 lo o p C 263R P 264L P 267S E 280A A 285V L286V G 384A L392V T M 1
V 82L
S ite for endo proteolytic cleavag e
E R Lum en
C ytoplasm
1 2 3 4 5 6 7 8
11 22 33 44 55 66 77 88
N C
T M 2 M 139V M 139T M 139I I143T M 146V M 146L T M 2 1/2 lo o p
Y 115H
T M 3 L 166P H 163Y H 163R
T M 5 A231T M 233T
T M 6 D 385N A2 46E
A2 60E D 257AT M 7 C 410YT M 8
T M 6/7 lo o p C 263R P 264L P 267S E 280A A 285V L286V G 384A L392V T M 1
V 82L
2.3.2 The Amyloid Precursor Protein 2.3.2.1 Amyloid Precursor Protein gene
The human APP gene is 400 kb located in the mid portion of the long arm of chromosome 21 (Tanzi et al., 1987; Goldgaber et al., 1987). The amino acid (AA) sequence deduced from the APP cDNA predicted a large precursor of 695 AA, with a single hydrophobic stretch near its carboxyl terminal, containing properties of a membrane spanning domain, a 17 residue signal peptide for transport into ER and two consensus sequences for N-glycosylation in the large ectodomain (Kang et al., 1987). The APP gene consist of 18 exons and is alternatively spliced to generate at least 10 different APP variants (Octave, 1995). The three major spliced variants are APP770 when all exons are present, while APP751
lacks exon 8 and APP695 lacks exon 7 and 8.
2.3.2.2 Amyloid Precursor Protein expression
From the early stages of embryonic development, APP mRNA is detectable in most tissues (Fisher et al., 1991; Lorent et al., 1995). APP is widely expressed throughout the body with particularly high expression in brain and kidney. Expression of APP in a variety of cell types, ranging from neurons to glial cells, platelets, endothelial cells, epithelial cells and fibroblasts, suggest an important role for APP in fundamental cellular processes (Arai et al., 1991; Forloni et al., 1992; Mattson, 1997),
APP is evolutionarly conserved and detected in a variety of mammals. Homologous proteins have also been identified in lower organisms, including
proteins are processed in a similar way leading to the secretion of large ectodomains. The expression of APLP2 overlaps largely with that of APP, whereas APLP1 is primarily expressed in the nervous system. The APLPs do not contain Aβ-like sequence (Wasco et al., 1993; Zhong et al., 1996), therefore do not seem to play a role in AD.
2.3.2.3 Amyloid Precursor Protein processing
APP is cotranslationally translocated into the ER by its signal peptide and matures through the central secretory pathway, with only a small percentage of holoproteins reaching the cell surface where it is acted upon by different secretases and is cleaved. About 23 AA hydrophobic stretch near its C-terminal region serves as an anchor in internal membranes (ER, Golgi, trans-Golgi network, endosome and in plasmalemma.)
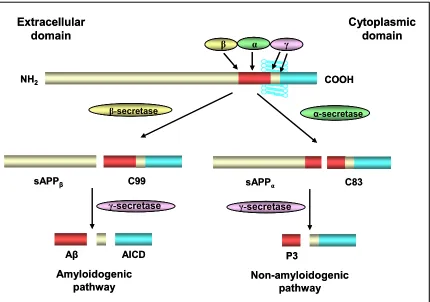
Fig 2.3: Schematic representation of the proteolytic processing of APP. APP undergoes two
endoproteolytic pathways that either preclude the formation of Aβ (Non-amyloidogenic pathway)
or cause the formation of Aβ (Amyloidogenic pathway). In non-amyloidogenic pathway cleavage
by α-secretase occurs within the Aβ domain (between residues 16 and 17 of Aβ sequence,
shown in red). This results in the release of soluble N-terminus sAPPα and a membrane
anchored C-terminus named as C83 fragment. α-secretase cleavage is followed by γ-secretase
cleavage to liberate the P3 peptide. In amyloidogenic pathway, APP is first cleaved by β
-secretase at the N-terminus region of the Aβ sequence. This cleavage generates a slightly
shorter soluble N-terminus sAPPβ fragment and a membrane anchored C-terminus fragment
named as C99. Cleavage by β-secretase is followed by γ-secretase that occurs first at the
recently elucidated ε-site within the transmembrane domain liberating 50 AA fragment known as
APP intracellular domain (AICD) and then at the γ-secretase site after residue 40 or 42 of Aβ
domain to liberate Aβ40 or Aβ42.
Non-amyloidogenic pathway
APP is synthesized as an integral membrane protein, and becomes N- and O- glycosylated, sulphated, phosphorylated and endoproteolytically processed during its transit from ER to the cell surface. In the non amyloidogenic pathway, APP is predominantly cleaved by α-secretase, between amino acid 16 and 17 of
COOH NH2
β α γ
α-secretase
sAPPα C83
γ-secretase
P3
Non-amyloidogenic pathway
β-secretase
sAPPβ C99
γ-secretase
Aβ AICD
Amyloidogenic pathway
Extracellular domain
Cytoplasmic domain
COOH
NH2 COOH
NH2
βββ ααα γγγ
α-secretase
α-secretase
sAPPα C83
γ-secretase
γ-secretase
P3 P3
Non-amyloidogenic pathway
β-secretase
β-secretase
sAPPβ C99
γ-secretase
γ-secretase
Aβ AICD
Amyloidogenic pathway
Extracellular domain
the amyloid region, precluding the formation of Aβ-peptide (Fig 2.3) (Anderson et al., 1991; Wang et al., 1991; Zhong et al., 1994). This cleavage results in the release of the large soluble fragment of APP (100-120 kDa), named as sAPPα, and the generation of a truncated membrane anchored C-terminal fragment of about 10 kDa named as α-stub or C83 fragment (Weidemann et al., 1989; Schubert et al., 1989; Esch et al., 1990; Sisodia et al., 1990). α-secretase cleavage occurs intracellularly, predominantly after N- and O-glycosylation and sulphation, in a late compartment of the secretory pathway as well as at the plasma membrane. The 10 kDa C-terminal fragment is further processed to generate a secreted P3 peptide, by γ-secretase cleavage, which has been hypothesized to occur in early endosomes (Haass and Selkoe, 1993; Checler, 1995; Selkoe, 1998). The biological significance of P3 and its role, in amyloidogenesis, if any, remains obscure. As cleavage of APP by α-secretase destroys the Aβ sequence, it is generally thought that the α-secretase pathway extenuate amyloid formation, although this has not been demonstrated clearly. In addition, the C-terminally truncated form of APP released by α-secretase may have trophic actions (Small, 1998) which could antagonize the neurotoxic effects of aggregated Aβ (Mok et al., 2000). Most recently two members of ADAM (a disintegrin and metalloprotease) family, tumor necrosis factor-α (TNF-α) converting enzyme (TACE or ADAM-17) and ADAM-10, are reported as most interesting candidate for α-secretases (Buxbaum et al., 1998; Lammich et al., 1999).
Amyloidogenic pathway
Since the first proteolytic processing event defined for APP was “normal”
(Seubert et al., 1992; Shoji et al., 1992; Haass et al., 1992b; Busciglio et al., 1993). Subsequent extensive biochemical analysis demonstrated that Aβ is generated by endoproteolytic cleavage of APP by β-secretase followed by γ -secretase (Fig 2.3) (Haass and Selkoe, 1993). β-secretase cleavage of APP releases a truncated soluble ectodomain of APP, named sAPPβ (Seubert et al., 1993) and generates a membrane retained amyloidogenic C-terminal fragment of about 12 kDa, named as β-stubs or C99 fragments. C99 fragments are further processed by γ-secretase to generate Aβ peptides of varying lengths i.e. between 40 and 42 AA and a residual C-terminal fragment of nearly 7 kDa, named as AICD (APP intracellular domain) (Fig 2.3).
The subcellular compartment of Aβ generation is still not clearly identified. However, an approximate localization can be established by defining where one can detect their respective cleavage products i.e. sAPPβ, C99 and the amyloid peptides Aβ40 and Aβ42. Generation of Aβ-peptides was observed to be dependent on re-internalization of cell surface APP that escapes α-secretase cleavage. This was evidenced most clearly by the detection of radio-iodinated Aβ, following reinternalization of radio-iodinated cell surface APP (Koo and Squazzo, 1994). The internalization of APP is believed to employ the cytoplasmic domain of APP which contains a YENPTY signal mediating endocytosis of APP. The cells lacking this domain of APP show decreased Aβ formation (Golde et al., 1992; Haass et al., 1993; Lai et al., 1995). Moreover, agents interfering with the acidification of subcellular compartments, i.e. ammonium chloride and chloroquine, inhibit the production of Aβ (Shoji et al., 1992; Haass et al., 1993). This implies that Aβ is generated in an acidic compartment following endocytosis, which could be congruent with early endosomes. Since, Aβ formation was not completely abolished by inhibition of reinternalization of APP, an additional pathway independent of APP reinternalization might exist.
neuronal ER while the trans-Golgi network (TGN) was found to be the site for Aβ40 generation (Hartmann et al., 1997; Cook et al., 1997).
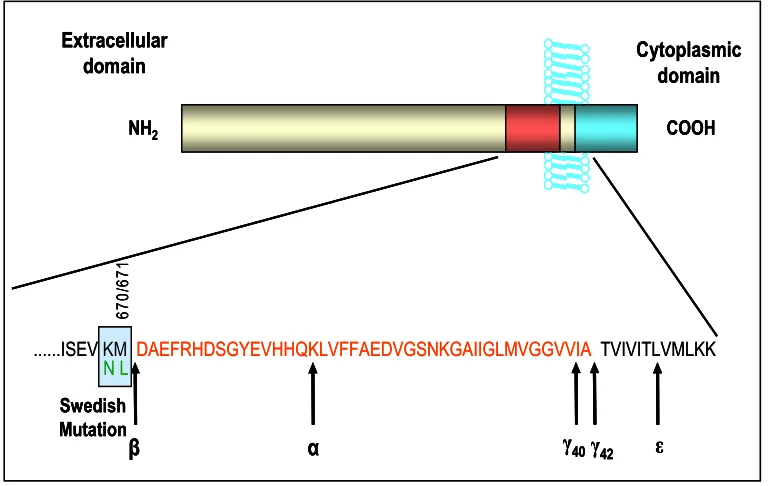
In contrast to α- and γ-secretases, β-secretase appears to be a sequence specific endoprotease (Citron et al., 1995). Radio sequencing demonstrates that Aβ isolated from amyloid plaques and cell lines, predominantly begins at the Asp +1 residue of Aβ (Gouras et al., 1998; Cai et al., 2001). Interestingly, a mutation in APP called Swedish mutation (so called because it was discovered in a Swedish family) is located near the β-secretase cleavage site causes FAD. This mutation is double mutation which involves amino acid substitution of Lys-MetÆAsnLeu and is located immediately N-terminal to the β-secretase cleavage start site (Asp) of APP (Fig 2.4). The expression of this mutant causes APP to be a much better substrate for β-secretase and dramatically increases secretion of Aβ starting at Asp+1 (Citron et al., 1992; Cai et al., 1993) .
Fig 2.4: The sequence of APP containing the Aβ domain (shown in red) and transmembrane region is expanded and shown as single letter amino acid code. The shaded vertical box
indicates the Swedish double mutation which is located immediately N-terminus to the β
-secretase cleavage start site. The normal cleavage site of β, α, γ, ε-secretases are indicated by arrows.
COOH NH2
Cytoplasmic domain Extracellular
domain
β α γ40γ42 ε
670/
671
Swedish Mutation N L
...ISEV KM DAEFRHDSGYEVHHQKLVFFAEDVGSNKGAIIGLMVGGVVIA TVIVITLVMLKK
COOH NH2
Cytoplasmic domain Extracellular
domain
β α γ40γ42 ε
670/
671
Swedish Mutation N L
COOH NH2
Cytoplasmic domain Extracellular
domain
β α γ40γ42 ε
670/
671
Swedish Mutation N L
β-secretase activity in cells efficiently cleaves only membrane bound APP. On the other hand, transfection of APP constructs lacking the transmembrane domain are not cleaved by β-secretase (Citron et al., 1992). This implies that
β-secretase is likely to be a membrane bound protease or, alternatively, it could be tightly associated with a membrane protein. β-secretase shows maximal activity at acidic pH, since agents that disrupt intracellular pH also inhibit
β-secretase activity (Haass et al., 1993; Knops et al., 1995; Haass et al., 1995a). Moreover, β-secretase activity is highest in the acidic subcellular compartments of the secretory pathway, including the golgi apparatus and endosomes (Koo and Squazzo, 1994; Haass et al., 1995b). These data suggest that the active site of
β-secretase is located within the lumen of acidic intracellular compartments. Recently, a most interesting candidate for β-secretase called β-site APP cleaving enzyme 1 (BACE1, also called Asp2 and memapsin2), a novel transmembrane aspartic protease has been identified by four independent groups. BACE 1 exhibits all the properties of β-secretase and as a key enzyme that initiates the formation of Aβ (Hussain et al., 1999; Sinha et al., 1999; Vassar et al., 1999; Yan et al., 1999).
Cleavage by γ-secretase takes place at multiple sites in C99 fragments, generating Aβ molecule that ends at amino acids 38, 39, 40, 42 or 43 of the Aβ
domain. However the most abundant species found in vivo are Aβ40 and Aβ42. Among these Aβ42 is the most amyloidogenic form. Cell based systems that have been used to characterize γ-secretase generate 80-90% Aβ40 and 10-20% Aβ42, consistent with the ratio found in plasma and cerebrospinal fluid of humans (Mehta et al., 2001; Ertekin-Taner et al., 2001). Mutations in APP, PS1 and PS2
presenilins are closely related to γ-secretase activity. The first evidence is given by the fact that FAD linked mutations of presenilins shifted the preferred site of
γ-cleavage from position 40 to 42 of Aβ. Secondly, γ-secretase activity is diminished in cells derived from PS1 knockout mouse (De Strooper et al., 1998). Thirdly, substitution of either of the two aspartate residues in the 6 and 7 transmembrane domains of PS1 (D257 and D385) abolished γ-secretase activity (Steiner et al., 1999a; Wolfe et al., 1999; Kimberly et al., 2000). Despite of the strong evidence, presenilin alone is not sufficient for the secretase activity as it’s overexpression does not increase the γ-secretase activity. Other cofactors that were identified for γ-secretase activity are nicastrin, Aph-1 and PEN-2 (Yu et al., 2000b; Goutte et al., 2002; Francis et al., 2002). RNAi of each of the four fragments (PS, nicastrin, Aph-1 and PEN-2) in drosophila Schneider (S2) cells and in mammalian cells disrupts γ-secretase activity (Steiner et al., 2002; Edbauer et al., 2002b; Kimberly et al., 2003). Subsequently, it was also reconfirmed that expression of these four proteins in yeast, which lacks endogenous γ-secretase activity, reconstitute γ-secretase activity (Edbauer et al., 2003). However, recent studies by two independent groups show that all components of γ-secretase are assembled in early compartments of the secretory pathway and that this complex is transported to late compartments in which substrates (e.g. APP or Nicastrin) are encountered and subsequently processed within respective transmembrane segments (Kim et al., 2004; Capell et al., 2005).
2.4 Cellular Ca2+ homeostasis
mechanisms depending on whether they serve to increase or decrease cytosolic Ca2+ concentration (Berridge et al., 2000) (Fig 2.5).
Fig 2.5: Cells maintain Ca2+ signaling by regulating influx of Ca2+ into the cell from the extracellular medium (1.8 mM) or by its release from the intracellular stores. At rest cytosolic Ca2+
levels are maintained at levels ranging between 20 to 100 nM. The Ca2+ concentration in the
lumen of ER ranges between 10-200 µM. Ca2+ release from ER occurs through either IP3
receptors or ryanodine receptors. On the other hand cell regulates Ca2+ entry from the
extracellular medium through different type of channels on the plasma membrane; Voltage gated
calcium channels or Store operated calcium channels. Ca2+ efflux from the cytosol occurs through
plasma membrane calcium ATPase in an ATP dependent manner. The cytosolic Ca2+ load is also
replenished back into the ER by ATP dependent sarco-endoplasmic Calcium ATPase pump
(SERCA). Mitochondria are also known to buffer cytosolic Ca2+ in low amounts aided by a
uniporter. The Ca2+ efflux from mitochondria occurs through Na+/ Ca2+ exchanger.
2.4.1 “Ca2+ ON” mechanisms
The “Ca2+ ON“ mechanisms include channels that aid to increase cytosolic Ca2+. Some of these channels are located at the plasma membrane and regulate the supply of Ca2+ from the extracellular space where Ca2+ concentration is about 1.8 mM. Other channels regulate the release of Ca2+ from intracellular stores into the cytosol, for instance channels on ER membrane.
Store operated calcium channels
Voltage gated
calcium channels calcium ATPase pum pPlasm a m em brane
S E R C A pum p C a2+
C a2+ C a2+
C a2+
C a2+
C a2+
M itocho ndria [C a2+]
i = 20-100 nM
[C a2+]
i = 1.8 m M
C ytosol
Plasm a m em brane
ATP C a2+
InsP3R R yR
E ndoplasm ic R eticulum [C a2+]
i= 10-200 µM
N a+/Ca2+
exchanger
U niporter
Store operated calcium channels
Voltage gated
calcium channels calcium ATPase pum pPlasm a m em brane
S E R C A pum p C a2+
C a2+ C a2+
C a2+
C a2+
C a2+
M itocho ndria [C a2+]
i = 20-100 nM
[C a2+]
i = 1.8 m M
C ytosol
Plasm a m em brane
ATP ATP C a2+
InsP3R R yR
E ndoplasm ic R eticulum [C a2+]
i= 10-200 µM
N a+/Ca2+
exchanger
Channels on the plasma membrane include Voltage operated calcium channels
(VOCC), receptor-operated calcium channels (ROCCs) and store operated calcium channel (SOCCs) (Fig 2.5). VOCCs are largely expressed by excitable cell types such as neuronal and muscle cells, where they are activated by depolarization of the plasma membrane. ROCCs are activated by the binding of an agonist like glutamate, ATP or acetylcholine to the extracellular domain of the channel. SOCCs are activated in response to depletion of the intracellular Ca2+ store either by physiological Ca2+ mobilizing messengers or pharmacological agents. This mechanism is termed as “Capacitative Calcium Entry (CCE)”
(Putney, Jr., 1986). CCE is a normal physiological phenomenon taking place predominantly in non-excitable cells. Recent reports have indicated that this phenomenon also plays an important physiological role in many, but not all excitable cells where it functions in the generation of cytoplasmic Ca2+ signals with cell specific functions (Antaramian et al., 2001). The mechanism by which the SOCCs sense the filling status of the intracellular pool is still unknown.
Ca2+ release from the ER occurs through two types of Ca2+ channels: inositol-1,4,5-triphosphate receptors (IP3Rs) and ryanodine receptors (RyRs) (Fig 2.5). Release through IP3Rs requires the activation of G protein on the cell surface that induce phospholipase C (PLC) to cleave phosphatidylinositol-4,5-biphosphate (PiP2) into diacylglycerol and IP3. IP3 encounters with IP3Rs and causes the channels to open, thus allowing the Ca2+ stored at high concentration in the ER/SR to enter the cytoplasm. Ryanodine receptors are structurally and functionally analogous to IP3Rs and are activated by binding of ryanodine (Franzini-Armstrong and Protasi, 1997). As a result of these ON mechanism Ca2+ flows into the cytoplasm to produce the increase in concentration that constitutes a Ca2+ signal.
2.4.2 “Ca2+OFF” mechanisms
Lederer, 1999). The plasma membrane Ca2+ATPase (PMCA) pump extrudes Ca2+ to the outside and sarco-endoplasmic Ca2+ATPase (SERCA) pump returns Ca2+ to the internal stores (Fig 2.5). The Ca2+ concentration in ER and in extracellular space is much higher than in cytosol, therefore the Ca2+ extrusion by these pumps work against a high concentration gradient and is ATP dependent. In addition to it, there are also Na+/Ca2+ exchangers that also extrude Ca2+ to the outside from the cytoplasm.
The mitochondria is another important component of OFF mechanism in that it sequesters Ca2+ under conditions of local elevated cytoplasmic Ca2+ and then releases it back slowly during the recovery phase (Fig 2.5). The uptake of Ca2+ by mitochondria is, in fact, not mediated by pumps or exchangers, but by a “uniporter” possibly a gated channel (Nicholls and Crompton, 1980). The molecular identity and nature of the uniporter is unknown. The uniporter provides a pathway for the accumulation of the Ca2+ into the mitochondrial matrix, driven by the electrochemical potential gradient across the inner mitochondrial membrane, usually estimated at 200 mV negative to the cytosol, and generated either by respiratory chain or ATP hydrolysis. However, the uniporter has a very low affinity for Ca2+ and has been demonstrated that mitochondria sequester only very low amounts of Ca2+ (Somlyo et al., 1979). The Ca2+ efflux from mitochondria back into the cytosol is mediated by two types of exchangers namely, Na+/Ca2+ and H+/Ca2+ exchangers (Nicholls and Crompton, 1980; Carafoli, 2003).
2.5 Alzheimer’s disease and Ca2+ dyshomeostasis
increase in resting cytosolic [Ca2+]
i with aging has been reported in synaptosomes obtained from the aged brains and in acutely dissociated neurons isolated from hippocampus or neocortex (MartInez et al., 1988; Villalba et al., 1995; Kirischuk and Verkhratsky, 1996). Similar increase has been reported for peripheral neurons and for cerebellar purkinje neurons recorded in brain slice (Kirischuk and Verkhratsky, 1996). The issue of the resting (or basal) intracellular Ca2+values in the aged neurons is central for the “Ca2+ hypothesis” of neuronal aging. At steady state, the resting Ca2+values represent the balance between the Ca2+ entry system (mainly Ca2+ permeable channels) and Ca2+ removal system (mainly Ca2+ pumps). Even a minimal dysfunction in any of these systems determine over a period of time a resetting of the steady state value of resting Ca2+.
Studies of the pathogenic mutations in PS1, PS2 and APP gene responsible for EOFAD have established central roles for perturbed cellular Ca2+ homeostasis. Ca2+ deregulation in AD includes APP processing regulation, ER dysfunction, mitochondrial changes and gene expression alterations.
2.5.1 Presenilins and Ca2+ dyshomeostasis
reveals that a pathological pathway involving the destabilization of Ca2+ homeostasis is common to both PS1 and PS2. Studies in transgenic mice harboring M146L mutation in PS1 exhibits disruption of the control of intracellular Ca2+, abnormal synaptic Ca2+ homeostasis and mitochondrial dysfunction (Begley et al., 1999; Barrow et al., 2000). Abrogation of functional PS1, by either knocking out PS1 or expressing inactive PS1 reduces ER Ca2+ storage (Yoo et al., 2000; Leissring et al., 2002) and potentiates Capacitative calcium entry (CCE) (Yoo et al., 2000). Likewise, the release of Ca2+ from ER stores after treatment with thapsigargin, an irreversible inhibitor of the SERCA pump, was also elevated in cells that expressed physiological levels of mutant PS1 (Leissring et al., 2000). Over expression of the PS1 ΔE9 (exon 9 deleted PS1) mutation in neuroblastoma cells also increases Ca2+ stores (Smith et al., 2002). Conversely, Ca2+ stores are diminished in presenilin-deficient cells (Leissring et al., 2002). All these evidences show that presenilins play a very critical role in regulating Ca2+ homeostasis in the ER.
2.5.2 Amyloid Precursor Protein and Ca2+ dyshomeostasis
There have been considerable reports that link altered processing of APP to disruption of neuronal Ca2+ homeostasis and an excitotoxic mechanism of cell death in AD. Generally, secreted N-terminal molecules of APP (sAPPα or sAPPβ) normalize cytosolic Ca2+ levels and are regarded as neuroprotective (Goodman and Mattson, 1994). sAPPα or sAPPβ has been shown to moderate Ca2+ responses in hippocampal neurons after exposure to glutamate, and can protect neurons against excitotoxicity (Mattson et al., 1993a; Mattson, 1994; Koizumi et al., 1998). These molecules have also been shown to protect the cells against the pro-apoptotic effects of mutant PS1, and this effect is mediated by the stabilization of intracellular Ca2+ (Guo et al., 1998b).
in fact, Aβ may or may not be neurotoxic depending upon whether or not it is in an aggregated state. For instance, it was shown that fresh unaggregated Aβ was not neurotoxic but if left for 2-4 days incubation prior to addition to the cultures resulted in aggregation and neurotoxicity (Pike et al., 1991). Subsequently, a direct relationship between peptide aggregation and neurotoxic potency was shown (Pike et al., 1991; Busciglio et al., 1993; Mattson et al., 1993b). These experimental studies are consistent with the observed AD pathology in which only plaques containing aggregated Aβ are associated with neuronal degeneration. The mechanism of Aβ toxicity was examined in a series of studies on cultured human cortical and rat hippocampal neurons. Chronic exposure of Aβ
results in an elevation of resting Ca2+values and increased Ca2+ responses to depolarization (Mattson et al., 1992; Mattson et al., 1993b).
As described in the preceding text, APP undergoes presenilin dependent
γ-secretase cleavage generates Aβ peptides and AICD. Recently it has been shown that AICD regulates phosphoinositide mediated Ca2+ signaling through a
γ-secretase dependent signaling pathway (Leissring et al., 2002). A recent report shows that elevated β-secretase (BACE1) expression in sporadic AD may induce the increase in β-CTF (sAPPβ) and Aβ but cause a reduction of AICD generation (Kume et al., 2004). This infers that as AICD has been shown to play a role in signal transduction, a decreased levels in sporadic AD brain may induce signal transduction failure (Cao and Sudhof, 2001; Scheinfeld et al., 2003), Interestingly, it has been reported that some PS1 mutations causing EOFAD, inhibit the generation of AICD (Chen et al., 2002). Therefore, AICD may be a key molecule for the elucidation of AD pathology.
2.5.3 Mitochondrial dysfunction and Ca2+ homeostasis
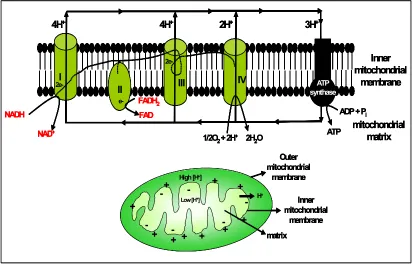
Mitochondria play a complex multifactorial role in the cell. In addition to their primary role in ATP generation, the organelles also sequester Ca2+ (Gunter et al., 1994) . These functions are intimately interlinked through the central bioenergetic parameter of the proton electrochemical gradient across the inner mitochondrial membrane which is generated as a result of oxidative phosphorylation. The NADH and FADH2 formed in glycolysis, fatty acid oxidation and the citric acid cycle are energy rich molecules because each contains a pair of electrons having a high transfer potential. The flow of electrons from NADH or FADH2 to O2 through protein complexes (named as complex I-IV) located in the mitochondrial inner membrane leads to the pumping of protons out of the mitochondrial matrix (Fig 2.6). The resulting uneven distribution of protons generates a pH gradient and a transmembrane electrical potential (Δψm), both of these components together constitutes a proton motive force (∆p). ATP is synthesized when proton
Fig 2.6: NADH and FADH2 are high energy electron carriers generated through citric acid cycle.
Electrons from NADH and FADH2 enters the electron transport chain at respectively complex I
and complex II. The flow of electrons from complex I to IV leads to pumping of protons out of the mitochondrial matrix. Complex I, III and IV function as proton pumps. The resulting uneven distribution of protons generates a pH gradient and a transmembrane electrical potential that creates a proton motive force. ATP is synthesized when protons flow back to the mitochondrial matrix through an enzyme complex called ATP synthase that catalyses the synthesis of ATP. Due to this phenomenon, the mitochondrial membrane potential is negative on the matrix side and positive on the cytosolic side.
The mitochondrial membrane potential Δψm, not only serves as a key intermediate in the synthesis of ATP but can also be utilized to accumulate Ca2+ (Gunter and Gunter, 1994). Uptake of Ca2+ by mitochondria is mediated by a uniporter which is activated by elevated cytoplasmic Ca2+ and which allows Ca2+ to enter the matrix down the steep electrochemical gradient (composed mostly of a – 150 to – 180 mV mitochondrial membrane potential, ψm) that is maintained by selective pumps and conductances. Mitochondrial Ca2+ uptake increases the
I
II III IV synthaseATP
4H+ 4H+ 2H+ 3H+
NADH NAD+ FADH2 FAD 2 e-
2e-1/2O2 + 2H+ 2H
2O
ADP + Pi
ATP Inner mitochondrial membrane mitochondrial matrix + + + + + + + + +
High [H+]
-Low[H+] H+ Inner
mitochondrial membrane Outer mitochondrial membrane matrix + I
II III IV synthaseATP
4H+ 4H+ 2H+ 3H+
NADH NAD+ FADH2 FAD 2 e-
2e-1/2O2 + 2H+ 2H
2O
ADP + Pi
ATP Inner mitochondrial membrane mitochondrial matrix + + + + + + + + +
High [H+]
-Low[H+] H+ Inner
mitochondrial membrane Outer mitochondrial membrane matrix + I
II III IV synthaseATP
4H+ 4H+ 2H+ 3H+
NADH NAD+ FADH2 FAD 2 e-
2e-1/2O2 + 2H+ 2H
2O
ADP + Pi
ATP Inner mitochondrial membrane mitochondrial matrix I
II III IV synthaseATP
I
II III IV synthaseATP
4H+ 4H+ 2H+ 3H+
NADH NAD+ FADH2 FAD 2 e-
2e-1/2O2 + 2H+ 2H
2O
ADP + Pi
ATP Inner mitochondrial membrane mitochondrial matrix + + + + + + + + +
High [H+]
-Low[H+] H+ Inner
mitochondrial membrane Outer mitochondrial membrane matrix + + + + + + + + + +
High [H+]
-Low[H+] H+ Inner
activity of several dehydrogenases (McCormack et al., 1990), which drives the operation of the electron transport chain and ATP synthesis, thereby matching energy production with demand (Duchen, 1999). Mitochondrial Ca2+ buffering is central to normal physiology and Ca2+ signaling. Therefore any alteration in any of these mitochondrial functions might be the underlying cause of disturbed Ca2+ homeostasis and altered energy metabolism, a characteristic of age related diseases like AD.
3 Aim of the study
Alzheimer’s disease has a very complex and multifactorial etiology. The pathogenesis of AD is still not well understood and especially the precise cellular and molecular mechanisms that underlie the cause of disease. Lines of studies done on the pathogenic mutations in PS1, PS2 and APP in different cellular model have established central roles for disturbed Ca2+ homeostasis. But up to date no definitive mechanism have been described that underlie disturbances in Ca2+ homeostasis due to these mutations. The study done in this thesis is focused on the normal physiological role of APP and its cleavage products with regard to cellular Ca2+ homeostasis. The function of APP is unknown and ablation of APP gene does not lead to any substantial phenotype in gene targeted mice (Zheng et al., 1996). APP is a member of a gene family that includes Amyloid precursor like proteins APLP1 and APLP2, which might compensate for the loss of APP (Heber et al., 2000). In a previous study, it was revealed that ablation of all the three family members leads to early postnatal lethality (Herms et al., 2004), indicating the importance of these proteins in the cell.
Therefore the specific aims of the thesis are:
A. To understand the role of APP and its cleavage products in maintenance of Ca2+ homeostasis.
B. To study which cleavage product of APP processing is involved in ER Ca2+ storage and hence maintenance of Ca2+ homeostasis.
C. To study the underlying mechanism that control Ca2+ homeostasis via APP or its cleavage products.
4 Materials
4.1 Cell lines
4.1.1 Human embryonic kidney cells (HEK293 cells)
HEK293 cells were courteously provided by Prof.Christian Haass (Adolf Butenandt Institute, Munich). The following stable cells lines of HEK293 cells were used :
• Express human APP (wtAPP) (Haass et al., 1992a)
• Express APP with swedish mutation (APPsw) (Citron et al., 1992)
• Coexpress APPsw and PS1 with D385N mutation (PSD385N) (Capell et al., 2000)
• Coexpress APPsw and insulin degrading enzyme (IDE) (Edbauer et al., 2002a)
4.1.2 Human neuroglioma cells (H4 cells)
H4 cells were courteously provided by Ellen Kilger (Hertie Institut für Klinische Hirnforschung, Tübingen). The following stable cell lines under the control of “Tet-Off system” in H4 cells were used (Gossen and Bujard, 1992) :
• Express inducible allele of AICD fragment with VSV tag (H4-AICD-VSV)
• Express only regulator plasmid (H4-control)
4.1.3 Primary culture of mouse astrocytes
• App knockout mouse (App0/0) (Muller et al., 1994)
• C57xSv129 mouse (Wt)
4.2 Bacterial strain
4.3 Plasmids
• pEGFP-N1 was purchased from clontech.
• pcDNA3 (Invitrogen) encoding nucleotide sequence of AICD (pcDNA3-AICD). This construct was provided by Prof.Christian Haass. The AICD sequence was cloned between HindIII and XbaI restriction enzyme site in multiple cloning region.
4.4 Microscopes
• BX50WI upright microscope from Olympus (Germany) was used for imaging experiment. The 20X water immersion objective (UM plan FI) was also purchased from Olympus.
• Axiovert 40CFL from Zeiss (Germany) was used for normal visualization of cells.
4.5 Filter sets
• Fura-2 filter set (Till photonics, Germany) Exciter filter None Dichroic mirror DCLP410 Emission LP470
Where, DC and LP are abbreviations used by the manufacturer for dichroic and long pass filters respectively.
• Fura-2/Rhodamine filter set (AHF analysen technik, Germany) Exciter filter None
4.6 Antibodies
• Anti-VSV mouse antibody was purchased from Sigma, Germany.
• Anti-GSK-3β and Anti-GSK-3β (pY216) phospho specific mouse antibody was purchased from BD transduction laboratories, Germany.
• Anti-β-actin rabbit antibody was purchased from Santa Cruz Biotechnology INC., USA.
• Anti-Tim44 was courteously provided by Andreas Reichert (Adolf-Butenandt institut für physiologische chemie, Munich)
• Alkaline phosphatase conjugated anti-immunoglobulin mouse/rabbit antibody was purchased from DakoCytomation, Denmark.
4.7 Commercial kits
• Ca2+ calibration buffer kit Molecular probes, Germany.
• Bioluminiscent somatic cell assay kit Sigma, Germany.
• DNeasy tissue kit Qiagen, Germany.
• Plasmid midi kit Qiagen, Germany.
• Effectene transfection kit Qiagen, Germany.
4.8 Buffers
All buffers were prepared in deionized water. 4.8.1 Buffers for Ca2+ imaging
HBSS buffer
• NaCl 145 mM
• KCl 2.5 mM
• MgCl2 1 mM
• HEPES 20 mM
• Glucose 10 mM
• CaCl2 1.8 mM
HBSS buffer (Ca2+ free)
• NaCl 145 mM
• KCl 2.5 mM
• MgCl2 1 mM
• HEPES 20 mM
• Glucose 10 mM
• EGTA 50 µM
pH was set to 7.2 before use.
Fura-2/AM and rhodamine-123 loading buffer
• HBSS buffer
• Pluronic acid 0.08%
• BSA 1% w/v
4.8.2 Buffers for crude mitochondrial extraction Resuspension buffer (RSB buffer)
• Tris-HCl (pH 7.5) 10 mM
• EDTA 5 mM
• CaCl2 1.5 mM
Mannitol-Saccharose buffer (MS buffer)
• Tris-HCl (pH 7.5) 10 mM
• EDTA 5 mM
• Mannitol 420 mM
4.8.3 Buffers for western blotting Lysis buffer
• SDS 0.1% (w/v)
• NP40 1% (v/v)
• Deoxycholate 0.5% (w/v)
• Tris (pH 8.0) 10 mM
• NaCl 150 mM
Tricine-SDS running buffer
• Tris-base 100 mM
• Tricine 100 mM
• SDS 0.1% (w/v)
pH was set to 7.3.
I–block
• PBS 1 tablet per 1000 ml
• I-block powder 0.2% (w/v)
• Tween-20 0.1% (v/v) Heated at 60oC for 1 hour.
Blotting buffer
• Tris-HCl (pH 7.4) 25 mM
• Glycine 200 mM
• SDS 0.1%
• Methanol 20%
Laemmli buffer
• EDTA (pH 8.0) 25 mM
• SDS 7.5% (w/v)
• Bromophenol blue 2.5% (w/v)
• β-mercaptoethanol 7.5% (v/v)
• Urea 4 M
TBS-Tween buffer
• Tris-HCl 50 mM
• Tween-20 0.1%
• NaCl 100 mM
pH was set to 7.4.
Alkaline phosphatase buffer
• Tris (pH 9.5) 100 mM
• NaCl 100 mM
• MgCl2 5 mM
4.8.4 Buffer for agarose gel electrophoresis TAE buffer
• Tris-HCl (pH 8.2) 40 mM
• Acetic acid 20 mM
• EDTA (pH 7.6) 2 mM
4.8.5 Growth medium for bacterial cultures Lurea-bertani medium (LB medium)
• Trypton 1%
• Yeast extract 0.5%
• NaCl 1%
Lurea-bertani agar plates
• Lurea broth medium
• Agar 1.5%
4.9 Equipments
• Centrifuge 5415 R, 5804 R, 5810 R
Eppendorf, Germany.
• Microplate reader (Luminometer) BMG Labtech, Germany.
• Gene pulser II (Electroporator) Biorad, Germany.
• Electroporation tubes (0.4 cm) Gene pulser cuvette, Biorad, Germany.
• Biophotometer Eppendorf, Germany.
• Vertical electrophoresis system Invitrogen, Germany.
• Horizontal electrophoresis system Peqlab, Germany.
• Blotting apparatus Hoefer semiphor, Amersham
pharmacia biotech., Germany.
• pH meter Heidolph instruments, Germany.
• Incubators Kendro, Germany.
• PCR cycler Eppendorf, Germany.
• UV transilluminator Vilber Lourmat, France.
• Thermomixer Eppendorf, Germany.
• Water bath GFL, England.
4.10 Chemicals
Table 1: List of chemicals
No. Chemical Company
1. 10-20% tricine-SDS gels Invitrogen, Germany
2. Agar Becton Dickinson, Germany
3. Agarose Peqlab, Germany
4. Ampicillin Roth, Germany
5. BCIP Roche, Germany
6. Bovine serum albumin Sigma, Germany
7. Cyclopiazonic acid Calbiochem, Germany 8. Dimethyl malate Sigma, Germany
9. Dimethyl succinate Sigma, Germany
10. DMEM PAN, Germany
11. DPBS PAN, Germany
12. DTT Roche, Germany
13. Ethidium bromide Sigma, Germany
14. FCCP Sigma, Germany
15. FBS PAA, Germany
16. Fungizone Gibco, Germany
17. Fura-2/AM Molecular probes, Germany
18. G418 Sigma, Germany
19. Gel loading solution Sigma, Germany 20. Gentamicin Invitrogen, Germany
21. Glutamax Invitrogen, Germany
22. Glycine Sigma, Germany
23. HBSS Invitrogen, Germany
24. HEPES Sigma, Germany
25. I-block Tropix, Germany
27. MITO BD biosciences, Germany 28. N2 supplement Invitrogen, Germany
29. NBT Roche, Germany
30. Oligomycin Sigma, Germany
31. PBS tablets VWR, Germany
32. Penicillin-streptomycin Invitrogen, Germany 33. Pluronic acid Sigma, Germany 34. Poly-d-lysine Serva, Germany
35. Rhodamine-123 Molecular probes, Germany 36. See blue protein marker Invitrogen, Germany
37. SOC-medium Peqlab, Germany
38. Sodium dodecyl sulphate Sigma, Germany 39. Sodium-L-ascorbate Sigma, Germany
40. TMPD Sigma, Germany
41. Trypsin-EDTA Invitrogen, Germany 42. Trypton Becton Dickinson, Germany 43. Yeast extract Becton Dickinson, Germany
44. Zeocin Invitrogen, Germany
45. γ-IV Calbiochem, Germany
Other general chemicals which are not mentioned in the table above were purchased from:
• Merck, Germany
• Sigma, Germany
4.11 Other materials
Plastic and related articles were purchased from:
• Nunc, Germany
• VWR, Germany
• Peqlab, Germany
4.12 Softwares
• Till vision 4.0 (Till photonics, Germany) was used for Ca2+ imaging.
• Fluostar optima (BMG Labtech, Germany) was used for luminescence.
• Sigma plot 7.0 (Systat software Inc., USA) was used for calculating area under the curve.
• Sigma stat 2.03 (Systat software Inc., USA) was used for statistical analysis.
5 Methods
5.1 Cell culture
HEK293 cell lines were cultured in DMEM supplemented with 10% foetal bovine serum (FBS), 1% penicillin/streptomycin (pen./strep.) and 1% Glutamax at 37oC in 10% CO2 atmosphere.
APPsw cells were cultured in DMEM supplemented with the selection antibiotic, G418 (0.2 mg/ml).
wtAPP cells were cultured in DMEM supplemented with the selection antibiotic, G418 (0.2 mg/ml).
APPsw/PSD385N cells were cultured in DMEM supplemented with the selection antibiotic G418 (0.2 mg/ml) and zeocin (0.2 mg/ml).
APPsw/IDE cells were cultured in DMEM supplemented with the selection antibiotic G418 (0.2 mg/ml) and zeocin (0.2 mg/ml).
H4 cells were cultured in DMEM supplemented with 10% FBS and 1% pen./strep. These cells express an inducible allele of AICD fragment with a C-terminal VSV-tag under the control of the “Tet-Off” system. The expression of AICD-VSV was turned off using doxycycline (100 ng/ml) in the growth medium.
5.2 Preparation of primary culture of mouse astrocytes
at 37oC for nearly one week. After about 1 week, when astrocytes have reached 90-95% confluency, the flask was placed overnight on a laboratory shaker at fairly high agitation (agitation causes many of the process bearing cells like neurons to be shaken away) at 37oC. The medium was exchanged with fresh DMEM.
5.3 Freezing of mammalian cells
Cells were grown to 90-95% confluency in 100 mm petridishes, washed with warm PBS and trypsinized. Trypsinized cells were collected in falcon tubes and pelleted down at 700 x g for 5 min. The pellet was resuspended in FBS with 10% DMSO to a final volume of 1 ml per plate. Aliquots were transferred to cryovials and were stored in freezing containers at -70oC. The cryovials were later transferred to liquid nitrogen for long term storage.
5.4 Thawing of mammalian cells
Frozen cryovials were transferred in water bath at 37oC for rapid thawing. The contents of the cryovials were transferred to 10 ml growth medium and centrifuged at 100 x g for 3 min. The media was removed and the pellet was washed similarly two times to remove DMSO. Finally, the pellet was resuspended in suitable growth medium, transferred to culture flasks and grown under requisite culture conditions.
5.5 DNA isolation from rodent tails
5.6 Genotyping
App0/0mice were genotyped routinely using DNA extracted from tail biopsies. The primers used are mentioned below:
Primers:
App0/0 1 and App0/0 2 primers were used for analyzing wild type allele and
App0/0 2 and App0/0 3 primers were used for amplifying knockout allele using the following PCR conditions.
For a 50 µl reaction volume, the following components were pipetted into a PCR tube:
Reaction mixture:
For 1 sample
Mastermix (purchased
from Eppendorf) 25 µl
Primer 1 (25 pmol) 0.5 µl
Primer 2 (25 pmol) 0.5 µl
Water 22 µl
DNA 2 µl
For 1 sample
Mastermix (purchased
from Eppendorf) 25 µl
Primer 1 (25 pmol) 0.5 µl
Primer 2 (25 pmol) 0.5 µl
Water 22 µl
DNA 2 µl
App0/0 1 App0/0 2
App0/0 3
Sequence Primer
5‘ CGA GAT CAG CCT CTG TTC CAC A 3‘
5‘ ATC ACC TGG TTC TAA TCA GAG GCC C 3‘ 5‘ GAG ACG AGG ACG CTC AGT CCT AGG G 3‘ App0/0 1
App0/0 2
App0/0 3
Sequence Primer
5‘ CGA GAT CAG CCT CTG TTC CAC A 3‘
PCR programme:
The PCR product was analyzed using agarose gel electrophoresis.
5.7 Agarose gel electrophoresis
The agarose gel was prepared by dissolving an appropriate amount of agarose (usually 1% final concentration) in 1X TAE buffer and ethidium bromide (1 µg/ml). The mixture was cooked and poured into precast agarose gel chambers. The DNA was mixed with the loading buffer (1:5) and loaded into spurs on the gel. The DNA was separated electrophoretically at 100 volts using 1X TAE as a running buffer. Finally, the DNA was visualized on a UV transilluminator.
5.8 Ca2+ Imaging
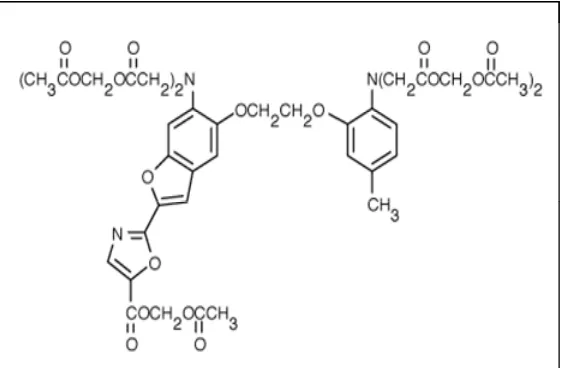
Real time measurements for intracellular Ca2+ concentration were done using Ca2+ indicator fura-2/AM (Fig 5.1).
Fig. 5.1: Structure of Ca2+ indicator Fura-2 (C44H47N3O24).
Its molecular weight is 1001.86 96oC
94oC 60oC 72oC 72oC
2 min 1 min 1 min 1 min 10 min
35 X 96oC
94oC 60oC 72oC 72oC
2 min 1 min 1 min 1 min 10 min
Fura-2 can be used to measure intracellular Ca2+ concentration changes for two reasons: First, it has an affinity to bind Ca2+ ions in a reversible manner.
Secondly, the spectroscopic properties of fura-2.Ca2+ complex differ from that of
the free fura-2. The fluorescence excitation maximum of fura-2 shifts to a lower wavelength on Ca2+ binding with negligible shift in the emission maximum. This allows fura-2 to be utilized as a dual excitation indicator. For optimal separation of fluorescence due to the two forms of the indicator, Ca2+ free fura-2 is usually monitored at 380 nm and Ca2+ bound dye at 340 nm. At an excitation wavelength of 340 nm, an increase in fluorescence emission indicates an increase in free intracellular Ca2+ concentration which can also be measured at an excitation wavelength of 380 nm as a decrease in fluorescence emission. Fura-2 has an iso-fluorescence point at 360 nm which is useful for monitoring Ca2+ independent fluorescence or for following quenching by heavy metal ions (Fig. 5.2).
Fura-2 is used as an acetoxymethyl (AM) ester form to achieve penetration through the lipophilic cell membrane and AM form is then readily activated by cellular esterases. Cells were viewed by upright epifluorescence microscope using 20X water immersion objective (Fig 5.3).
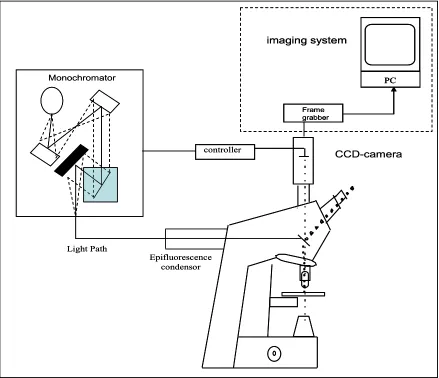
Fig. 5.3: Schematic representation of imaging system. The monochromator sets the wavelength sent by the computer via imaging system controller. The monochromatic light is linked to the microscope via a specially designed epifluorescence condenser. The fluorescence image is detected by a CCD camera. The frame grabber is the interface between the imaging computer and the CCD camera. It grabs the digitized images from the camera at 12.5 MHz (12.5 million pixels per second). The digitized images are then displayed by the computer as pseudocolor images.
Monochromator
controller CCD-camera
Light Path
Epifluorescence condensor
imaging system
PC
Frame grabber
Monochromator
controller CCD-camera
Light Path
Epifluorescence condensor
imaging system
PC
Frame grabber imaging system
PC PC
Microscope designed for epifluoroscence allows measurements of fluorescence from a region of cells selected specifically by the operator. The microscope contains the optical components necessary to deliver the excitation beam to the sample, isolate the fluorescence emission signal, and focus it as an image at the detector.
Excitation of the cells was performed at 340 nm and 380 nm and the ratio of the emissions was obtained using digital imaging system. Digital fluorescence images were acquired and displayed as pseudocolor images and subsequently analyzed by choosing defined region of interest so as to exclude any area not covered by a cell. Values were acquired at 3 sec intervals at both excitation wavelengths (340 and 380 nm). Ca2+ concentration were calculated from fluorescence intensities ratio using the following equation (Grynkiewicz et al., 1985):
[Ca2+] = Kd [(R - Rmin) / (Rmax – R)] *β
Where, R is the ratio of emission intensity, exciting at 340 nm to emission intensity exciting at 380 nm; Rmin is the ratio at zero free Ca2+; Rmax is the ratio at
saturating Ca2+; β is the ratio of fluorescence intensity exciting at 380 nm for zero free Ca2+ to fluorescence intensity exciting at 380 nm at saturating Ca2+. Kd of an
indicator or chelator is defined as the concentration at which it reaches the half saturation point. The dissociation constant (Kd) of Fura-2 is 224 nm. Values for
Rmin and Rmax were computed using Ca2+ calibration buffer kit.
Cell loading with Fura-2/AM: