Article
1
The Young interferometer as optical system for
2
variable depolarizer characterization
3
Aleksandra Kalbarczyk, Leszek R. Jaroszewicz *, Noureddine Bennis, Monika Chruściel, Paweł
4
Marć
5
Faculty of Advanced Technologies and Chemistry, Military University of Technology, Warsaw, Poland;
6
[email protected] (A.K.), [email protected] (L.R.J.), [email protected] (N.B.),
7
[email protected] (M.C.), [email protected] (P.M.)
8
* Correspondence: [email protected]; Tel.: +48 261 839 014
9
Received: date; Accepted: date; Published: date
10
Abstract: In a depolarizing instrument, such as a broadband imaging spectrometer, the
11
depolarizers are placed on the system for stabilization the optical signal. They are also used to
12
reduce measurements offsets due to strong polarization dependence, which produce drastic
13
deterioration of the signal to noise ratio. Dynamic depolarizer with a controllable degree of
14
polarization is also required to study the effect of noise on quantum information. The article
15
described a new instrument for characterization the variable depolarizer with features which make
16
it different from a polarimetric system. The analysing system based on the simple structural design
17
and has good stability for real-time measurement. A practical application of the described
18
interferometer system for variable depolarizer characterization is also presented.
19
Keywords: Young interferometer; depolarization measurement; modulation of depolarization;
20
liquid crystal device
21
22
1. Introduction
23
Interference is a special example of the superposition principle. When two or more propagating
24
coherent waves are incidents on the same point, the resultant amplitude is equal to the vector sum of
25
the amplitudes of the propagating waves. The consequence of the superposition principle can be
26
observed as dark and bright stripes, and their distribution called as fringe pattern. In 1802 Thomas
27
Young performed the first experiment with interference between waves from two similar slits
28
illuminated by a single source of the light (double-slit Young’s interferometer). Thenceforth
29
interferometers have found many technical applications. Regards they high accuracy and due to the
30
non-destructive property are often used for instance in medical diagnostics as optical coherence
31
topography instruments [1-2], blood flow [3], middle ear [4] or infectious diseases [5].
32
The interferometric measurement methods based on comparing images obtained from a
33
charge-coupled device( CCD camera) were proposed, also [6, 7]. They use a single CCD camera and
34
phase is calculated at every single pixel to give a phase map. From other side methods based on a
35
comparison of fringe pattern photos are limited. Complicated algorithms are supported to give a
36
value of the phase shift at each pixel, which is calculated with the help of neighbouring pixels. In
37
works [8-9], Mach–Zehnder interferometer configuration have been used with a single
38
photodetector. A quadrant photodetector and similar to the above technique was proposed to
39
measure the angular position of a parallel laser beam with an interferometric precision [10]. In
40
previously work, we proposed two-channel photodetector in Young interferometer using He-Ne
41
laser as a source of the light. The measurement itself is relative to the measurement using a CCD
42
camera, less time-consuming and does not require the use of complex algorithms. This is a
43
completely new tool for phase measurements adapted for liquid crystal (LC) materials [11].
44
Another interesting feature of a speckle is it polarization properties study. Polarization speckle
45
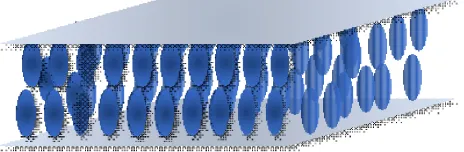
pattern consists of a constant polarization state in a reference beam and a random vector phasor sum
46
corresponding to the field scattered from an object in a second beam. Studying the polarization
47
changes of the light caused by a scattering media with a known initial state of the polarization of the
48
incident light is of great interest. The theoretical and experimental studies of polarization speckles
49
for different applications can be found in multiple papers [12-15]. All above applications use
50
polarized light with well-defined state of polarization (SOP) for their proper works according to
51
Fresnel -Arago conditions.
52
However many optical applications often require depolarized light. For instance in such
53
instrument as an optical spectrum analyzer, polarized incident light is strongly undesirable [16]. The
54
natural light is unpolarized light as well as light from thermal or gas sources. The unpolarized light
55
can be defined as light which vibrations of electric field take place randomly in directions
56
perpendicular to the direction of the wave propagation. According to this definition unpolarized
57
light is light for which the time averages of polarization component become equal to zero. Thus,
58
when the unpolarized light is transmitted through a polarizer, polarized light can be obtained with
59
constant efficiency. In contrast, depolarized light is obtained from polarized or partial polarized
60
light by special devices such as Lyott, Handle or Cornu depolarizer. It can be treated as the
61
composition of two component of equal intensity but contrary SOPs - two linear and perpendicular
62
SOPs, circular left and right SOPs or general two elliptical SOPs with perpendicular azimuths and
63
opposite circulation.
64
In this extended paper regarding the manuscript showed on I3S 2019: 7th International
65
Symposium on Sensor Science (I3S 2019) [17] we present an interferometric optical system for
66
variable depolarizer characterization, possesses the ability to study variable optical phenomena in
67
real time. We shall, therefore, be concerned with the SOP and the intensity of the light as it passes
68
through the variable depolarizer utilize a liquid crystal (LC) material.
69
2. Liquid crystal variable depolarizer
70
The polarization state of the light can be described by the Stokes parameters S0, S1, S2, S3. Then,
71
the degree of polarization (DOP) can be expressed as:
72
2 2 2
1 2 3
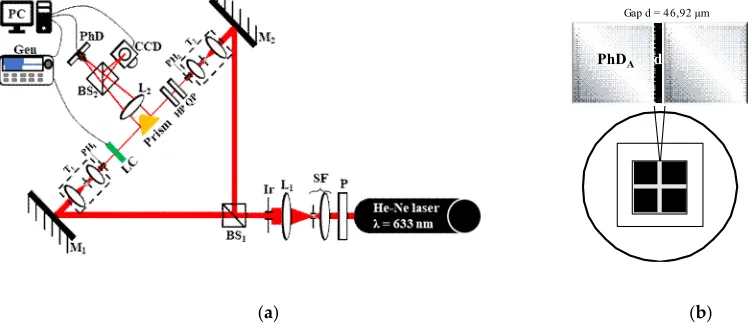
2 0
S S S
DOP
S
(1)
73
Depolarization effects can be related to spatially varying birefringent media, where DOP of a
74
partially coherent light decreases during propagation in the medium. Moreover, when a perfectly
75
polarized light beam passes through a depolarizing element, the light beam can be described as a
76
contiguous spatial distribution of a certain number of light beams, which are differently modulated
77
by the local birefringence.
78
The most known method of depolarizing light is the dispersion of light on porous structures
79
[18]. In these cases, we can observe optical losses inherently associated with light scattering. To
80
avoid losses, other methods of depolarization of light were investigated. Many works investigated
81
LC depolarizing properties [19-21], but there are still a lot of problems in this technology, as
82
instability of depolarizer with time or low depolarizing properties for sources with high coherence
83
length. In present work, we have proposed a depolarizing LC material with specific alignment
84
layers. The most detailed description of depolarizer is given by A. Shaham [22, 23]. All successful
85
designs have been based on his works, in which the depolarizer scheme is composed of a sequence
86
of birefringent crystals and wave plates. The wave plates were used instead of direct rotation of the
87
crystal to eliminate an unwanted angle dependent retardation. These methods suffer from bulkiness
88
and high cost.
89
LCs are functional materials possessing anisotropies originating from their inner molecular
90
alignment. At a nematic substrate interface as depicted in Figure 1, the tilt angle α is defined as the
91
angle between the easy axis of the nematic molecules and the normal to the surface. Depending on
92
the tilt angle, the alignment of the nematics can be categorized into two major groups: parallel
93
of the surface (the tilt angle is α = 90°), whereas in second - the easy axis is vertical to the surface (α =
95
0°). For optimum operation of variable depolarizer based on LC, a vertically aligned nematic (VAN)
96
LC with α = 0° pretilts (Figure 1) was proposed. In the off state (voltage V = 0) is isotropic for light
97
impinging at normal incidence. However, the LC molecules orientation upon electric switching (V ≠
98
0) is undefined; therefore, the cell generates disordered birefringent medium related to undefined
99
switching direction of molecules which produce random polarization of the transmitted light.
100
Therefore depolarization effect is produced [24]. The symmetrical construction of the cell assures
101
that the performance will be the same for light coming from either side. The treatment of problems
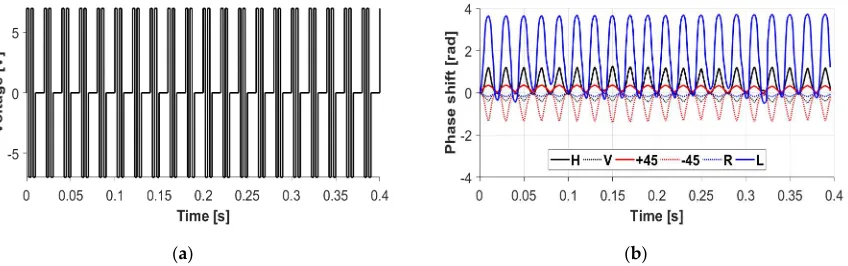
102
involving depolarization of incident polarized light beam passing through a variable depolarizing
103
medium and general physical phenomena associated with it is the main element of our
104
investigation. A suitable tool for this treatment is previously reported Young’s interferometer [25]
105
constructed with a new principle including the possibility to control the fringe pattern in real time
106
with the objective to study the dynamics of polarization fluctuation.
107
108
Figure 1. Homeotropic alignment in nematic LC cell.
109
3. The manufacturing process of the variable depolarizer
110
In our work, we have proposed a vertical aligned nematic liquid crystal cell as VAN depolarizer
111
(VAND) which uses 15 µm thickness cell filled with LCs having negative dielectric anisotropy.
112
Normally used conventional alignment layer induces a small pretilt in the vertical orientation angle.
113
Such VAN LC cell sandwiched between two crossed polarizers and orientated 45° concerning the
114
polarizer, is isotropic for light impinging at normal incidence when no voltage is applied to the cell.
115
After applying a voltage to the cell, preferred switching direction in VAN cell occurs, thus favoring a
116
specific switching plane. Therefore homogenous switching can be obtained. However, the organic
117
alignment layers like deoxyribonucleic derivatives crosslinked with surfactant complex such as
118
hexadecyltrimethylammonium chloride allow to obtain a vertical arrangement of LC molecules with
119
a non-pretilt (α = 0°). In this case, the LC orientation upon electric switching is undefined; therefore,
120
the cell generates chaotic structures. This produces the depolarization of the incident polarized light
121
because the switching direction of molecules is undefined and VAND is obtained.
122
To provide the polarization properties of the VAND, it is highly desirable known as the Stokes
123
vector of the transmitted light. Then the depolarization capability of the device for different SOPs of
124
the incident beam can be determined. To analyze the dependence of polarization properties of the
125
light passing through the VAND and to provide the full characterization of LC, the device should be
126
inserted into the special setup for polarization measurement. This setup must see unchanged light
127
intensity for any generated SOP. To maintain the intensity constant during the experiment, a
128
combination of a polarizer and a quarter-wave plate as a polarization state generator (PSG) has been
129
used [26]. As a detector, we implemented a polarimetric head to measure Stokes parameters, power
130
as well as DOP. During the measurements, VAND was inserted between PSG and polarimeter,
131
where the PSG enabled generation of the six input SOPs. For each of the six different SOPs, the
132
Stokes vector of the light transmitted by VAND is measured by the polarimeter. Therefore, the DOP
133
for VAND can be determined with high accuracy as is shown in Figure 2 for different input SOP [26].
134
These results show that with increasing voltage applied on structure, the DOP of transmitted light
135
decreasing because cell generates disordered birefringent medium related to undefined switching
136
direction of molecules. This phenomenon produces random polarization of the transmitted light.
137
The proposed VAND transmits the polarized component of incident light with a minimum DOP
138
situation minimum intensity loss and scattering is observed. It is also worth to mention that the
140
orientation of the depolarizer cell doesn’t have an impact on obtained measurements.
141
(a) (b) (c)
Figure 2. Measurement results of the DOP for VAND as a function of applied voltage for different
142
input SOP: (a) linear horizontal (H) and vertical (V), (b) linear with angle ± 45 deg. Respect to V, (c)
143
circular right (R) and left (L).
144
3. Calibration and essential parameters of the applied interferometric measurement setup
145
We have investigated the intensity pattern of the light transmitted by VAND using mentioned
146
above interferometer technique in experimental setup shown in Figure 3. The light from a He-Ne
147
laser (633 nm) passes through the polarizer (P) and is spatially filtered (SF) and collimated by a
148
lens (L1). Next, the light is splitting into two beams by the beam splitter (BS1). The reference beam is
149
reflected by a mirror (M1), and a probe beam is reflected by a mirror (M2). In both paths, telescopes
150
consisting of two positive lenses were inserted to obtain a 400 µm diameter collimated beams. To
151
adjust the equality of the diameter of the reference beam and the probe beam, two collimators with
152
circular pinhole diameter were situated after telescopes. For depolarization properties
153
characterization we have implemented a quarter-wave plate (QP) and a half-wave plate (HP) to
154
generate six SOPs. Then, a right-angled gold coated prism bends the light coming from the
155
collimators by 90°. Thus, the reflected beams become parallel to each other. To adjust the size of the
156
beam, we implemented pinholes (PH), which are placed after telescopes (T) in the system.
157
Gap d = 46,92 µm
PhDA d PhDB
(a) (b)
Figure 3. The scheme of the interferometer setup: (a) general view, (b) the scheme of used PhD. Light
158
source: He-Ne laser with λ = 633 nm; P - linear polarizer; SF - spatial filter; Ir – iris, BS - beam
159
splitters; M - mirrors; T – telescopes, PH - pinholes; LC - liquid crystal cell; L1, L2 – lenses; PhD –
160
photodetector, Gen – generator, HP – half-wave plate, QP – quarter-wave plate.
161
The distance between two-point sources and the distance between two photodetectors
162
photodetectors is fixed, the calibration process requires the adjustment of the distance between two
164
rays, which is affected by the position of the prism. If the position of the prism is changed, the
165
intensities collected by photodetectors also change. Those intensities are collected in an acquisition
166
card (DAC). LabVIEW software was prepared to record the data. Intensities from PhDA (IA) and
167
PhDB (IB) are added or subtracted to each other:
168
A B
SumI I , Diff IAIB (2, 3)
169
In reference [24], the detected signals are described as follows:
170
1 2cos 3sin
R
S a a a SLa1a2cos a3sin (4, 5)
171
where SL, SR are the signals from the left and the right detectors, respectively and Δφ is a phase shift.
172
Those signals depend on the combination of cosine and sine of the measured phase shift.
173
Coefficients a1, a2, a3 are constants depending on the wavelength, the distance between two beams d,
174
the focal length f of the Fourier lens and the size of the beam s and can be calculated from:
175
2 1 / 2 f f da C A dy dx
(6)176
2 2 / 2 4cos f f f
d
dx
a C A dy dx
f
(7)177
2 3 / 2 4sin f f f
d
dx
a C A dy dx
f
(8)178
where: A2(ρ) is the spatial distribution of amplitude in the Fourier plane, λ is the wavelength, d is the
179
distance between two beams and f is a focal length of the Fourier lens and C is a constant value.
180
Then, using the relationship describing the signals from the left and right side, the sum Sum = (SR +
181
SL) and the difference Diff = (SR - SL) can be expressed as:
182
1 2
( ) 2 2 cos
Sum a a Diff()2a3sin (9, 10)
183
According to equations (9), (10) a1 is the amplitude of the sum function, a2 is the average value
184
of the sum function, and a3 is the average value of the difference function. To determine the phase
185
difference between the two beams we need to know the sum and the difference of the signal values
186
of coefficients a1, a2, and a3:
187
1 2
( ) 2 2 cos
Sum a a Diff()2a3sin (11, 12)
188
The information about an error of the phase difference, induced by this system was analysed
189
and described in reference and had the following expression [25]:
190
1
sin(2 ) 2
(13)
191
where: ρ = a3/a2. According to equation (13), in the case of ρ=1 the error is equal to zero. Those results
192
indicate that, when a3 = a2,the error is not dependent on the phase difference value.
193
Calibration of the setup was performed using a piezoelectric mirror to induce a phase
194
demodulation only in one arm of the interferometer. Results of phase demodulation as a function of
195
time for three different positions of the prism is presented in Figure 4. The variation of the distance
196
between two beams has a significant impact on coefficients a1, a2 and a3, as well as on the quality of
197
the performance of our device [Figure 4(a)]. At the same time in the case where: a2 = a3 experimental
198
(a) (b)
Figure 4. System adjustment: (a) Dynamic phase shift measurements at three different values of the
200
distance between two beams d., (b) Comparison of the theoretical model (dotted line) and measured
201
phase shift when coefficients a2 and a3 are equal.
202
4. Dynamic behavior of depolarizer VAND
203
The optical system, calibrated according to the procedure described above, performs an
204
interferometric analysis for the spatial distribution of varying polarization in cross section of the
205
depolarized beam transmitted by VAND. A more desirable depolarizer would operate with varying
206
applied voltage. In the case of VAND, the applied waveform is sketched in Figures 5(a) and 6(a). The
207
voltage pattern applied to VAND was 1 kHz AC voltage modulated by 10 Hz envelope with
208
amplitude of 9 V [Figure 5(a)] and 50 Hz envelope with an amplitude of 7 V [Figure 6(a)]. We have
209
measured with the investigation of an impact of the SOP of the reference beam on the depolarization
210
capability of VAND. The beams in both arms are adjusted in such a way that their intensities are
211
equal on recombination. In Figure 5(b) we have compared obtained response of VAND for the
212
waveform shown in Figure 5(a).
213
(a) (b)
Figure 5. The results of VAND investigation: (a) The voltage pattern applied to LC device (1 kHz AC
214
voltage modulated by 10 Hz envelope with 9 V amplitude), (b) phase demodulation caused by
215
VAND is driven by a signal (a) obtained for six SOPs measured for this waveform.
216
(a) (b)
Figure 6. The results of VAND investigation: (a) the voltage pattern applied to LC device (1 kHz AC
217
voltage modulated by 50 Hz envelope with 7 V amplitude), (b) phase demodulation caused by
218
For linear polarization, it can be noticed that the modulation depth is comparable for opposite
220
SOPs, i.e., horizontal and vertical or +45° and -45°of the reference beam. However, the sign of the
221
phase shift is different. This result reflects the correlation between orthogonal equal-intensity electric
222
field components at a single space-time point. This effect is manifested in Figure 5(b). In this case, the
223
DOP can be considered as the degree of correlation between the orthogonal components which is a
224
fundamental definition of unpolarized light. Increasing the modulation frequency of the applied
225
waveform [Figure 6(a)], the performance of the depolarizer has been changed. In this case for
226
circular polarization of the reference beam, we have obtained high demodulation for the circular left;
227
however, for the circular right, there is almost no modulation. Demodulation depth results
228
presented in Figure 6(b) give us information about the contribution of each polarization state caused
229
by the depolarizing device for a certain situation. In our case, the light after passing through VAND
230
device is depolarized maintaining right circular polarization the most dominant in the cross-section
231
of the beam.
232
This method implemented to investigate the polarization properties can give us new
233
information about tested depolarizer, which cannot be observed by standard methods. From the
234
analysis of the results of Figure 5(b) we conclude that the light transmitted by the investigated
235
VAND is totally depolarized, whereas in the case of Figure 6(b) is partially depolarized. This result
236
establishes a new, interferometric interpretation for the DOP of the unpolarized beam.
237
5. Conclusions
238
We have proposed a new approach of interpretation of the DOP directly from interference
239
obtained by Young interferometer setup in the time domain. The presented dynamic shift of the
240
interference pattern relates to the phase modulation controlled by VAND shows an ability of VAND
241
to generate polarization modulation when it is driven by modulated signal waveform. The proposed
242
technique can find future application in sensing devices as well as biomedical studies of
243
depolarization caused by different types of media.
244
Author Contributions: conceptualization, L.R.J., and N.B.; methodology, N.B.; software, P.M..; validation, A.K.,
245
N.B., and L.R.J.; formal analysis, A.K.; investigation, M.C..; writing—draft, review and editing, A.K. and L.R.J.
246
Funding: This research was funded by the Ministry of the National Defence Republic of Poland - Research
247
Grant no. GBMON/13-995/2018/WAT.
248
Conflicts of Interest: The authors declare no conflict of interest.
249
References
250
1. Fercher, A.; Mengedoht, K.; Werner, W. Eye-length measurement by interferometry with partially
251
coherent light. Opt. Lett., 1988, 13, 186–188.
252
2. Huang, D.; Swanson, E.; Lin, C.P.; Schuman, J.; Stinson, W.; Chang, W. Optical coherence tomography.
253
Science, 1991, 254, 1178–1181.
254
3. Magnain, C.; Castel, A.; Boucneau, T.; Simonutti, M.; Ferezou, I.; et al., Holographic laser Doppler imaging
255
of microvascular blood flow. J. Opt. Soc. Am. A, 2014, 31, 2723–2735.
256
4. Drake, A. Laser interferometry applied to middle ear diagnosis. Proceedings of the 5th New England
257
Bioengineering Conference, 1977, 225-228.
258
5. Kussrow, A.; Enders, C.; Castro, A.; Cox, D.; Ballard, R.; Bornhop, D. The potential of backscattering
259
interferometry as in vitro clinical diagnostic tool for the serological diagnosis of infectious disease. Analyst,
260
2010, 135, 1535-1537.
261
6. Burke, J. Application and optimization of the spatial phase shifting technique in digital speckle interferometry. Carl
262
von Ossietzky University, Oldenburg, Germany, 2000.
263
7. Bavigadda, V. A new versatile electronic speckle pattern interferometer for vibration measurements. Dublin
264
Institute of Technology, Dublin, Ireland, 2008.
265
8. Clark, T.; Dennis, M. Coherent optical phase-modulation link. IEEE Photon. Technol. Lett., 2007, 19,
266
1206–1208.
267
9. Fernandes, N.; Gossner, K.; Krisch, H. Low power signal processing for demodulation of wide dynamic
268
10. Paolino, P.; Bellon, P.L. Single beam interferometric angle measurement. Opt. Commun., 2007, 280, 1–9.
270
11. Bennis, N.; Merta, I.; Kalbarczyk, A.; Maciejewski, M.; Marc, P.; et al. Real time phase modulation
271
measurements in liquid crystals. Opto-Electron. Rev., 2017, 25, 69–73.
272
12. Li, J.; Yao, G.; Wang, L. Degree of polarization in laser speckles from turbid media: Implications in tissue
273
optics. J. Biomed. Opt., 2002, 7, 307–312.
274
13. Schmidt, M.; Aizpurua, J.; Zambrana-Puyalto, X.; Vidal, X.; Molina-Terriza, G.; Sáenz, J. Isotropically
275
polarized speckle patterns. Phys. Rev. Lett., 2015, 114, 113902.
276
14. Zhang S.; Wang, W. Statistical properties of Stokes parameters in polarization speckle generated from a
277
rough surface scattering. Proc. SPIE, 2013, 9066, 906606.
278
15. Ghabbach, A.; Zerrad, M.; Soriano, G.; Amra, C. Accurate metrology of polarization curves measured at
279
the speckle size of visible light scattering. Opt. Express, 2014, 22, 14594-14609.
280
16. Tai A.; Yu, F.T.S. Synchronous dual-channel optical spectrum analyser. Appl. Opt., 1979, 18, 1297-1297.
281
17. Kalbarczyk, A.; Jaroszewicz, L.R.; Bennis, N.; Chrusciel, M.; Marc, P. Optical system for variable
282
depolarizer characterization. Proceedings of the 7th International Symposium on Sensor Science (I3S
283
2019), Napoli, Italy, 9-11 May 2019, MDPI , https://www.mdpi.com/journal/proceedings
284
18. Beckmann, P.; Spizzichino, A. The Scattering of Electromagnetic Waves from Rough Surfaces, Artech Print on
285
Demand, 1987.
286
19. Polat, O. Theoretical study on depolarization of the light transmitted through a non-uniform liquid crystal
287
cell. Optik, 2016, 127, 3560-3563.
288
20. Vena, C.; Versace, C.; Strangi, G.; Roberto, B. Frédericksz transition in homeotropically aligned liquid
289
crystals: A photopolarimetric characterization. Phys. Sta. Sol., 2008, 5, 1257-1260.
290
21. Domański, A.; Budaszewski, D.; Sierakowski, M.; Woliński, T. Depolarization of partially coherent light in
291
liquid crystals. Opto-Electron. Rev., 2006, 14, 305-310.
292
22. Shaham, A.; Eisenberg, H. Realizing a variable isotropic depolarizer. Opt. Lett., 2012, 37, 2643-2645.
293
23. Shaham, A.; Eisenberg, H. Realizing controllable depolarization in photonic quantum-information
294
channels. Phys. Rev. A, 2011, 83, 022303.
295
24. Vena, C.; Massarelli, R.; Carbone, F.; Versace, C. An approach to a model disordered birefringent medium
296
for light depolarization applied to a liquid crystal device. Journal of Optics, 2014, 16, 1-8.
297
25. Merta, I.; Hołdyński, Z.; Jaroszewicz, L.R. Bicell-photodetector in the Fourier plane as a fiber optic
298
homodyne phase demodulator: theoretical model and experimental results. Appl. Opt., 2013, 52, 4468-4476
299
26. Kalbarczyk, A.; Bennis, N.; Merta, I.; Spadlo, A.; Węglowski, R.; Kwiatkowska, M.; Marć, P.; Jaroszewicz
300
L.R. Modulation of depolarization analyzed by interferometry setup. Proc. SPIE, 2018, 10834, 10834-89.