78:12–3 (2016) 121–134 | www.jurnalteknologi.utm.my | eISSN 2180–3722 |
Jurnal
Teknologi
Full Paper
W
EBSITE
S
PEED
T
ESTING
A
NALYSIS
U
SING
S
PEEDTESTING
MODEL
Aneta Bartuskova
a, Ondrej Krejcar
a*, Thabit Sabbah
b,c, Ali
Selamat
b,da
University of Hradec Kralove, Faculty of Informatics and
Management, Center for Basic and Applied Research,
Rokitanskeho 62, Hradec Kralove, 500 03, Czech Republic
b
Faculty of Computing, Universiti Teknologi Malaysia, 81310 UTM
Johor Bahru, Johor, Malaysia
c
Faculty of Technology and Applied Sciences, Al Quds Open
University (QOU), P.O. Box, 1804, AL-Bireh, Rammallah, Palestine
d
UTM-IRDA Digital Media Centre, Universiti Teknologi Malaysia,
81310 UTM Johor Bahru, Johor, Malaysia
Article history
Received 26 November 2015 Received in revised form 14 January 2016 Accepted 10 October 2016
*Corresponding author
[email protected]
Graphical abstract
Abstract
Page load speed reflects the website´s performance. It has a significant influence on user experience and satisfaction. In this work we study and analyze the reasons cause the slowness of webpages laod speed. By the deep invistigation of the related literature and the reviwe of websites’s speed testing services from different perspectives such as functions, interface and additional settings. We present a detailed recommendations that can be followed to optimize site's performance. Our hypotheses about reliability of website speed testing has been tested and conformed experimentally. 378 individual speed tests with various combinations of settings experiemnts have been performed to confirm out hypotheses, and recommendations have been provided based on our results. We believe that following these rules would ensure significantly more reliable website speed testing in comparison with a common practice.
Keywords: Loading speed, website speed testing, web performance
© 2016 Penerbit UTM Press. All rights reserved
1.0 INTRODUCTION
Performance of websites, including loading speed, is becoming more and more important. With the abundance of available online resources to choose from, web visitors are getting less tolerant about slow-loading websites. It appears that users are much more impatient than previously thought [1]. Slow-loading sites are therefore a major frustration and turnoff for web surfers [2]. The role and importance of loading speed of websites is discussed in more detail in the State of the Art.
General causes and consequences of slow loading speed of websites are analyzed in this paper, along
with recommendations intended to limit or at least minimize them. The main causes include size of the images, responsive web design, misuse of JavaScript scripting language and many other reasons.
Recommendations are presented along with
website speed tests is then the main concern of the rest of the paper.
Reliability of website speed tests is questioned because of the misleading usage of these tests and inconsistent default settings. In this paper we will test several hypotheses related to website speed testing, which are based on our previous experience and existing research. Detailed testing methodology is then presented, along with the approaches from existing literature.
1.1 State of the Art
There are many terms specifying the time needed for loading a website in the browser window, e.g. loading speed, site speed, page load speed, page load time, response time, speed of data display or download delay. One of these alternative attributes is usually included in various sets of usability or design attributes researched in literature. Lee and Kozar included some of these variations in their thorough analysis of website usability constructs and placed them all in one category called "Simplicity", along with such terms as efficiency, minimal action or simple layout [3]. Similarly Morkes and Nielsen claimed that users want to get their information quickly, they want fast response times for hypertext links and at the same time they like well-organized sites that make important information easy to find [4]. Rosen and Purinton also connected loading speed with website's simplicity. According to these authors simplicity of design makes the site more appealing and also faster to load [2].
Constantinides classified site speed as one of usability factors among the main building blocks of web experience, in other words one of the elements which enhance web site usability [5]. Gehrke and Turban suggested among other usability factors also page loading and download time [6]. Aladwani classified speed of page loading as one of technical characteristics of the website and important attribute of the website quality [7]. Loiacono et. al. introduced response time as one of the dimensions for Web site evaluation in WebQual, an instrument for consumer evaluation of web sites [8]. Cebi included speed as one of website design parameters under technical adequacy with following description: "The site should provide quick loading, accessing, and using" [9].
Green and Pearson presented web site usability dimensions, among them also download delay. They characterized this dimension by e.g. these wordings: "The rate at which the information was displayed was fast enough" or "The speed in which the computer provided information was fast enough" [10]. Download delay is also among five factors included in the Palmer instrument for measuring of Web site usability [11]. Download delay is defined as the initial request for access to the page and then each subsequent request for changing pages with the site [12].
Loading speed of websites reflects the website´s performance and has a significant influence on user experience and satisfaction [22]. It is sometimes being interchanged with the term "performance". According
to Barker, web performance is the time that the content takes to be delivered to the end user, including network latency and browser render time [46]. Latency is then the amount of time it takes for the host server to receive and process a request for a page object [34]. Latency is also a significant contributor to all factors that affect page load time [35]. According to Fong and Chung, a linear improvement in page loading times can be realized for every 20 ms improvement in latency [34]. Consequently a simple latency optimization can yield significant improvements in overall page load times, usability and also revenue [35]. Similar term to latency is response time. Brown-Sica et al. defined response time as the time that it takes for all files that constitute a single webpage to travel across the Internet from a Web server to the computer on which the page is to be displayed [33]. Response time then does not include the time it takes for the browser to render the page.
The issue of loading speed is very important not only on presentation websites but also in e-commerce. Online customers expect fast loading Web pages [13]. Loading speed is also influencing a user’s preference for a particular website [14]. Rosen and Purinton pointed out that web surfers are not very patient and some web design experts have estimated that they have exactly 10 seconds to lure people into a site. Based on the statistical reports, 57 percent of users abandon web sites if the page does not load in 3 seconds [28]. Lindgaard et. al. suggests that time needed for assessing a visual appeal of a website is actually about 50 ms [15]. Loading speed is then very important for user experience, because slow loading speed means that user is forced to watch blank white screen or only partially displayed content of a website for a certain period of time. However first impression of a web site is very important if the user continues to use the web site [14].
Therefore it is not surprising that slow loading sites are a major frustration and turnoff for web surfers [2]. Also Miranda et al. agrees, that the time required to access information is critical factor for Web users seeking information [30]. Loading time is also a major contributing factor to page abandonment - the average user has no patience for a webpage that takes too long to load [16]. Therefore it is very important to test performance of websites and optimize the user experience. According to Sundaresan et al. [35], Internet service providers and application providers are increasingly cognizant of the importance of reducing Web page load times. The loading speed of websites has not impact only on user experience. Website speed also increases ranking in search engines like Google [44]. Finally according to Meenan, there is an overwhelming evidence, which indicates that a website’s performance (speed) correlates directly to its success [36].
about 15 percent slower than actual page load time [28]. Modern websites which rely heavily on JavaScript take even longer to load than usually accepted by users. Some of these websites use a simple technique to alter the perception of time - a
progress indicator. Leavitt and Shneiderman
recommend to provide users with appropriate feedback while they are waiting. Specifically, if processing will take up to sixty seconds or longer, use a process indicator that shows progress toward completion [37]. Similarly Weinschenk recommends to always provide progress indicators so people know how much time something is going to take [38].
1.2 Services for Website Speed Testing
General recommendations are a good start for optimizing any website. Nevertheless when the website plays a key presentation role and is designed for many users, its performance should be analyzed in more detail. Website speed testing tools are suitable for this purpose. They measure page load speed, show what elements cause the biggest delay in website´s response time and also offer comparison and recommendations and many performance metrics.
There are several ways of how to choose the right speed test. Nagy [28] used in his research a collection of top website speed testing tools published on Sixrevisions.com named "20 Free Online Tools for Website Speed Testing" [40]. Sixrevisions is a web publication for web developers and web designers [39]. Out of this list Nagy selected five online services:
Google's PageSpeed Insights, Yahoo's Yslow, AOL's
WebPageTest, GTMetrix and Pingdom. Nagy
concluded that the two major tools are PageSpeed and Yslow, because the others are based on them and on their manufacturer's recommendations. WebPageTest and Pingdom are built up from a subset of Google's rules; GTMetrix uses PageSpeed and Yslow best practises [28]. Finally GTMetrix was selected in the research, as it combines the advices of the two major and additionally gives ergonomic and smart user interface with detailed reporting possibilities [28].
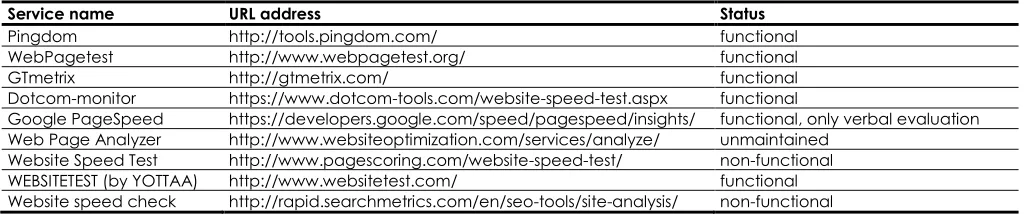
Another approach, which was used in our study, is to compile a list of suitable website speed testing tools using search engines. We used Google search for this purpose with a keyword "website speed test". Then we picked out the top-ranked services (we have excluded the sponsored links), specifically the first ten results. These are presented in Table 2 (actually only nine results, as Google PageSpeed appeared two times). Consequently we analyzed basic functionality of these services, which is specified under the column "Status" in Table 2.
From the previously mentioned services, only YSlow is not present in the table. YSlow is an in-browser tool used to assess a page’s web performance and get feedback on steps to take to improve performance [46]. Because YSlow is a browser extension and not a service easily accessible by URL address, it was not included among tested services although it is also quite popular for the purpose of website loading speed testing.
Table 2 Free online services for website speed testing
Service name URL address Status
Pingdom http://tools.pingdom.com/ functional
WebPagetest http://www.webpagetest.org/ functional
GTmetrix http://gtmetrix.com/ functional
Dotcom-monitor https://www.dotcom-tools.com/website-speed-test.aspx functional
Google PageSpeed https://developers.google.com/speed/pagespeed/insights/ functional, only verbal evaluation
Web Page Analyzer http://www.websiteoptimization.com/services/analyze/ unmaintained
Website Speed Test http://www.pagescoring.com/website-speed-test/ non-functional
WEBSITETEST (by YOTTAA) http://www.websitetest.com/ functional
Website speed check http://rapid.searchmetrics.com/en/seo-tools/site-analysis/ non-functional
Six functional services emerged from the analyzed collection. Google PageSpeed was consequently excluded, because it offers only verbal evaluation without actual values and performance metrics. The remaining five functional and suitable services were analysed more thoroughly in the next step. The analysis focused on the available settings, including possibilities after registration if the service had one. Summarization of available basic settings is presented in Table 3.
All of presented online speed tests were free to use in the time of writing this paper. There are of course
also paid services. E.g. WebSitePulse provides in-depth website and server diagnostic services that are intended to save e-business customers time and money by reporting errors and Web server and website performance issues to clients [33]. As can be seen in the Table 3, the most popular free services also offer the paid service, e.g. Pingdom or Dotcom-monitor. The paid service is usually offered for long-term monitoring of websites.
Table 3 Further analysis of services for website speed testing, analyzed Sep. 2015
Service name settings without login added settings after login
Pingdom location (6) N/A (long-term monitoring of one site, paid for more sites)
WebPagetest location (44), connection (12), browser (7 desktop, 4 mobile) *) N/A (registration is available only for a discussion forum)
GTmetrix x location (7), connection (6), browser (2 desktop, 1 mobile)
Dotcom-monitor location (23), browser (7 desktop, 4 mobile on several devices) N/A (paid service for long-term monitoring of websites)
WEBSITETEST (by YOTTAA) location (13), connection (4 desktop, 4 mobile), browser (3 desktop, ? mobile) N/A (new registrations are not available)
*) browsers and devices depend on selected location
The presented tools have diverse user interfaces and approach to presentation of options. Interface of Pingdom and GTmetrix encourage to run the speed test without even looking at settings, which are hidden and accessible by user interaction. The most emphasized design elements are the textbox for tested website´s URL and button for running the test. WEBSITETEST also hides its settings, however the buttons for accessing settings are more apparent than in previous cases. Dotcom-monitor initially hides settings of location as well, but offers visible icon set for browser selection. WebPagetest presents both location and browser selection right under the textbox for website URL, with link to advanced settings under these elements.
The services will be discussed in more detail in the following sub-sections.
1.2.1 Pingdom
Pingdom Website Speed Test [41] is available on http://tools.pingdom.com/fpt/. The service is free and offers several testing locations to choose from, Figure 2 shows the interface, where different settings can be chosen. The number of locations is variable, supposedly according to their availability. We have encountered from three to six locations so far. Pingdom does not offer any other settings which would have an influence on the outcome. Only Google’s Chrome web browsers are used for the testing, the type of connection is not specified [41].
Figure 2 User interface of Pingdom
Pingdom provides measurements of the loading speed of an HTML page including all its objects such as
images, CSS, Java scripts, RSS or Flash [30]. After the testing session, these key metrics are provided: performance grade, number of requests, load time and page size. The detailed results are provided in a form of a waterfall chart, where stages of requests are listed for every file on the tested webpage. Results of the testing are also presented as a set of performance grades for several key design rules, along with recommendations for performance improvement. These best practices originates from Google Page Speed, which is similar to Yahoo’s Yslow [41]. Additionally, results include load time analysis (time spent per state / content type / domain), size analysis (size per content type / domain) and request analysis (requests per content type / domain).
Gheorghe performed testing with this online service, in order to achieve optimal costs versus performance, however methodology of testing was not further discussed [29]. Pingdom Website Speed Test was also used by Miranda et al. [30] and Egri and Bayrak [31] in their studies.
1.2.2 WebPagetest
WebPagetest [42] is available on
http://www.webpagetest.org/, as seen in Figure 3. This service is also free and offers the widest selection of settings of all reviewed services. The number of available testing locations is slightly variable, we have encountered from 44 to 47 locations so far. Offered testing servers are however provided mostly externally, not by WebPagetest´s own servers. Some of the providers have also their own website with speed testing tool. E.g. location "Hong Kong" and "Denver" is provided by Dotcom-monitor, which has its own service [44]. Location "Ashburn" is provided by YOTTAA, which runs the WEBSITETEST presented in Table 3.
The selection of web browser is dependent on the chosen location, however the majority of locations offers more than three web browsers to choose from. The variability of test settings is then quite generous. WebPagetest was recommended among others in Barker´s Pro JavaScript Performance book. The number and range of parameters, which we can configure for
WebPagetest offers also numerous advanced settings, which include type of connection, number of tests to run, first view and repeat view, disabling or ignoring some functions etc.
Figure 3 User interface of WebPagetest
The results from WebPagetest are divided into several sections. The most important metrics are presented in a summary of results, which include: load time, first byte, start of rendering, number of DOM elements, and time and number of requests in states "document complete" and "fully loaded". Additionally the key performance metrics are evaluated by grades. All metrics are explained in WebPagetest documentation [32]. Fong and Chung presented these metrics as the performance evaluation parameters [34]. The most important for the purpose of this research is load time, which is explained as the time from the start of the initial navigation until the beginning of the window load event (onload) [32]. Load time is thus the same as the time under the "document complete" heading.
Similarly as PingDom, WebPagetest also analyzes the contribution of different network components to overall page load time via a waterfall [35]. It also offers request details and headers, full optimization checklist, connection views, and content breakdown by MIME type and domains. Sundaresan et al. [35] chose WebPagetest performance evaluation for comparison with their router-based web measurement tool Mirage. The WebPagetest was used also by Fong and Chung [34] to measure and analyze the performance of the Web pages. Barker presents whole chapter about testing with WebPagetest in his book Pro JavaScript Performance [46].
1.2.3 GTmetrix
GTmetrix [43] is available on https://gtmetrix.com/. You can run speed test without registration, however no settings are available. After signing up to this service, you can choose from 7 locations, 6 connection types and 3 browsers (two on desktop and one on mobile devices), as seen in Figure 4. GTmetrix features a pair of performance scores based on Google Page Speed’s and Yahoo! Slow’s algorithms [29]. The page with results also includes a list of recommendations, waterfall chart and key performance metrics: page load time, total page size and number of requests. GTmetrix was used e.g. in Gheorghe's research [29].
Figure 4 User interface of GTmetrix
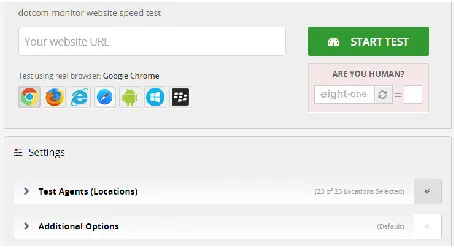
1.2.4 Dotcom-monitor
Dotcom-monitor [44] is available on
https://www.dotcom-tools.com/website-speed-test.aspx. This speed test is accessible without registration and offers 23 location and several browsers for testing. This service provides the widest offer of mobile devices and - the same as WebPagetest - five versions of Internet Explorer (from 7 to 11), Figure 5 show the user interface of Doctom-monitor website where different browsers can be chosen for testing.
Figure 5 User interface of Dotcom-monitor
Dotcom-monitor appears to be the best service if more locations need to be tested. While the other services would run one test in the selected location, Dotcom-monitor would run test in all locations, which are pre-selected, by clicking one button. If we wanted to test all offered locations with remaining test services (WebPagetest, GTmetrix, Pingdom or WEBSITETEST), we would have to run the test individually for every one of them. Dotcom-monitor offers also results in a form of waterfall and other performance metrics, however they are not as extensive as with the previous services. To our best knowledge, Dotcom-monitor was not used in any research as the primary tool for website speed testing.
1.2.5 Websitetest
Unfortunately we were not able to run any test with this service. We have tried to do so several times on three different days on several devices and browsers. After configuring settings and clicking on start button "test", the screen with results was loading for several hours, after which we terminated the trial test.
1.3 Causes of Slow Loading Speed
browsing. In this section, the causes of slow loading speed will be presented, along with recommendations of how we can simply avoid it. Quite often the particular website loads slowly for no good reason, simply because it is not optimized. Sometimes lower speed is an intentional payment e.g. for better interactivity and user experience. As Work stated, page loading time is an important part of any website’s user experience but many times we’ll let it slide to accommodate better aesthetic design or new functionality [16].
1.3.1 Images
Web site designers can simply choose not to include slow loading elements [10]. These are especially photos and other images, which have big file size in order to keep high quality. The cost of pictures is in download speed, frequently mentioned as a concern to on-line users [17]. Including many images and videos on a web page results in a slow loading time, which can be very frustrating [18]. Morkes and Nielsen also argued that users want fast-loading graphics and they want to choose whether to download large (slow) graphics [4]. The situation is much more difficult for mobile phones - networks are slower, hardware is less capable, and you have to deal with the messy world of data limitations and transcoding methods [18].
Despite of these conclusions, modern web design trends tend to prioritize large high-quality photos and graphics. When we look at modern websites or at web design templates available on the internet today, either free or for a price, very often there is a large picture over the whole screen. If it is a responsive website, the image is usually wide enough to fit on the widescreen monitor. These background or header images are often not even content-related and sometimes quite ambiguous, while they consume significant amount of downloading time and negatively affect loading speed. As for user experience point of view, it was proven by eye-tracking methodology that people ignore more images than they look at on the web, and they look at images for just a fraction of a second [19]. Also on web pages with multiple superfluous images, people treat the entire page as an obstacle course they must navigate, as a result they look at text around images but not at images [19]. In the study of Morkes and Nielsen, some users said that graphics that add nothing to the text are a distraction and waste of time [4]. Even though their role is not well-founded, large images play a significant role in today's web design, probably because it is "modern" and it looks "professional".
1.3.2 Responsive Web Design (RWD)
Marcotte wrote in 2011 that we are designing for more devices, more input types, more resolutions than ever before [20]. He answered this challenge with "responsive design". Responsive website can display
web content differently according to the particular device - its screen size and capabilities - on which it is being viewed. Resizing a desktop image to fit a mobile device’s screen however implies downloading an image that’s been suited for a desktop environment, which is an unnecessary large file [21].
Many web designers tend to use the simplest method available - common way of dealing with this issue is hiding too large images (and other content) for smaller displays. This however does not solve the problem with downloading too much data when it is not needed. The images will not be displayed, but they will be still downloaded, causing delay in page loading speed [18]. And if you use CSS media query to replace the background image with a mobile version, in some cases it would actually download both images [21]. Another common way of dealing with images is "shrinking" - as responsive web design uses fluid images to match the different screen sizes, desktop-grade image is downloaded every time, even when loaded on a much smaller screen [18]
1.3.3 JavaScript Techniques
According to Barker, JavaScript is potentially the largest area for improvement when trying to address the total performance of the website [46]. Websites relying heavily on JavaScript, especially those with AJAX (asynchronous JavaScript and XML) can experience performance issues. Souders tested the Alexa Top 100 URLs with and without JavaScript and
demonstrated improvement of an average
performance of 31% when removing JavaScript from a website [23]. Of course solution to faster loading speed is not removing JavaScript completely, web designers should rather learn to use it more efficiently. A motivation to learn programming properly is however a big problem these days. Because of the limitless resources available on the internet, one does not have to learn a lot to create a plausibly functional website. This trend can be simply confirmed e.g. by looking at "a question and answer site for professional and enthusiast programmers" called Stack Overflow (available at http://stackoverflow.com/). Often the questions are so basic with respect to the relevant field of knowledge, that it is apparent that people who ask them are lacking of elemental knowledge, yet they are trying to create a website, some of them are even trying to do it for business.
2.0 METHODOLOGY
This research paper has a theoretical part (see the previous section) and experimental parts. Firstly, the authors explored the problem of slow websites’ loading speed through extensive literature review to list the factors that affect the loading speed. Besides the literature review, the most popular speed testing services were examined to determine any additional factors.
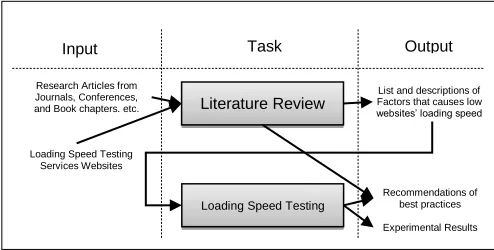
In the experimental part, series of 378 individual speed tests were performed. We have tested 42 combinations of speed test service and testing location, each of them 9 times. Recommendations were established for website’s developers about best practices that should be followed for high loading speed based on the literature review and experimental results. Figure 1 shows the operational research framework of the presented speedtesting model.
Figure 1 Operational research framework
2.1 Motivation and Problem Definition
If we want to measure a website´s speed more than once (we are interested in the development of loading speed) or we want to compare several websites regarding their performance, we should be interested in the reliability of repeated speed tests. Otherwise the difference in measured values may be not the real difference in performance but rather the difference caused by inconsistent testing.
This issue is connected with a problem of default settings. Usually we expect that default settings are recommended settings and if do not understand it very well; we should keep it at default values. However the majority of analyzed services at default settings arbitrarily assigned a location and browser (used for the particular speed testing) to our request. The choice of browser is connected to the choice of location and some services don´t offer more browsers in one place. Information about the browser is sometimes even not included in the report.
Sundaresan et al. [35] studied the page load times to nine popular Web sites. Their study is supposed to be the first to explore Web page load times from broadband access links, and the first to quantify the
extent to which latency becomes a bottleneck on high-throughput access links [35]. As expected, page load time varied both by site and the location of the access network and some variability resulted from differences in page size and design. Sundaresan et al.
used their router-based web measurement tool Mirage, deployed across the United States. As a result, access links outside of the US typically experienced higher page load times for a given site than links in the US. The median and variance was higher for all measured sites from outside the US as well.
Brown-Sica et al. [33] performed speed testing at different times of the day for thirteen days, all test from the same location (Seattle). The authors were interested mainly in average values, however they also presented original set of test results - individual response times in seconds [33]. From this data set can be clearly seen the variance in measured values. E.g. in the case of the first tested link from the first set of links, the values ranged from 9,4755s to 20,5529s. More specifically, twelve values ranged from 9,4755s to 13,2433 and the last value (20,5529s) deviated from the rest. Even without this last value, the variance is still quite big, and this difference is not even caused by different locations. This data set confirms the need for at least several test sessions, from which a median run should be chosen as the most probable result. The value, which greatly differentiated from the others, indicates that speed tests can produce significant deviations of individual values from other results. The question is, if these values should be excluded from the results, or if they indicate delays, which can be encountered also by real user (not only in testing environment) and as such should be taken into account.
On the basis of these findings, we will test reliability of speed test services.
2.2 Hypotheses and Objectives
We would like to test several hypotheses related to website speed testing, which are based on our previous experience and existing research. By values are meant page load times, which present results obtained from website speed tests.
1. values obtained by the same service and in the same browser and location
a. slightly differ from each other
b. might contain a value, which significantly deviates from the rest
2. values obtained by the same service, in the same
browser but in different locations
a. can even significantly differ from each other
3. values obtained in the same browser and location
but by the different service
a. can even significantly differ from each other
Literature Review
Input Task Output
Loading Speed Testing
Research Articles from Journals, Conferences, and Book chapters. etc.
Loading Speed Testing Services Websites
List and descriptions of Factors that causes low websites’ loading speed
Recommendations of best practices
By proving the above-mentioned hypotheses, we will present a valid point for careful considerations related to website speed testing. Especially we would like to warn against using only one website speed test with arbitrary default settings and present it as valid result. We would therefore also analyze the impact of inconsistent settings on speed testing reliability.
2.3 Methodology in the Literature
Many research papers use website speed tests in order to test performance of websites or systems. However presented testing often lack any methodology. In some papers there is only briefly mentioned that some tests were performed, along with the name of the used service [e.g. 29,30,31].
Methodology of testing is described in more detail e.g. in the research of Brown-Sica et al. [33], who performed testing of response time with use of WebSitePulse service. The authors stated that the testing was performed at different times of the day - one set of links was tested in the morning, one at midday, and one in the afternoon. There is no notion of why this variance of testing conditions was applied. Location of Seattle was chosen for all tests and the data were gathered for thirteen days [33].
Fong and Chung [34] devoted several pages to performance evaluation of their webpage with detailed look at the results. Methodology was not mentioned and the presented results were supposedly values gained by only a single speed test. This approach would be valid if the purpose was only to reveal recommendations generated by the test. However load time is metrics with significant variance and we should at least calculate a median from several measured values. WebPagetest does this automatically if more than one test was selected.
2.4 Methodology for this Research
We have conducted series of website speed tests with four services - WebPagetest, GTmetrix, Pingdom and Dotcom-monitor in order to test the defined hypotheses. We have encountered several issues, which we tried to solve in order to ensure easy comparison of results.
For testing we have selected the website, which ranked the highest in Google search on "webove stranky" in czech, which translates to "websites" in English. This website - www.webnode.cz - is a representative presentation of a web agency, which offer web services.
Fifteen tests were performed for every service - location combination. Five tests were run before midday, five in the afternoon and five in the evening. All test were run in one day, specifically 28.9.2015. In order to minimize variance (i.e. other sources than the difference by location or service, which was being tested), we have also tried to perform testing at the similar time. Of course ensuring the same exact time for all performed tests is not possible. This is due to several reasons:
1) interaction delay - time spent on moving to the next test and running it
2) service delay - usually we are not the only one using the speed testing service, so our request can get stuck in queue, e.g. we have encountered 54 pending tests in "London" location of WebPagetest, which took about two hours to overcome
3) various problems on the side of testing server
The presented services also took different approach to number of performed tests. WebPagetest provides option "Number of Tests to Run", which can range from 1 to 9. This is very useful function if you need to run more tests, e.g. to confirm the results, which is very advisable considering significant variance in results. Pingdom, GTmetrix and Dotcom-monitor have no such function, so the only solution is to open a new window and edit settings for every test instance. Nevertheless, we aspired for the closest possible starting times of testing sessions, which were of the same location. As was already revealed, we divided our testing sessions into three groups: "before midday", which were performed from 10, "afternoon" from 15, and "evening" from 20 o'clock. Administration of tests was performed in the Czech Republic (CET, GMT+1).
In all performed test, we have used the "First view" values. These loading times represent a situation, when a web user views the website for the first time. Such speed test is performed with a browser that has its cache and cookies cleared out. In all performed test, if the choice was possible, we chose native connection with no trafic shaping (WebPagetest) or unthrottled connection (GTmetrix). Pingdom offers only one browser, Google Chrome. Therefore testing was done on this browser, so the results can be compared. We also had to have some basic knowledge about devices, operating systems and browsers, so we could orient ourselves in test´s settings. Both Webpagetest and Dotcom-monitor offer testing on Safari browser, however Webpagetest has Safari on Windows while Dotcom-monitor has Safari on iPhones and iPads. The approach of choosing the location and browser also differs among services. E.g. Dotcom-monitor provides all combinations of offered browsers and locations, Webpagetest and GTmetrix offer only selection of browsers in particular location and Pingdom offers only selection of locations with Google Chrome browser.
The four selected services also differ in accuracy of resulting page load times. WebPagetest offers the most exact numbers in miliseconds. Pingdom also shows results in miliseconds, but only if the value is less than 1 second. If the value exceeds 1 second, Pingdom shows the result in seconds with two decimal places. GTmetrix presents page load times in seconds with only one decimal place. Dotcom-monitor offers load time at first in seconds with one decimal place, in detailed report with two decimal places. Therefore, to unite our results and make them easily comparable, we chose format of seconds with one decimal place.
testing or service was temporarily unavailable, we have repeated the testing as soon as possible (encountered mostly with WebPagetest and Dotcom-monitor). If the particular value obtained from test was tagged with error or warning, test was repeated for this value (encountered with Dotcom-monitor). GTmetrix and Pingdom seemed to be the most reliable services from this aspect, as they rarely showed any error during our testing.
3.0 RESULTS
AND DISCUSSION
This section presents results from performed testing sessions. We have organized part of these results into groups with the same testing location (see sub-section 7.1). After that we have organized part of these results into groups according to the used service (see sub-section 7.2). We believe these arrangements are suitable for easy comparison. Average values for every combination of location and service are presented in
the final sub-section. Individual values and their deviations can be easily analyzed (see hypothesis 1a and 1b) in sub-sections 7.1 and 7.2. Variations between results obtained from different services and locations (see hypothesis 2 and 3) are clearly showed in sub-section 7.3.
3.1 Results for the Same Location
This sub-section contains part of the results, grouped according to the testing location. Only locations, which were offered by at least three services, are presented here, namely: Amsterdam [Table 4], London [Table 5], New York [Table 6] and Hong Kong [Table 7]. Because WebPagetest provides testing through external services, in several cases there are more services offered in one location, e.g. in Amsterdam, see Table 3. From the fifteen values in each row, the maximum and minimum is slightly coloured to show differences in values. If there are more occurrences of the value, only the first one is marked.
Table 4 Website speed test results in location "Amsterdam, Netherlands"
Service before midday page load speed [s] afternoon evening
Pingdom 1,1 0,8 0,8 0,9 0,8 1,1 0,8 0,8 0,8 0,8 1,1 0,8 0,9 0,8 0,8
WebPagetest 1
(Go Daddy) 4,9 5,2 5,0 5,1 4,6 5,6 4,5 6,9 4,7 6,8 12,9 5,8 9,4 4,8 5,5
WebPagetest 2
(IISpeed) 2,3 1,6 1,5 1,8 1,5 2,0 1,8 1,9 2,3 1,6 2,1 1,6 1,6 1,9 1,7
Dotcom-monitor 2,6 2,3 2,0 2,4 2,4 2,5 2,4 2,2 2,5 2,3 6,8 6,5 6,9 6,6 7,3
Table 5 Website speed test results in location "London, UK"
Service before midday page load speed [s] afternoon evening
GTmetrix 2,0 2,5 2,2 1,4 2,1 1,9 1,4 1,6 1,2 1,7 2,4 2,3 2,6 1,9 1,9
WebPagetest
(WMhosts) 3,2 2,9 3,1 3,0 2,8 3,1 3,4 3,1 3,2 2,9 3,4 4,7 3,7 4,5 2,9
Dotcom-monitor 2,7 2,2 2,1 2,6 2,6 2,6 2,3 2,9 2,8 3,5 3,2 2,3 2,5 2,3 2,2
Table 6 Website speed test results in location "New York, USA"
Service before midday page load speed [s] afternoon evening
Pingdom 1,8 1,0 1,5 1,1 1,1 1,5 1,1 1,2 1,1 1,1 4,8 4,1 4,3 4,4 4,3
WebPagetest (NYI) 2,3 1,8 1,9 2,4 1,8 2,4 1,8 1,9 1,8 1,8 2,3 1,8 1,9 1,7 1,7
Dotcom-monitor 2,5 1,6 1,2 1,4 2,5 1,2 1,5 1,0 1,5 2,1 3,9 2,8 3,1 1,7 1,4
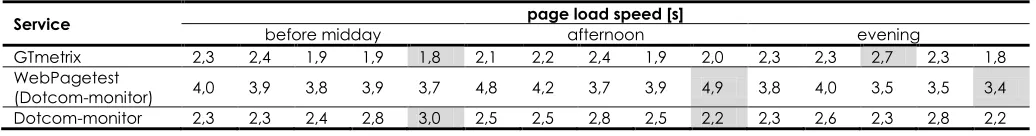
Table 7 Website speed test results in location "Hong Kong, China"
Service before midday page load speed [s] afternoon evening
GTmetrix 2,3 2,4 1,9 1,9 1,8 2,1 2,2 2,4 1,9 2,0 2,3 2,3 2,7 2,3 1,8
WebPagetest
(Dotcom-monitor) 4,0 3,9 3,8 3,9 3,7 4,8 4,2 3,7 3,9 4,9 3,8 4,0 3,5 3,5 3,4
3.2 Results for the Same Service
This sub-section offers results grouped according to the used service (speed testing tool). WebPagetest is excluded from these results, because most of the locations were provided by external services, while in
the remaining cases the servers were owned by the respective service and consequently there exists an association among them. From the fifteen values in each row, the maximum and minimum is slightly coloured to show differences in values, the same as in the previous section.
Table 8 Website speed test results by service "Pingdom"
Location before midday page load speed [s] afternoon evening
Amsterdam, Netherlands 1,1 0,8 0,8 0,9 0,8 1,1 0,8 0,8 0,8 0,8 1,1 0,8 0,9 0,8 0,8
Stockholm, Sweden 0,8 0,7 0,9 0,7 0,9 1,0 0,7 0,7 0,8 0,7 1,0 0,7 0,8 0,7 0,7
New York 1,8 1,0 1,5 1,1 1,1 1,5 1,1 1,2 1,1 1,1 4,8 4,1 4,3 4,4 4,3
San Jose, California 3,2 1,0 2,2 1,8 2,2 1,1 0,9 0,9 1,0 0,9 2,7 1,8 1,0 2,0 1,5
Dallas, Texas 1,4 0,8 1,2 0,8 0,8 1,2 0,8 0,8 0,8 0,8 3,1 2,9 3,1 2,9 3,2
Melbourne, Australia 2,2 6,4 2,6 2,3 2,2 4,6 2,2 2,2 2,3 2,2 5,8 2,9 2,9 2,9 2,9
Table 9 Website speed test results by service "GTmetrix"
Location before midday page load speed [s] afternoon evening
London, UK 2,0 2,5 2,2 1,4 2,1 1,9 1,4 1,6 1,2 1,7 2,4 2,3 2,6 1,9 1,9
Dallas, USA 1,9 1,5 1,5 1,4 1,5 1,4 1,6 1,4 1,3 1,4 1,4 1,5 1,3 1,8 1,7
Sao Paulo, Brazil 3,8 5,7 5,1 3,9 4,5 6,8 4,8 6,9 6,5 6,6 8,7 7,0 9,9 7,4 5,9
Sydney, Australia 4,8 4,4 4,3 4,1 4,4 5,5 5,9 5,4 4,9 4,6 4,6 4,2 5,7 4,3 4,4
Hong Kong, China 2,3 2,4 1,9 1,9 1,8 2,1 2,2 2,4 1,9 2,0 2,3 2,3 2,7 2,3 1,8
Table 10 Website speed test results by service "Dotcom-monitor"
Location before midday page load speed [s] afternoon evening
Amsterdam, Netherlands 2,6 2,3 2,0 2,4 2,4 2,5 2,4 2,2 2,5 2,3 6,8 6,5 6,9 6,6 7,3
London, UK 2,7 2,2 2,1 2,6 2,6 2,6 2,3 2,9 2,8 3,5 3,2 2,3 2,5 2,3 2,2
Paris, France 2,8 2,4 3,0 2,7 2,4 3,0 1,9 2,2 1,9 1,9 7,0 8,8 13,6 7,8 6,3
Frankfurt, Germany 2,8 2,9 2,4 4,2 2,6 2,0 3,0 2,1 1,9 2,1 6,7 7,0 8,0 3,2 6,2
New York 2,5 1,6 1,2 1,4 2,5 1,2 1,5 1,0 1,5 2,1 3,9 2,8 3,1 1,7 1,4
Hong Kong, China 2,3 2,3 2,4 2,8 3,0 2,5 2,5 2,8 2,5 2,2 2,3 2,6 2,3 2,8 2,2
California, USA 1,4 1,6 1,7 1,7 1,9 1,8 1,7 11,9 1,4 1,3 3,0 3,0 11,5 3,0 3,1
Texas, USA 2,1 2,9 2,4 2,9 2,5 2,1 2,3 2,5 2,3 2,0 3,7 3,5 3,6 3,1 3,0
Colorado, USA 1,7 1,6 3,5 1,7 2,4 2,6 2,3 1,6 2,6 1,7 3,7 2,1 1,8 2,6 2,2
Virginia, USA 2,5 2,2 5,1 2,5 2,6 3,8 3,6 3,0 3,4 3,7 7,2 6,1 7,4 6,2 6,5
Montreal, Canada 2,7 2,7 2,3 2,6 2,5 5,7 5,4 2,7 2,2 2,7 1,8 2,6 2,3 2,1 2,5
Buenos Aires, Argentina 15,5 7,8 8,3 8,4 6,8 18,0 10,5 25,4 6,7 8,7 20,3 5,9 6,8 14,3 10,5
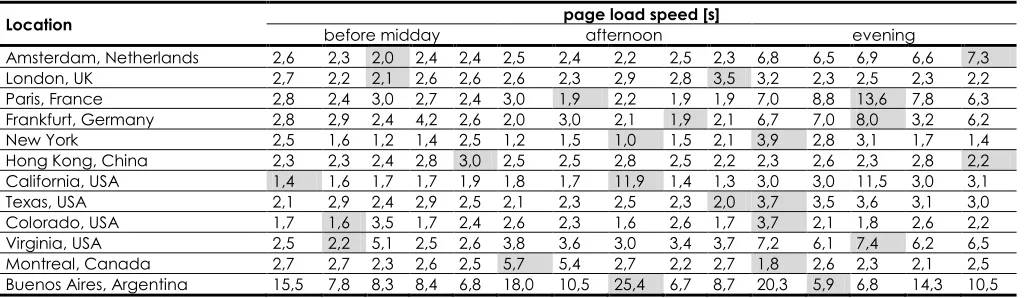
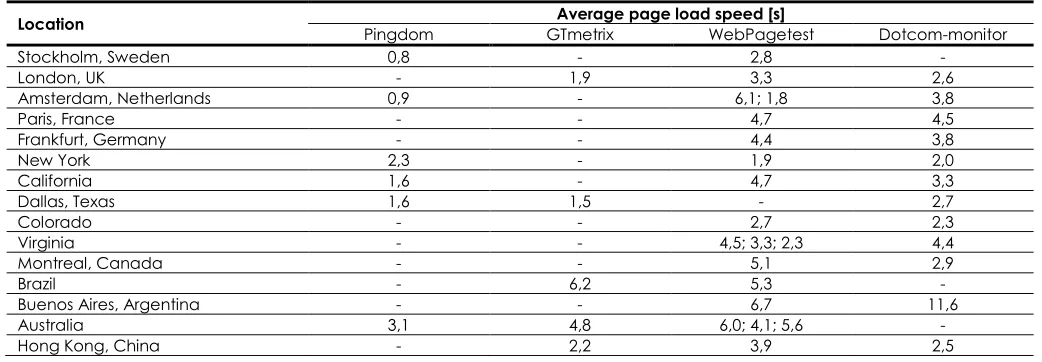
3.3 Averages for all Combinations
In this sub-section we present results in an aggregated form. The numbers in Table 11 are averages from all 15 values gathered for the specific combination of service and location. Of course not all services offered all locations, for these combinations we have no values (marked as "-"). More average values in case of
WebPagetest (by offering more external services in one location) are separated by ";".
Table 11 Averages for speed test results
Location Pingdom GTmetrix Average page load speed [s] WebPagetest Dotcom-monitor
Stockholm, Sweden 0,8 - 2,8 -
London, UK - 1,9 3,3 2,6
Amsterdam, Netherlands 0,9 - 6,1; 1,8 3,8
Paris, France - - 4,7 4,5
Frankfurt, Germany - - 4,4 3,8
New York 2,3 - 1,9 2,0
California 1,6 - 4,7 3,3
Dallas, Texas 1,6 1,5 - 2,7
Colorado - - 2,7 2,3
Virginia - - 4,5; 3,3; 2,3 4,4
Montreal, Canada - - 5,1 2,9
Brazil - 6,2 5,3 -
Buenos Aires, Argentina - - 6,7 11,6
Australia 3,1 4,8 6,0; 4,1; 5,6 -
Hong Kong, China - 2,2 3,9 2,5
3.4 Recommendations
The majority of the presented performance issues can be solved. However we need to distinguish between an ignorance or inactivity regarding online performance and design intent with calculated balance between website attractiveness and performance on the other hand. In this section will be summarized and proposed some of the general available solutions, which can be safely applied without further investigation done by speed tests.
3.4.1 Images
The best recommendation concerning images would be of course not using many images or at least not many large images. If we really want to keep large images on the websites, we should at least optimize their compression rate and avoid multiple images alternating in carousel which are hidden but still being downloaded with the first display of a website. Issue with many images on a website can be solved e.g. by technique called lazy loading, which delays loading of images in long web pages. Images outside of viewport will not be loaded before user scrolls to them [24]. User has thus access to more content without performance costs. This is useful technique, as presenting more information in one place on the website is presumed to reduce interaction cost and increase usability [45].
Another recommendation related to images is to specify image dimensions in code. Specifying a width and height for images allows for faster rendering by eliminating the need for unnecessary reflows and repaints [28]. The browser then has the information about dimensions before the image itself is downloaded and thus can reserve an exact amount of space for the particular image. The problem with specifying dimensions can emerge from responsive design, as the image can behave responsively only if it has not specified fixed dimensions.
Considering graphics, in the past many effects could be made only by Photoshop and similar editors and they resulted in extra files which had to be downloaded with the website. Nowadays web designers can use CSS3 and achieve similarly attractive results. Also maintaining a CSS3-based design is easier than making changes to background images through a graphics program [25]. It particular graphics cannot be achieved easily by CSS3, there is another technique, widely used in web design - CSS sprites. The core of this approach is making the number of image files lower by combining them. Individual images in the consolidated file are then specified in CSS by their position. Using CSS sprites reduces the number of delays in downloading other resources, reduces request overhead, and can reduce the total number of bytes downloaded by a web page [28].
3.4.2 Responsive Web Design
Handling of images is still an open issue in responsive web design, but there are several ways of serving different sizes of images to different devices (and thus saving loading time for smaller, slower, low bandwidth mobile devices). One of the solution is "Adaptive Images", which detects user's screen size and automatically creates, caches, and delivers device appropriate re-scaled versions of webpage's embedded HTML images [26].
Another improvement in loading speed would be to separate styles for individual resolutions and load them conditionally. It is also better to use mobile-first approach, which uses many default values, instead of desktop-first, which would overwrite all styles and then overwrite again, often to default values.
3.4.3 JavaScript Techniques
efficient is minifying the code. JavaScript minification is quite simple to do and saves on total file size of .js files (and also loading speed) [46]. HTML and CSS minifications are also possible and recommended. Minifying JavaScript or CSS has several benefits: reducing network latency, enhancing compression and faster browser loading and execution [28]. Minification is especially useful in first-time visits, when there is no cache yet, which reduces loading time in repeated visits [46]. Similar to minification is the possibility of compression. It allows content to be sent over the network in more compact form and can result in a dramatic reduction in download time [28].
Then there are of course best practices of how to optimize the code regarding performance, lying in the basics like use of variables, functions or loops.
We can improve loading speed by not including libraries and functions which the particular website does not need for its functioning. Also we can improve loading speed significantly by coding in pure JavaScript instead of coding with the help of a library, which however requires better knowledge of JavaScript. Barker showed a difference in performance (and also loading speed) between use of pure JavaScript and jQuery library (available at http://jquery.com/). He demonstrated e.g. 93% improvement of average benchmark time by using pure JavaScript to access the DOM in Firefox browser instead of using JQuery library [46].
3.4.4 Other Recommendations
Nagy [28] organized, categorized and summarized the optimization rules, presented as the best practices, based on several sources: Google Developer, Yahoo YSlow, books about High Performance Web Sites by Soulder and Even Faster Web Sites. As the most important (recommended by at least three of four sources) were identified these guidelines:
• Add Expires or Cache-Control Header
• Avoid CSS Expressions
• Avoid, minimize redirects
• Combine images using CSS sprites
• Configure ETags
• Enable Gzip compression
• Make Ajax Cacheable
• Make Fewer HTTP Requests
• Make JavaScript and CSS External
• Minify JavaScript and CSS
• Optimize images
• Parallelize downloads across domains
• Put Scripts at Bottom
• Put Stylesheets at Top
• Reduce DNS Lookups
• Remove Duplicate Scripts
• Use a Content Delivery Network (CDN)
Content caching is an interesting optimization technique. Browsers use a cache to reduce the number and size of HTTP requests, making web pages load faster [28]. Caching is important especially for
returning visitors. With the right settings, the website will load much faster in the repeated visits, because part of website's content is temporarily stored.
Content Delivery Networks (CDNs) are large distributed caches that are typically deployed at the edge of ISPs to reduce the latency between the end-host and the content [35]. Other definition of a CDN is: a collection of web servers distributed across multiple locations to deliver content more efficiently to users [28]. Sundaresan et al. revealed that sites with more expansive CDNs (e.g., Google, YouTube) have low median and maximum page load times,
whereas other sites have more variable
performance, both in the US and abroad [35]. It is apparent that page load time depends on many factors. Among them we can include the underlying network, the design of the website and the end host with the browser [35].
If we have no desire to go through all of rules and recommendations, we can help ourselves with those speed test services, which deliver recommendations specifically for the tested website. Egri and Bayrak [31] used PageSpeed Insights by Google for conducting website analysis for the site speed improvement. They made constructive changes according to received recommendations, e.g. using of CDN, minimization of HTML/CSS/JS files, use of CSS sprites, defining a header and avoiding DOM and iframe. Based on these and other recommended changes, the site speed improvements were raised from 43% to 79% [31].
Fong and Chung [34] improved the web page performance load time based on recommendations by WebPagetest, e.g. by enabling compression, serving scaled images and minifying HTML and CSS. Nagy [28] used GTMetrix in order to get optimization recommendations, which were e.g. minimization, compression, caching, CSS sprites and others. The summarized list of top recommendations is shown in Table 1.
Table 1 The summarized list of top recommendations
Area Recommendation
Images
use a reasonable amount of images of reasonable size (fast-loading)
use lazy loading when applicable specify dimensions of images (if not RWD) Images /
CSS use CSS3 instead of additional graphics when using graphics, use CSS sprites CSS minify CSS, put it externally at the top avoid CSS expressions
RWD prevent downloading unnecessarily sizeable graphics on mobile devices (e.g. Adaptive images, conditional loading,...)
JavaScript (JS)
use optimization techniques avoid overuse, unnecessary libraries make AJAX cacheable
4.0 CONCLUSION
We believe that our results confirmed all of the tested hypotheses.
The first hypothesis (1a values obtained by the same service and in the same browser and location slightly differ from each other) can be clearly seen in the set of individual values, beginning with Table 4 and ending with Table 10. The hypothesis (1b values obtained by the same service and in the same browser and location might contain a value, which significantly deviates from the rest) is also confirmed. For easier recognition, the maximum and minimum value in each row is slightly coloured. In this way, we can clearly see deviations in values.
The third hypothesis (2 values obtained by the same service, in the same browser but in different locations can even significantly differ from each other) and fourth hypothesis (3 values obtained in the same browser and location but by the different service can even significantly differ from each other) are confirmed as well. This can be seen both in tables with individual values (from Table 4 to Table 10) but also in overview with average values in Table 11, which shows all combinations of services and locations.
Our results indicate that the choice of service and location affects significantly results of website speed testing. This turns out to be a very serious issue in the case of comparing the test results, which we need in most cases. Either we need to compare between our website and competitive websites, or we compare previous versions of our site with the current one. Redesign of a website, which is a lengthy and costly process, is often based on these results, so it is very important that they are reliable. If we rely on default settings, we get significant hidden inaccuracies in the measured values, which are caused by inconsistent settings.
We can see another trend in the results as well - the effect of time of a day on results, possibly also the effect of different day of the week etc. In our case, the most pronounced difference was encountered during evening testing. You can notice that several sets of values have higher values in evening measurements (e.g. in Amsterdam by Dotcom-monitor, in New York by Pingdom, or in Sao Paulo by GTmetrix) (Table 8 and Table 9). Also the number of encountered errors and instances of unavailable services was higher in this time of a day. Further research is needed in this case.
Several recommendations originate from our results and confirmed hypotheses. These recommendations relate to use of website speed tests:
1) do not use speed tests with arbitrary default settings or inconsistent settings if you are serious about measuring the page load time
2) if you need to compare results in any way, choose one fixed combination of service, location and browser (or preferably more
combinations, however keep them properly logged and separated)
3) always make several test runs, not only one, preferably at least five, to reduce inconsistencies caused by issues, which we cannot influence.
4) out of the measured values, exclude the obvious
significant deviations
5) make the median or average from the remaining
values and take that as a result closest to the reality
Of course, before using any speed test service, you can look at general recommendations regarding website performance, which were discussed in this paper as well.
Even when the speed testing service, browser and location remain the same during several testing rounds, results slightly differ from each other. What causes all of the presented inconsistencies? It could be issues on the side of tested website - its design, dynamic behavior, delays in script executions, load on the website at the current moment (fluctuations of visitors), etc. It could be also issues on the side of testing server, deviations caused by settings, various delays, queue of requests, network fluctuations and many other unpredictable factors.
We cannot ensure consistent conditions for running website speed tests, however we should know about these issues and adapt our testing process accordingly. This way we can successfully limit inconsistencies in website's performance testing and comparisons
Acknowledgement
This work and the contribution were also supported by project “Smart Solutions for Ubiquitous Computing Environments” FIM, University of Hradec Kralove, Czech Republic (under ID: UHK-FIM-SP-2016-2102).
References
[1] Galletta, D., Henry, R., McCoy, S., Polak, P. 2004. Website Delays: How Tolerant Are Users? Journal Of The AIS. 5(1): Article 1.
[2] Rosen, D. E. and Purinton, E. 2004. Website Design: Viewing The Web As A Cognitive Landscape. Journal of Business
Research. 57: 787-794.
[3] Lee, Y. and Kozar, K. A. 2012. Understanding Of Website Usability: Specifying And Measuring Constructs And Their Relationships. Decision Support Systems. 52(2): 450-463. [4] Morkes, J. and Nielsen, J. 1997. Concise, Scannable, and
Objective: How to Write for the Web. Available from: http://www.useit.com/papers/ webwriting/writing.html. [5] Constantinides, E. 2004. Influencing The Online Consumer's
Behavior: The Web Experience. Internet Research. 14(2): 111-126.
[6] Gehrke, D., Turban, E. 1999. Determinants Of Successful
We Site Design: Relative Importance And
[7] Aladwani, A. 2006. An Empirical Test Of The Link Between Web Site Quality And Forward Enterprise Integration With Web Customers. Business Process Management Journal. 12(2): 178-190.
[8] Loiacono, E., Watson, R., Goodhue, D. 2007. WebQual: An Instrument For Consumer Evaluation Of Web Sites.
International Journal of Electronic Commerce. 11(3):
51-87.
[9] Cebi, S. 2013. Determining Importance Degrees Of Website Design Parameters Based On Interactions And Types Of Websites. Decision Support Systems. 54(2): 1030-1043.
[10] Green, D. T., Pearson, J. M. 2009. The Examination of Two Web Site Usability Instruments for Use in B2C eCommerce Organizations. Journal of Information Systems. 49(4): 19-32. [11] Palmer, J. 2002. Web Site Usability, Design, and Performance Metrics. Information Systems Research. 13(2): 151-167.
[12] Rose, G. and Straub, D. W. 1998. Predicting General IT Use: Applying TAM to the Arabic World. Journal of Global
Information Management. 6(3): 39-46.
[13] Cockburn, A. and McKenzie, B. 2001. What Do Web Users Do? An Empirical Analysis Of Web Use. International
Journal of Human-Computer Studies. 54: 903-22.
[14] Schenkman, B., Jönsson, F. 2000. Aesthetics And Preferences Of Web Pages. Behaviour and Information
Technology. 19(5): 367-377.
[15] Lindgaard, G., Fernandes, G., Dudek, C., Brown, J. 2006. Attention Web Designers: You Have 50 Milliseconds To Make A Good Impression! Behaviour and Information
Technology. 25: 115-126.
[16] Work, S. 2015. How Loading Time Affects Your Bottom Line. Available from: https://blog.kissmetrics.com/loading-time/.
[17] Lightner, N. J. and Eastman, C. 2002. User Preference For Product Information In Remote Purchase Environments.
Journal of Electronic Commerce Research. 3(3): 174-86.
[18] Kadlec, T. 2013. Implementing Responsive Design: Building
Sites For An Anywhere, Everywhere Web. Berkeley, CA:
New Riders.
[19] Nielsen, J. and Pernice, K. 2009. Eyetracking Web Usability.
New Riders Publishing, Thousand Oaks, CA.
[20] Marcotte, E. 2011. Responsive Web Design. A Book Apart. [21] Sarmiento, J. P. 2015. Web Design Shock. 11 Reasons Why
Responsive Design Isn’t That Cool! Available at:
http://www.webdesignshock.com/
responsive-design-problems/.
[22] Bartuskova, A., Krejcar, O. 2015. Loading Speed of Modern Websites and Reliability of Online Speed Test Services. Computational Collective Intelligence. Lecture Notes in Computer Science.. Springer. 9330: 65-74
[23] Souders, S. 2012. JavaScript Performance. Impact of
JavaScript. Available from:
http://www.stevesouders.com/blog/2012/01/13/javascript -performance/.
[24] Tuupola, M. 2011. Lazy Load. Available at:
http://plugins.jquery.com/lazyload/.
[25] Weyl, E., Lazaris, L., Goldstein, A. 2011. HTML5 & CSS3 For The Real World. SitePoint. ISBN:978-0-9808469-0-4.
[26] Wilcox, M. 2014. Adaptive Images. Deliver Small Images To
Small Devices. Available at:
http://adaptive-images.com/.
[27] gemiusRanking: Web Browsers. 2015. Available from: http://rankings.cz/en/rankings/ web-browsers.html. [28] Nagy, Z. 2013. Improved Speed on Intelligent Web Sites.
Recent Advances in Computer Science. 1(14): 215-220.
[29] Gheorghe, M. 2015. Software Quality Validation for Web Applications Developed Using Geographically Distributed Human Resources. Informatica Economica. 20(2/2015): 101-111.
[30] Miranda, F. J., Rubio, S., Chamorro, A., & Janita, M. S. 2012. The Use of Internet as a Marketing Tool - Evaluating the Websites of Spain's Top Restaurants. Proceedings of the International Conference on Data Communication Networking, e-Business and Optical Communication
Systems (ICE-B-2012). 109-114.
[31] Egri, G. and C. Bayrak. 2014. The Role of Search Engine Optimization on Keeping the User on the Site. Procedia
Computer Science. 36: 335-342.
[32] WebPagetest. 2015. WebPagetest Documentation. Using
WebPagetest. Available from:
https://sites.google.com/a/webpagetest.org/docs/using-webpagetest.
[33] Brown Sica, M., Beall, J. and McHale, N. 2010. Next Generation Library Catalogs And The Problem Of Slow Response Time. Information Technology And Libraries. 29(4): 214‐23.
[34] Fong, E. M. and Chung, W. Y. 2013. Mobile Cloud-Computing-Based Healthcare Service By Noncontact ECG Monitoring. Sensors (Basel). 13(12): 16451-16473. [35] Sundaresan, S., Feamster, N., Teixeira, R. and Magharei N.
2013. Measuring And Mitigating Web Performance Bottlenecks In Broadband Access Networks. Proceedings
ACM SIGCOMM IMC. 213-226.
[36] Meenan, P. 2013. How Fast Is Your Website.
Communications of the ACM. 56(4): 49-55.
[37] Leavitt M., & Shneiderman B. 2006. Research Based Web Design and Usability Guidelines. U.S. Government Printing Office.
[38] Weinschenk, S. 2011. 100 Things Every Designer Needs to Know About People. New Riders. ISBN: 978-0321767530. [39] Sixrevisions. Available from: http://sixrevisions.com/about/ [40] Gube, J. 2011. 20 Free Online Tools for Website Speed
Testing. Available from: http://sixrevisions.com/tools/free-website-speed-testing/.
[41] Pingdom Tools. 2015. Pingdom Website Speed Test. Available from: http://tools.pingdom.com/fpt/.
[42] WebPagetest. 2015. Test a website's performance. Available from: http://www.webpagetest.org/.
[43] GTmetrix. 2015. GTmetrix. Available from:
https://gtmetrix.com/.
[44] Dotcom-monitor. 2015. Dotcom-monitor website speed
test. Available from:
https://www.dotcom-tools.com/website-speed-test.aspx.
[45] Bartuskova, A., Soukal, I. 2016. The Novel Approach to Organization and Navigation by Using all Organization Schemes Simultaneously. Lecture Notes in Business Information Processing. Springer. 261: 99-106.
[46] Barker, T. 2012. Pro JavaScript Performance: Monitoring