ABSTRACT
THURMOND, BRANDI NICHOLE. Promoting Students’ Problem Solving Skills and Knowledge of STEM Concepts in a Data-Rich Learning Environment: Using Online Data as a Tool for Teaching about Renewable Energy Technologies. (Under the direction of committee co-chairs Dr. Shawn Holmes and Dr. John C. Park.)
This study sought to compare a data-rich learning (DRL) environment that utilized online data as a tool for teaching about renewable energy technologies (RET) to a lecture-based learning environment to determine the impact of the learning environment on students’ knowledge of Science, Technology, Engineering, and Math (STEM) concepts related to renewable energy technologies and students’ problem solving skills. Two purposefully selected Advanced Placement (AP)
Environmental Science teachers were included in the study. Each teacher taught one class about RET in a lecture-based environment (control) and another class in a DRL environment (treatment), for a total of four classes of students (n=128). This study utilized a quasi-experimental, pretest/posttest, control-group design. The initial hypothesis that the treatment group would have a significant gain in knowledge of STEM concepts related to RET and be better able to solve problems when compared to the control group was not supported by the data. Although students in the DRL environment had a significant gain in knowledge after instruction, posttest score comparisons of the control and
Promoting Students’ Problem Solving Skills and Knowledge of STEM Concepts in a Data-Rich Learning Environment: Using Online Data as a Tool for Teaching about Renewable Energy
Technologies
by
Brandi Thurmond
A dissertation submitted to the Graduate Faculty of North Carolina State University
in partial fulfillment of the requirements for the degree of
Doctor of Philosophy
Science Education
Raleigh, North Carolina 2011
APPROVED BY:
_______________________________ ______________________________
Dr. Shawn Holmes Dr. John C. Park
Committee Co- Chair Committee Co-Chair
DEDICATION
I want to dedicate this to my family who has been there to support and encourage me throughout the years in all of my endeavors. I dedicate this to my best friend and
BIOGRAPHY
Brandi Thurmond grew up in Indiana. It was during her high school years taking biology that she found her passion for science and for teaching. It was during these years that she also met her future husband. Brandi and her high school sweetheart moved to Florida after graduating high school where they attended college together.
Since a little girl, Brandi was interested in dolphins. In college, she majored in marine biology, where she studied dolphins and other marine life. After graduating with a B.S. in marine biology, she pursued a Master’s of Science and Teaching degree from Florida Atlantic University and began teaching high school and community college science courses. Two years later, Brandi and her high school sweetheart got married on the beach and moved to North Carolina.
After a couple of years teaching high school and community college science courses in North Carolina, Brandi decided to go back to school to pursue a PhD in Science
Education. During the last semester of her graduate coursework, Brandi was blessed with her baby boy, Brayden.
ACKNOWLEDGMENTS
As I started my journey in graduate school, I had no idea how many individuals would plant the seeds I needed to help me complete my dissertation. To those individuals I give thanks for the guidance and direction, support and encouragement, and words of wisdom along the way. I would like to thank my advisors Dr. Holmes and Dr. Park for hanging in there with me and seeing me through finishing my dissertation. Thank you to Dr. DeLuca for allowing me the opportunity to conduct research with the GridC project and to Dr. Annetta for the financial support. Thank you to Dr. Peterson for showing me the ropes when it came to writing an article for publication.
A special thanks to my family, without whom, I would not have been able to finish by my deadline. To my parents who came to take care of the little one so I could hide in my dissertation dungeon and write. Thank you to my husband for being understanding and for putting up with me through the ups and downs of graduate school. Thank you to my son for being such a trooper and enduring time away from mommy. You were the cutest distraction. I thrived on those smiles you gave me regardless of how long I was sitting at the computer working.
Although there were several professors who helped to prepare me for this culminating task of my graduate career, I would like to thank a few professors who taught me invaluable lessons to help me achieve my goal. Thank you Dr. Bonnie Fusarelli, for having us conduct a qualitative research study and write up the study from abstract to appendices in one
cannot,” to “I think I can,” to “I can.” Thank you to Dr. Jason Osborne for one of the most beneficial courses that I took during my graduate career. Just one summer in your course prepared me to conduct the quantitative data analysis for my dissertation. The book for your course was a great investment as well. Rest assured, the assumptions of the statistical tests I utilized were checked prior to running each test, to ensure I did not violate any of the test assumptions.
TABLE OF CONTENTS
LIST OF TABLES………...viii
LIST OF FIGURES………...ix
CHAPTER 1: INTRODUCTION………....1
Renewable Energy Education………2
Advanced Placement Environmental Science Curriculum………....4
Data Rich Learning Environments………6
Significance of Study………9
Purpose of Study……….10
Research Questions………..11
Hypotheses………...11
Assumptions………...11
Definition of Terms………..13
Summary………..14
CHAPTER 2: LITERATURE REVIEW………...15
STEM Education……….15
Renewable Energy Education………..17
Learning Environments………20
Data-Rich Learning Environments……….22
DRL- A form of Inquiry-Based Learning……….22
DRL Environments and Students’ Science Content Knowledge………..22
DRL Environments and Students’ Problem Solving Skills………..23
Using DRL Environments to Teach about RET……….………25
Summary……….26
CHAPTER 3: METHODOLOGY………...27
Research Design………..27
Hypotheses………27
Study Participants………28
Teacher Training……….31
RET Curriculum………..32
Traditional, Lecture-Based Learning Environment (Control Group)………33
Data-Rich Learning Environment (Treatment Group)………35
Data Collection………39
Pre-Instruction- Beginning Day One………..39
Instruction – Days One and Two ………39
Post-Instruction –Days Three and Four ………39
Instruments……….40
Student Information Sheet………...44
Data Analysis………...44
DRL and Students’ Knowledge of STEM Concepts……….45
DRL and Students’ Problem Solving Skills………...46
CHAPTER 4: RESULTS………...47
DRL and Students’ Knowledge of STEM Concepts Related to RET (RQ1)………..48
Equivalence of Control and Treatment Groups………...48
Effect of Treatment………...49
Confounding Variables………....50
DRL and Students’ Problem Solving Skills (RQ2)……….52
Equivalence of Control and Treatment Groups………...52
Effect of Treatment………...54
Confounding Variables………56
Summary………..57
CHAPTER 5: DISCUSSION………58
Students’ Prior Knowledge………..………60
Pedagogical and Technical Issues………63
Gender Differences………..65
Implications………..66
Future Research………...68
Summary………..69
REFERENCES………..70
APPENDICES………...78
Appendix A. Student Informed Consent……….79
Appendix B. RET Curriculum……….80
Appendix C. Example of Teacher Directions………..81
Appendix D. Pretest/Posttest………...82
Appendix E. Problem-Based Activity……….86
Appendix F. Reflective Questionnaire……….87
Appendix G. Student Information Sheet………..88
Appendix H. Questionnaire Coding……….89
LIST OF TABLES
Table 1. Demographic Comparisons of Control and Treatment Groups..…………...30
Table 2. Sample Sizes …………..……….47
Table 3. Equivalence of Control and Treatment Groups Onset Study ……….48
Table 4. Equivalence of Class Periods Onset Study ………49
LIST OF FIGURES
CHAPTER 1: INTRODUCTION
Observational studies have suggested that data-rich learning environments can
improve student learning about science and promote higher order thinking skills (Manduca & Mogk, 2002). Although a variety of instructional methods can be utilized to incorporate data into science classrooms, Manduca and Mogk (2002) have suggested that inquiry and
discovery based learning models support the effective use of data in classrooms.
Throughout the history of science education there have been movements towards implementing new teaching strategies into science classrooms to improve teaching and student learning, several of which have been short lived, as one teaching strategy is replaced by another. Further, there is often a gap between teaching strategies that promote learning as indicated in research, and what is actually being practiced in today’s schools. Recently, science education has moved away from direct instruction and rote memorization to constructivism and focusing on learning concepts through inquiry (DeBoer, 2000). Data-rich learning environments support inquiry based learning.
Data-rich activities can be used to engage students with issues […] in deep, interdisciplinary, inquiry-driven thinking that fosters the development of higher order critical thinking skills and enables integration of scientific reasoning into a student’s decision making and life reasoning (Maduca & Mogk, 2002, p. 12).
energy technology (RET), in secondary school science classrooms to promote students’ knowledge of Science, Technology, Engineering, and Math (STEM) concepts and students’ problem solving skills.
Renewable Energy Education
One of the competency goals of the North Carolina environmental and earth science curriculum is for students to be able to “analyze the sources and impacts of society’s use of energy,” including renewable and nonrenewable sources (p. 122). The world’s energy supplies, still primarily dependent on nonrenewable fossil fuels, have been linked to air pollution, water pollution, land degradation, and global climate change (Dincer, 1999). As a result of environmental degradation and the concerns over the use of foreign energy supplies, many nations are investing in alternative renewable energy resources, including solar, wind, hydroelectric, and biomass energy. Being one of the fastest growing energy technologies, it is important for educators to provide opportunities for students to learn about RET
(Daughtery & Carter, 2010). According to Daughtery and Carter (2010), “it is imperative that current students become aware of and familiar with emerging renewable energy technologies and how these technologies will continue to influence their lives in the 21st century” (p.24).
about energy concepts. The questionnaire data highlighted student difficulties understanding the basic concepts and ideas related to energy. The implication of such studies is that much of what is being learned by students in schools today is ‘shallow learning’ in that students are merely recalling information they were taught. Students engaged in shallow learning are unable to apply the knowledge they have learned to have a deeper understanding of the concepts. DRL environments afford the opportunity to engage students in deep learning about RET.
Despite the importance of teaching about RET across the sciences to promote students’ understanding of STEM concepts, studies have indicated little integration of
Advanced Placement Environmental Science Curriculum
Advanced Placement Environmental Science (APES) is meant to be equivalent to an introductory college level environmental science course that includes a lab component and is intended to be a rigorous, interdisciplinary course that teaches students about scientific principles related to environmental science. One of the goals of the APES curriculum is for students to identify and analyze solutions to environmental problems.
Unifying themes of APES include a) science as a process b) energy conversions c) the interconnectedness of Earth’s systems d) human alteration of the environment e) the role of social, cultural, and economic factors in environmental decision making and f) sustainability. Each of these unifying themes can be addressed by using online data to teach about
renewable energy technologies (RET). In using data to answer questions about RET, students are learning the process of science. By accessing, manipulating, and analyzing online data collected from RET, students are able to answer real-world problems surrounding RET. Students are able to learn about energy conversions as they investigate the amount of energy produced and energy efficiency of RET. Students can analyze meteorological data alongside data obtained from the RET, to investigate the effects of weather on RET, thus gaining an appreciation that Earth is an interconnected system. Students are able to
determine the amount of pollution that is avoided by using RET by using data collected from the RET. By examining energy consumption, production, and efficiency of RET, students learn about the cost and benefits of using RET. By using data to understand the
The APES curriculum covers a breadth and depth of topics. RET addresses several topics within the course. The RET curriculum covers topics in each of the goals.
I. Earth Systems and Resources
A. Earth Science Concepts (solar intensity and latitude) B. The Atmosphere (seasons; weather and climate) II. The Living World
E. Natural Biogeochemical Cycles (carbon) III. Population
B. Human Population
2. Population size (strategies for sustainability) 3. Impacts of population growth (resource use) IV. Land and Water Use
D. Other Land Use
1. Urban land development V. Energy Resources and Consumption
A. Energy Concepts (energy forms; power; units; conversions; Laws of Thermodynamics)
G. Renewable Energy (solar energy; solar electricity; wind energy; environmental advantages/disadvantages)
VI. Pollution
A. Air pollution (major air pollutants; measurement units) VII. Global Change
B. Global Warming (Greenhouse gases)
Although the learning environments for the control and treatment groups differed in the method designed to aid in teaching students about RET, the curriculum for both groups included activities and assignments designed by the researcher, a former APES teacher, and evaluated by a non-participating APES teacher, to ensure the same breadth and depth of coverage of topics and potential for developing knowledge related to RET. It was important that both groups of students had the same opportunities to learn the content in order to investigate the potential of DRL to be used as a tool for teaching students about RET. Since the students were higher level AP students, the curriculum was designed to be demanding, but within the students’ capabilities. Activities and assignments for both the treatment and control groups were designed to enhance students’ understandings of RET and allow students to learn in a collaborative environment when completing the in-class activities.
Data Rich Learning Environments
for technology” (p. 101). These standards address the need for students to be able to identify problems, analyze data, and present potential solutions to problems using science and
technology. The National Science Education Standards also address the need to teach students about science and technology. “Understanding basic concepts and principles of science and technology should precede active debate about the economics, policies, politics, and ethics of various science and technology-related challenges. However, understanding science alone will not resolve local, national, or global challenges.” (NSES, 1996, p. 199) Although there is an abundance of online data sources for teachers to utilize in their curricula to teach science concepts, the effectiveness of these data sources as a tool for teaching and learning has not been thoroughly researched. Smith, Campbell, and
Hoopingarner (2004) conducted a study to examine high school students’ engagement in an activity using data on the internet to solve scientific problems. Students were immersed in an inquiry activity, requiring students to interpret, evaluate, and apply online data to answer research questions and solve real problems in science. According to the authors of the study, “the internet has emerged in the last decade as a promising instructional tool that schools and teachers have been urged to employ in ways that encourage inquiry-based teaching” (p.9).
collect themselves. Thus, even though data mining does not require students to collect data firsthand, they are emulating the work of many scientists. (Smith, Campbell, & Hoopingamer, 2009, p. 11)
Used in the manner in which Smith, Campbell, and Hoopingamer (2009) describe, students can engage in data mining in order to investigate issues relevant to their lives. As an educational initiative, the College of Engineering at North Carolina State University created the NC Solar Center, which utilizes wind, biomass, and passive and active solar energy technologies. For over ten years, the Solar Center has provided educational materials to K-12 teachers. A project called Green Research for Incorporating Data in the Classroom (GRIDc), funded by an NSF grant, installed sensors at the Solar Center to monitor and collect data from the renewable energy technologies. For this study, curricular materials for the treatment group (DRL) were designed to allow for students to analyze, synthesize, and evaluate the data provided by the GRIDc project in order to investigate the potential of this data resource to be used in science classrooms to teach STEM concepts and promote problem solving skills among students. Initial results from a GRIDc pilot study (DeLuca, Carpenter, & Lari, 2010) indicated significant gains in students’ general knowledge about RET and students’ metacognitive performance. Although in its pilot stages, results from this study indicate that instruction that includes the use of the GRIDc online data has the potential to increase student knowledge of RET and problem solving skills. The current study further informs the aforementioned pilot study and provides greater insight into the types and depth of learning that occur in data-rich learning environments and the ability of these
Significance of Study
Richard A. Duschl, committee chair of The National Academies 2006 report: Major changes needed to boost K-8 science achievement, states that our
‘current teaching approaches are insufficient to launch students on a path to participation in a society infused with job opportunities in scientific and technical fields, as well as scientific issues such as alternative fuels, avian influenza, global warming, and nanotechnology. To improve science education, a curriculum coordinated across grade levels and broad changes in assessment and instruction are urgently needed’ (p. 1).
Results from a 2007 national education technology survey echoed concerns about the way science is currently taught in schools and concerns about students’ preparation for the workforce and decreasing interest in pursuing STEM careers. The national Speak Up survey collected responses from K-12 students, teachers, and parents to explore views of STEM education, 21st century skills, and the future of schools. The survey was a national survey on educational technology. Results from the survey suggest that the way science is currently taught in schools leaves much to be desired by students, including students’ desires to learn science through real-world problem solving and technology integration (Appel, 2007).
in this type of environment to teach about RET, supports the integration of math, science, and technology concepts, addressing the need for an integrated curriculum to increase students’ knowledge of STEM concepts and students’ interest in pursuing STEM careers.
Transforming science classrooms into DRL environments is a potential model for STEM instruction, preparing students with not only science content knowledge, but also with 21st century skills needed to be successful in science and technology related fields.
Purpose of Study
The purpose of this study was to compare a data-rich learning (DRL) environment that utilized online data as a tool for teaching about renewable energy technologies (RET) to a lecture-based learning environment to determine the impact of the learning environment on students’ knowledge of STEM concepts related to RET and students’ problem solving skills. To test this purpose, students in both groups were pre- and post-tested to investigate
Research Questions
1. Is there a significant difference in students’ knowledge of STEM concepts related to renewable energy between students in the lecture-based and students in the data-rich learning environments?
2. Is there a significant difference in students’ problem solving abilities between students in the lecture-based and students in the data-rich learning environments?
Hypotheses
Hypotheses for this study were that students taught in the DRL environment a) would have a significant gain in knowledge of STEM concepts related to RET and b) be better able to solve problems when compared to students taught in the lecture-based environment.
Null Hypothesis 1: There will be no significant difference in students’ knowledge of
STEM concepts related to renewable energy between students in the lecture-based and students in the data-rich learning environments.
Null Hypothesis 2: There will be no significant difference in students’ problem
solving abilities between students in the lecture-based and students in the data-rich learning environments.
Assumptions
and posttest gains. It was assumed that because the curricula materials for both groups were designed and evaluated to ensure students in the DRL and lecture-based learning
environment had the opportunity to learn the same concepts related to RET in their respective learning environments, that the posttest scores would be a valid measurement of the effect of the treatment on students’ knowledge and problem-solving skills. One of the factors that threatened the validity of the posttest was students being made aware that they were
participating in a research study and that student performance on the pre- and posttest would not count as a grade for the class, possibly affecting the time and effort students exerted in answering the questions to the best of their abilities. Thus, student scores on the pre- and posttest may not accurately reflect students’ knowledge of STEM concepts related to RET. By having a control group (lecture-based without the use of online data) to compare against the outcome of the treatment (using online data in a DRL environment) it is more likely that the differences in scores between the groups can be attributed to the teaching method utilized and not some other variable, although it is difficult to achieve a true control group in
educational research.
prior knowledge of RET was assumed to be equivalent from the onset of the study. It is likely; however, that previous coursework, interest in the topic, and media influences resulted in differences in individual students’ prior knowledge of RET. Pretest scores and
demographic variables were compared between the groups to test for equivalence.
The student population included in this study may not be representative, which would reduce the generalizability of the study. Since true randomization was not possible, two AP Environmental Science teachers from the same school were chosen to reduce selection bias and reduce variations due to underlying school factors. It is important to note that the students included in the study were AP students, so may not be representative of all
secondary school science students. The assumptions and limitations above demonstrate the complexity of educational research. Every effort was made during the study to address these limitations.
Definition of Terms
Data Rich Learning Environment – A data rich learning environment is defined as a learning
environment in which teachers integrate data analysis into the design of classroom instruction to enhance student learning.
Problem Solving Skills – This study defines problem solving skills as the ability to integrate
knowledge from a variety of subjects to solve a problem.
Renewable Energy Technologies (RET) – For the purpose of this study, the EPA’s (2009)
diminish and have short restoration times. Although these technologies still impact the environment, their impacts are small compared to nonrenewable energy sources.
Traditional, Lecture-Based Learning Environment – By design, the lecture-based learning
environment in this study was one where students were taught using lecture, class discussions, and activities to reinforce student learning. The lecture-based learning
environment was traditional in the sense that this learning environment consisting of lecture, discussions, and activities is traditionally used as the method for teaching APES.
Summary
CHAPTER 2: LITERATURE REVIEW
The following review of the literature provides an overview of Science, Technology, Mathematics, and Engineering (STEM) education, with a focus on renewable energy
education, and the effectiveness of lecture-based and constructivist learning environments in teaching and learning about STEM concepts. Data-rich learning (DRL) environments are presented as a constructivist learning environment that can be used to teach students STEM concepts related to renewable energy technology (RET) and promote students’ problem solving skills.
STEM Education
Science, technology, engineering, and mathematics (STEM) education initiatives are on the rise, with an aim to prepare today’s students with the 21st century skills needed to be successful in today’s workforce. President Barack Obama supported the STEM initiative and addressed the need for STEM education as one of the nation’s educational priorities in his 2011 State of the Union address (Schacter, 2011).
(Hollenbeck & Fisher, 2011), and can increase students’ knowledge of STEM concepts (Lou, Shih, Diez, & Tseng, 2011).
STEM education can also potentially benefit those considered to be minorities in science fields. According the 2011 National Science Foundation’s “Women, minorities, and persons with disabilities in science and engineering” report, females are underrepresented in science and engineering fields. Male students represent a higher percentage of students that enter STEM fields (Chen, 2009) and research suggests that males have more positive
attitudes toward STEM compared to females (Mahoney, 2010). In an effort to determine if problem-based learning (PBL) can increase female students’ knowledge of STEM concepts and attitudes towards STEM learning, Lou, Shih, Diez, & Tseng (2011) interviewed forty female 10th grade students involved in the Solar Electric Trolley contest. Results from an attitudinal survey and interviews indicated that the PBL environment helped to increase female students’ learning of and attitudes towards STEM.
However, there are some who have voiced concerns over integrating STEM into already established curricula. Brown, Brown, Reardon & Merrill (2011) conducted a survey-study with teachers and administrators to ascertain school faculty perceptions of STEM education. Results from the survey indicate a lack of understanding of STEM and lack of clarity in the vision of STEM education. Further, Williams (2011) discusses potential barriers to implementing a STEM curriculum, including integrating STEM concepts into an already packed curriculum, classroom design changes, and methods to assess students.
renewable energy technologies. Shining Star, a STEM education program associated with Indiana University, has shown that providing students with opportunities to engage with scientific data can increase student interest in and knowledge of STEM concepts. This three year curriculum initiative sought to integrate data-loggers into the curriculum. After
integrating data-loggers into the curriculum, increases in students’ interest in math and science courses and improved standardized test scores were noted (Hollenbeck & Fisher, 2011). According to Hopkinson & James (2010), teaching about sustainable development in STEM related subjects, though potentially difficult, has greater potential for boosting STEM education as the topic is economically and socially relevant.
Renewable Energy Education
Busby and Carpenter (2009) postulate that teachers are an important part of the solution and should provide students with opportunities to learn about alternative energy resources. Renewable energy education is relatively a new field, and according to Jennings (2009), there is a need to teach students about renewable technologies and the roles these technologies will play in the future. An important feature of energy-education programs is to include discussions of the socio-cultural, economic, and ecological impacts of these
technologies (Kandpal & Garg, 1999); however, “our education system has failed to give us a basic understanding of energy supply options and their impact on society and the
environment” (Jennings, 2009, p. 435).
Even though energy concepts are often confusing for students (Hong, 2006), energy education as it is currently taught still includes a superficial coverage of topics (Kandpal & Garg, 1999). The “introductory environmental science student is often left with a
fragmentary, confusing, and unsatisfactory introduction to energy concepts and terminology” (Hong, 2006, p. 44). Since misconceptions can hinder students’ success in solving problems (GE & Land, 2003), it’s important to examine common energy misconceptions among students. Lecture based teaching does little to correct alternate conceptions (Barab et al., 2009).
When deciding which method of teaching is best, one must consider the objective of renewable energy education and what the course of study recommends. According to Kandpal and Garg (1999), energy education programs should provide students with
(1996). The Advanced Placement Environmental Science (APES) curriculum (The College Board, 2010) dedicates 10-15% of the course to studying energy resources and consumption with topics including energy concepts (energy forms, power, units, conversions, Laws of Thermodynamics) and renewable energy (environmental advantages/disadvantages). According to The College Board (2010), activities should be linked to major concepts in science and allow for students to observe how systems work by collecting and analyzing data. Further, activities should challenge students’ abilities to critically think, analyze and interpret data, and apply concepts to solve environmental problems (The College Board, 2010).
In a 2005 paper “Energy, Society, and Education, with an Emphasis on Educational Technology Policy for K-12,” Chedid discusses society’s dependence on energy, the need for developing renewable energy technologies to potentially avert future an economic and
energy crisis, and the importance of education in developing energy technologies.
“Education is a key factor for technology development – including technology for efficient, clean, and economical energy generation, transportation, storage, and use” (p. 79). Chedid’s position that the solution to the nation’s energy problem is education prompted the
Learning Environments
There are several pedagogical approaches to teaching science. Whereas lecture-based approaches to teaching and learning are considered to be passive learning (Amador & Gorres, 2004; Barab et al., 2009), constructivist approaches are considered to be student centered approaches that actively engage learners and promote a deeper understanding of concepts. According to Savery and Duffy (2001), problem-based learning (PBL) is an exemplar of a constructivist learning environment. Barrows and Kelson (1993), in response to complaints about the status of education and the need for new educational techniques, describe PBL as a total approach to education, one that has the potential to replace traditional lecture based approaches to promote students’ conceptual knowledge and higher order thinking skills.
Active learning can take on many different forms from interactive lectures, collaborative group learning, class discussions, or interactive computer-based learning. McManus, Dunn, and Denig (2003) conducted a research study using a counterbalanced design with 60 tenth grade students, to compare student attitudes and learning of science in three different teaching methods. Results from the study indicated positive attitudes and improved science achievement when students self-taught using either teacher-created or student-created instructional materials compared to students taught using traditional instruction, consisting of lecture and class discussions.
grades were higher in the active learning sections, that students perceived they learned less in that environment. Students in the active learning environment also perceived the instructor to be less effective. Students reported no differences in perceptions about course difficulty. Active learning defined in this study was supplementing lecture with class discussions.
Although research studies have shown the benefit of constructivist learning
environments, teachers still rely predominately on teacher-centered learning environments. As teaching behaviors do not reflect current trends in science education, it is important to investigate the factors that support or hinder implementing constructivist learning
environments. A study on teacher, student, and parent preferences for learning environments was conducted to determine perceptions of stakeholders in the Dutch educational system. Questionnaires were given to 285 teachers, 951 students, and 636 parents to determine preferences for direct instruction, discovery learning, and authentic pedagogy. Results indicate that teachers and parents alike, preferred direct instruction. Multiple regressions analysis revealed that the teacher’s own preference for learning was a predictor of the teacher’s use of direct instruction as a teaching method. (Roelofs,Visser, & Terwel, 2003) As there are several pedagogical approaches that could be implemented to teach
Data-Rich Learning Environments
DRL- A form of Inquiry Based Learning
Studies on how students best learn science provide a framework for answering the question: Why should students be given the opportunity to learn in a data-rich environment? Edelson (2001) describes learning for use. Learning for use motivates students and allows students to construct meanings about scientific concepts in a meaningful way. Three stages of learning for use are motivating students, constructing knowledge from experience, and organizing knowledge for accessibility and usability.
Although there is an abundance of online data sources for teachers to utilize in their curricula to teach science concepts, few studies have examined the effectiveness of these data sources as a tool for teaching and learning. Smith, Campbell, and Hoopingarner (2004) conducted a study to examine high school students’ engagement in an activity using data on the internet to solve scientific problems. Students were immersed in an inquiry activity, requiring students to interpret, evaluate, and apply online data to answer their research question and solve real problems in science. According to the authors of the study, “the internet has emerged in the last decade as a promising instructional tool that schools and teachers have been urged to employ in ways that encourage inquiry-based teaching” (p.9). Used in the manner in which Smith, Campbell, and Hoopingamer (2009) describe, students can engage in data mining in order to investigate issues relevant to their lives.
DRL Environments and Students’ Science Content Knowledge
data from the US Geological Survey (USGS). Analysis of student discourse revealed that students utilizing textbook data were able to interpret and link textbook data to concepts they were learning about in class, but did so using lower inference level argumentative discourse. This was compared to the complexity of student discourse when USGS data were utilized.
Ucar, Trundle, and Krissek (2011) employed a mixed methods study with 79 preservice teachers to determine the potential for online tidal data to be utilized in inquiry-based instruction to improve understanding of concepts related to tides. Quantitative data analysis consisted of a pre- posttest design to access pre-service teachers’ knowledge before and after instruction. Qualitative data analysis included post-instruction interviews.
Findings of the study support the use of online data to promote conceptual change. DRL Environments and Students’ Problem Solving Skills
Problem solving is defined as being able to make observations and judgments about a problem, as well as, plan, implement, and devise solutions to the problem (Moriyama, Satou, & King, 2002). GE and Land (2004) described problem solving abilities as being able to recognize problems, identify solutions, justify and evaluate proposed solutions. Further they describe the cognitive and metacognitive processes required during problem solving. Both domain-specific (knowledge of specific concepts) and structured knowledge (knowledge of how concepts relate to prior experiences) are part of the cognitive processes required during problem solving. Gijbels, Dochy, Bossche, and Segers (2005) describe the cognitive
components of problem solving as declarative knowledge (knowledge of concepts),
Problem solving requires metacognitive processes. Metacognition is ability to reflect upon, understand, and control one’s learning and includes two components: knowledge about cognition and regulation of cognition. Knowledge about cognition includes declarative knowledge (potential strategies), procedural knowledge (how to use those strategies), and conditional knowledge (when to use those strategies); whereas regulation of cognition
includes the ability to plan and evaluate (Schraw & Dennison, 1994). In addition to planning and monitoring one’s cognition, motivation, perceived self-efficacy, and perceived attraction to task, may also be important in regulating cognition (Gijbels, Dochy, Bossche, & Segers, 2005). When given a problem to solve, students must be aware of what knowledge they already have to help them solve the problem and knowledge they are lacking in, that they need in order to solve the problem. According to GE and Land (2004), students with greater metacognitive abilities are better able to solve problems because they are able to develop more hypotheses when solving problems. Schraw and Dennison (1994) postulate that more metacognitively aware students are better able to perform, because they are more strategic in solving problems. Thus, metacognitive knowledge may be more important than domain-specific knowledge when solving problems (GE & Land, 2004).
studies have investigated the potential of data-rich learning environments in promoting students’ problem solving skills.
Tulloch and Graff (2008) conducted a case study with middle and high school
students to evaluate the potential use of Green Map as a tool for teaching students geographic concepts and spatial cognition in a rich environment. The researchers designed data-based learning activities to accompany the Green Map database to investigate the opportunity for learning using the online data resource. Case study data revealed the potential for data to be utilized in a PBL as an instructional tool for to engage students in problem solving and critical thinking.
Using DRL Environments to Teach about RET
environments on students’ knowledge of STEM concepts related to RET and students’ problem solving skills.
Summary
Today’s society requires students to be able to solve complex problems. Renewable energy education is imperative for students, as one of the problems facing today’s society is an increased demand and decreasing supply of nonrenewable energy resources, and the environmental degradation associated with using these energy resources. Although
CHAPTER 3: METHODOLOGY
The purpose of this study was to compare a data-rich learning (DRL) environment that utilized online data as a tool for teaching about renewable energy technologies (RET) to a lecture-based learning environment to determine the impact of the learning environment on students’ knowledge of Science, Technology, Engineering, and Math (STEM) concepts related to RET and students’ problem solving skills.
Research Design
A quasi-experimental, pretest/posttest, control-group design (Campbell & Stanley, 1963) was employed to answer the following research questions:
1. Is there a significant difference in students’ knowledge of STEM concepts related to renewable energy between students in the lecture-based and students in the data-rich learning environments? (RQ1)
2. Is there a significant difference in students’ problem solving abilities between students in the lecture-based and students in the data-rich learning environments? (RQ2)
Hypotheses
Null Hypothesis 1: There will be no significant difference in students’ knowledge of
STEM concepts related to renewable energy between students in the lecture-based and students in the data-rich learning environments.
Null Hypothesis 2: There will be no significant difference in students’ problem
solving abilities between students in the lecture-based and students in the data-rich learning environments.
Study Participants
Earth and environmental science are taught in grades 9 through 12 in North Carolina Public Schools. To meet high school graduation requirements, students must take either earth science or environmental science. Earth science is the first high school science course that most incoming freshmen take, while environmental science is usually taken by students in grades 11 and 12 who enroll in Advanced Placement Environmental Science (APES).
Two APES teachers teaching at local high school in Wake County, North Carolina, were recruited to participate in this research study. The teachers included in the study were purposefully selected based on the number of years teaching APES, teaching schedules, and typical coverage of RET in their classrooms. Both teachers had been teaching APES for three years, taught at the same school on block schedule (90-minute periods), spent 3-5 class periods covering RET, and taught about RET using primarily lecture format with
supplemental activities.
impacts of using online data to learn about RET. The goals of the research study were disclosed to students and parents/guardians prior to participation via an informed consent (see Appendix A). Since the curriculum implemented during the study also served as students’ regular class instruction on RET, students were informed that the activities and assignments associated with the study curriculum would be collected for a grade. Although participation in the study was voluntary, students were also informed that even if they did not wish to participate in the study, that they would still be participating in and given a grade for the activities that were assigned for homework and activities completed in-class during the study period. Administered pre- and posttest did not count towards either participating or non-participating student’s grades and students for whom informed consent forms were not obtained, data were not included in the study.
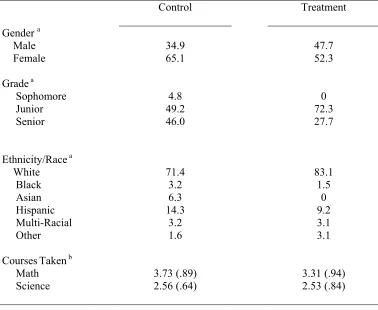
In total, 131 students, distributed among four APES classes participated in the study, for a participation rate of 97.8%. While student demographics in individual teachers’ classes could not be controlled, students in each class were comparable in terms of overall school demographics. Students included in the study attended a suburban secondary school, with a predominately Caucasian (78.5%) population of students. The school was designated a School of Excellence, with High Growth for the 2009-2010 school year, and had an Advanced Placement (AP) course enrollment of 5% of the student population.
Hispanic (3.1%), Multi-racial (3.1%), Black (2.3%), and other (2.3%). Table 1 shows comparison in demographic variables in the treatment and control groups.
Table 1
Demographic Comparisons of Control and Treatment Groups
Control Treatment
Gender a Male Female
34.9 47.7
65.1 52.3 Grade a
Sophomore Junior Senior
4.8 0
49.2 72.3 46.0 27.7
Ethnicity/Race a White Black Asian Hispanic Multi-Racial Other
71.4 83.1
3.2 1.5 6.3 0 14.3 9.2 3.2 3.1 1.6 3.1 CoursesTaken b
Math Science 3.73 (.89) 2.56 (.64) 3.31 (.94) 2.53 (.84) Notes: a Percentages b M (SD)
In order to investigate the potential of using online data as a tool for teaching about RET to promote students’ knowledge of STEM concepts related to RET and students’
environment (control) or in a DRL environment (treatment). Prior to the research study, it was determined that due to school administration scheduling, one of the participating teachers would be teaching three sections of APES, while the other participating teacher would only be teaching one section of APES during the fall semester. To ensure both teachers were able to teach one class in the DRL and one class in the lecture-based learning environment, during the timeframe of the study, the teachers switched fourth period classes, so that each teacher would be able to teach two classes of APES. During the teacher training, class periods were randomly assigned to either the DRL or lecture-based learning environment, ensuring both teachers had a class period that would serve as the control (periods 2 and 3) and a class period that would serve as the treatment group (periods 1 and 4). Teacher A taught periods 1 (DRL) and 2 (lecture-based), while teacher B taught periods 3 (lecture-based) and 4 (DRL).
Teacher Training
One week prior to the study, teachers were provided with all the curriculum materials, including a) a binder with the RET curriculum outline and teacher directions b) a flash drive that contained the lecture materials and c) student copies of all of the activities and
assignments for the study period. In addition to receiving the lectures in PowerPoint format, a video of the researcher going through the PowerPoint was also included. This video was meant to give teachers an idea of the flow and coverage of RET utilizing the PowerPoint. Teachers were not provided with copies or shown the pretest, posttest, questionnaire, or student information sheet prior to, during, or after the research study in order to reduce the likelihood that teachers would teach to the test, thereby contaminating the results of the study.
RET Curriculum
The RET curriculum that was implemented during the research timeframe was developed by the researcher, a former APES teacher who had taught APES for three years. Decisions about the content and activities to include in RET curriculum for the study period began with a focus on goals and unifying themes mentioned in Chapter 1. Lab criteria were utilized to aid in the design of the DRL environment GRIDc data activity. Activities, assignments, and lectures were created using online resources, APES textbooks, APES printed materials, and released materials from The College Board.
An APES teacher, who had been teaching for 25 years, taught the APES course since its development, and who had served as an APES exam reader for two years, was recruited to evaluate all of the curricular materials prior to the onset of the study to ensure that both the control and treatment groups of students were presented with the same content over the three day study period, and to ensure that the pretest and posttest reflected the concepts being taught to both groups.
The two learning environments the participating teachers utilized to teach about RET are described below.
Traditional, Lecture-Based Learning Environment (Control Group)
was a tour of the North Carolina Solar Center, and the other video was a short clip discussing the amount of energy a solar panel could produce. After the lecture, students completed an in-class activity for which they had to calculate a sample household’s energy consumption for a week. Students were assigned a two part assignment to complete for homework on day 1. The first part of the assignment required students to obtain an electric bill to figure out how much energy their household used for a month and the cost per kilowatt-hour. For the second part of the assignment, students were required to track the electrical appliances they used throughout the day and calculate the energy and cost of running those appliances for a day.
Day two of the study, students learned about solar energy, again in a lecture, discussion format. The lecture included an overview of solar energy technology and a discussion of a) the amount of pollution avoided by using solar energy b) solar power versus solar energy c) the efficiency of solar arrays d) components of a photovoltaic system and e) factors that affect the power output of a solar array. Students watched an online lecture that discussed the design of sunspaces for homework on day two, in order to answer three
questions about passive solar house designs.
The three day curriculum primarily focused on solar energy technologies, with a brief overview of the other RET through the video tour of the NC Solar Center. Due to the over-packed curriculum and fast-paced nature of the APES course, the participating APES teachers typically would not devote two days to studying only solar energy technologies. The researcher chose to narrow the focus of the RET curriculum to solar energy technologies to allow both groups to have a deeper understanding of solar energy. The depth of
understanding of solar energy was determined by the researcher by evaluating released APES exams and curricular materials provided by The College Board (1998, 2003, 2005, 2006).
Data-Rich Learning Environment (Treatment Group)
opportunity to learn how to manipulate, graph, and analyze data. Since the NC Solar Center had closed due to budget cuts two months prior to the study, students used archived data instead of real-time data to learn about RET systems. The DRL activities created for this study were constructed around the usage of the GRIDc data and were based on the same STEM concepts related to RET that the control students were exposed to during lectures.
Following the pretest on day one, students went to a computer lab to complete an activity that required students to utilize data from the GRIDc project to calculate how much energy was produced by the NC Solar Center’s RET over a period of one week, how much energy the solar house consumed during that same period, and what percentage of the solar house’s energy was supplied by RET. This activity was primarily designed to allow students the opportunity to begin exploring the GRIDc website to become familiar with accessing and manipulating the data to answer questions about RET.
Prior to beginning the activity, it was intended for students to watch the video tour of the NC Solar Center that the control group watched during lecture, to provide students with an overview of the RET from which data were being collected for students to access and analyze. Due to technological issues with slow servers and video buffering, the video was unable to be viewed by period 1. To ensure both periods 1 and 4 received the same
treatment, the video was postponed to day three for both periods. The homework assignment for day one was the same as was assigned to the control group.
On day two, students in the DRL environment spent the 90-minute class period in the computer lab utilizing data from the GRIDc project to answer five questions about
the data to investigate a) the relationship between power and energy, b) the efficiency of PV power output, c) factors affecting PV power output, and d) the environmental impact of using solar energy technologies, such as PV systems. Besides being provided with a brief
introduction to the GRIDc website and instructions on how to access the data, students were not given explicit verbal instruction on which data to analyze or how to analyze the data to answer the activity questions.
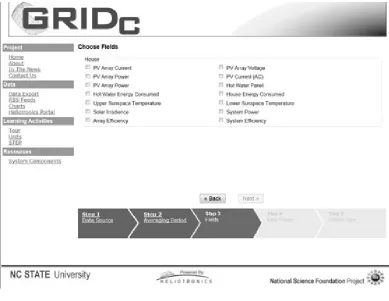
Since it was important to be able to monitor and evaluate how students arrived at the answers to the questions, students were asked to write the exact steps they took to answer the questions, including the a) the data source - house, annex, or garage b) averaging period - hour, day, week, month c) fields - variables used for the analysis d) date range and e) output type – graph or table used to manipulate and visualize the data. Figure 1 shows the GRIDc website interface students used to export the data. Students were assigned the same
Figure 1. GRIDc website
Over the three day study period, the treatment group accessed the GRIDc data for three separate activities, for which students calculated a) household energy consumption b) the amount of energy that could be supplied by wind and solar RET c) the amount of
pollution avoided by using RET d) the relationship between power and energy e) the effects of weather on the power output of solar arrays f) periods for which the solar array produced the most electricity g) the efficiency of solar arrays at converting sunlight into electricity and h) passive solar design features. These were the same concepts that students in the control group were taught in the lecture-based learning environment. Students in the DRL
Data Collection
Pre-Instruction- Beginning Day One
Students in both the control (lecture-based) and treatment (DRL) groups were given a researcher-constructed pretest consisting of 15 multiple-choice and five short answer
questions (see Appendix D) prior to instruction about RET to assess students’ prior
knowledge of STEM concepts related to RET. The questions on the pretest were designed using APES curricular materials. The pretest was administered by the researcher and students were informed by the teacher to try their best, but that the test would not count for a grade. Students took 15-30 minutes to answer the twenty-question pretest. The pretest will be discussed further in the next section of this chapter.
Instruction – Days One and Two
Teachers introduced RET to their respective classes using the DRL instructional approach for one class and a lecture-based approach for the other class. Although student work from in-class activities and assignments during the study period was collected, it was not used to inform this study.
Post-Instruction – Days Three and Four
Students were assigned an AP free response question from a released APES exam for homework on day three. The free response question required students to read a short
document and answer questions using the information in the document and what students had learned in class about RET. Students were directed to complete the assignment without using any outside sources and were informed that it was a practice question and would not be graded right or wrong. Students were not given any instruction or coached on how to answer the free response question and had not been assigned a free response prior to this assignment.
The final day of the study, a posttest was administered to both groups containing the same questions as the pretest. To reduce the likelihood that students would simply recall from memory their answers from the pretest, questions and answer choices were re-ordered. In addition to taking the posttest, students were given a reflective questionnaire (see
Appendix F) to indicate students’ level of agreement with statements related to their learning about RET, problem solving abilities, and 21st century skills. Demographic information about students was obtained the last day of the study using a student information sheet (see
Appendix G).
Instruments
Pretest/Posttest
study. Items on the pre- and posttest were constructed based on course objectives and the content delivered during the study period. The face validity of the pretest/posttest was determined by the APES teacher recruited to evaluate the RET curriculum. Evaluation of the curricular materials in conjunction with pretest/posttest assessments revealed equal
opportunities for students in both groups to perform on the questions. Although three questions were noted for which one group might be more at an advantage than the other group, no significant difference between the groups was found when conducting an
independent samples t-test on students’ posttest scores for those particular questions. Item analysis on the multiple choice questions was conducted to determine item difficulty, discrimination, and item response patterns. Multiple choice questions had a range of difficulty values from 34.4% to 90.6%, with the average difficulty index being 59.9%. The discrimination index for the multiple-choice questions ranged from .16 to .49, with an average discrimination index of .29. Internal consistency was estimated independently for the pretest and posttest using the Cronbach alpha coefficient, and was found to be .36 and .47 respectively. This low variance is likely attributable to students truly being close in their ability levels. Alpha has also been shown to increase with test length. The test utilized for this study included fifteen multiple choice questions, measuring different types knowledge, resulting in low correlation between the test items, likely resulting in an underestimation of the reliability of the testing instrument.
Problem-Based Activity
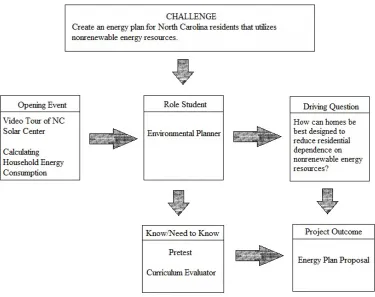
residents of North Carolina. Students were asked to consider several points as they outlined their proposal. The points students needed to consider to create their proposal were either directly taught through lecture or indirectly taught through student analysis of the GRIDc data. There were a couple of points students needed to address that were not taught to either group during the study period to get students to think about the social costs of implementing their proposed residential energy plans. Curricular materials for the control and treatment groups were evaluated by the participating APES teachers and it was determined that the desired objective of the problem-based activity was met and that both groups had covered the same concepts needed to address each of the points outlined in the activity. The problem-based activity was designed utilizing the STEM instructional framework described by Setser (2010). Students were given a challenge to create an energy plan for NC residents (see Figure 2). The opening event that set the stage for the problem-based activity was a video tour of the NC Solar Center that the control group of students watched on day one and that the treatment group of students watched on day three prior to the activity. In addition, both groups of students had calculated their household energy consumption for an assignment on day one. For the activity, students were placed in the role of renewable energy
environmental planner. The driving question of the activity was how homes in North Carolina could be best designed to reduce residential dependence on nonrenewable energy resources. Working in partners, students utilized prior knowledge and what they had learned during the lesson on RET to come up with an energy plan proposal for NC residents.
Figure 2. STEM educational framework for problem-based activity
Reflective Questionnaire
reflective questionnaire was found to be a reliable instrument to assess the perceived
effectiveness of instruction. Reliability was demonstrated by a Cronbach alpha coefficient of .90.
Student Information Sheet
The student information sheet was utilized to gather demographic information about the students that might further inform the study. Students provided information about their grade level, gender, race/ethnicity, and math and science courses they had taken in high school.
Data Analysis
Quantitative data analyses were performed to test the hypothesis that students taught in the DRL environment would have a significant gain in knowledge of STEM concepts related to RET and be better able to solve problems when compared to students taught in the lecture-based environment.
Total scores on the problem-based activity were also recorded in the spreadsheet. Prior to entering student responses on the reflective questionnaire and student information sheet, responses were coded (see Appendices H and I). Data for students who were absent for either the pretest or posttest were discarded due to lack of having a baseline (pretest scores) or lack of having a treatment comparison (posttest scores). In total, data for three students were not analyzed (n=128). Once data were entered, data were transferred to SPSS Version 18. For all statistical tests, an alpha (α) significant level of .05 was utilized.
From the outset of the study, students in the control (lecture-based) and treatment (DRL) groups were compared using an independent-samples t-test to determine if the groups were equivalent with respect to prior knowledge as measured by pretest scores. An
independent-samples t-test was also performed to ensure equivalence between the two control periods (2 and 3) and two treatment periods (1 and 4).
DRL and Students’ Knowledge of STEM Concepts
Pre- and posttest data were analyzed to determine if there was a significant difference in students’ knowledge of STEM concepts related to RET between students in the lecture-based and students in the DRL environments. Frequencies and descriptive statistics were analyzed for all students, for control and treatment groups, and for each period. A paired-samples t-test was performed to determine whether students’ knowledge of STEM concepts significantly differed before and after instruction in each of the learning environments.
difference in posttest scores of control periods (2 and 3) to treatment periods (1 and 4), possibly attributable to having different teachers. Analysis of covariance (ANCOVA) was conducted using posttest scores as the response, pretest scores as the covariant, and group as the design factor to test if there was a significant difference in the posttest scores between the control and treatment groups controlling for pretest scores.
Analysis of variance (ANOVA) tests were also conducted to analyze the effects of gender, number of science courses, and number of math courses on students’ scores. Students’ perceived gain in knowledge about RET after instruction was compared between the control and treatment groups by examining descriptive statistics and performing an independent-samples t-test for responses to that statement on the questionnaire. Differences in students’ responses attributable to gender differences were also explored using descriptive statistics and an independent-samples t-test.
DRL and Students’ Problem Solving Skills
CHAPTER 4: RESULTS
This study sought to determine the impact of a data-rich learning environment on a) students’ knowledge of STEM concepts related to RET (RQ1) and b) students’ problem solving skills (RQ2). The previous chapter outlined the data analyses used to answer these research questions. The results for each of the questions are presented below.
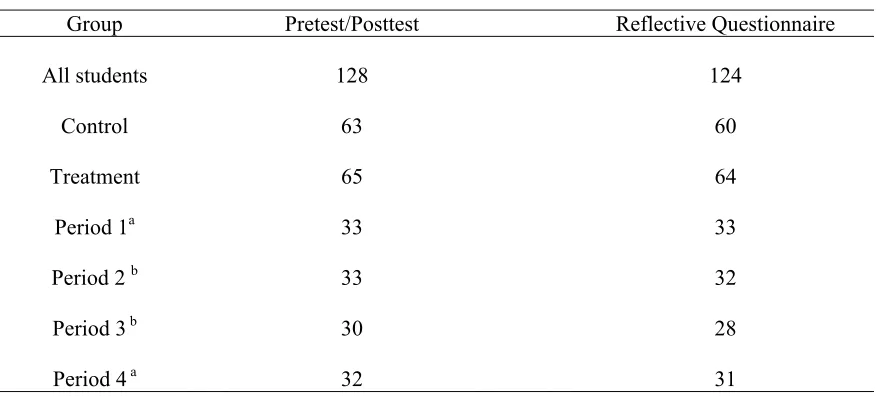
Sample sizes are shown in Table 2. Absences during the study period were accounted for by only including student data for who both pretest and posttest data were collected.
Table 2
Sample Sizes
Group Pretest/Posttest Reflective Questionnaire
All students 128 124
Control 63 60
Treatment 65 64
Period 1a 33 33
Period 2 b 33 32
Period 3 b 30 28
Period 4 a 32 31
Notes:
DRL and Students’ Knowledge of STEM Concepts Related to RET (RQ1)
Equivalence of Control and Treatment Groups
Prior to conducting analyses to determine the impact of the learning environment on students’ knowledge of STEM concepts related to RET, analyses were performed to
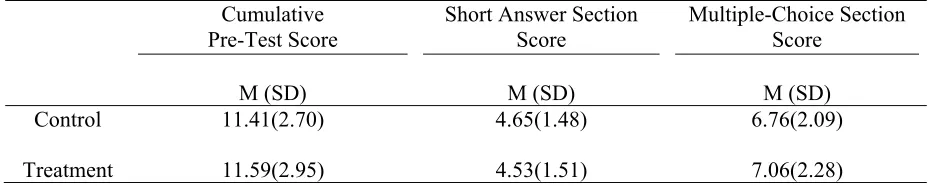
determine if the treatment and comparison groups were equivalent in terms of their prior knowledge of RET. The results of the independent-samples t-test for the short answer, multiple choice, and overall pretest scores indicate no significant difference between the two groups in terms on students pretest scores (see Table 3).
Table 3
Equivalence of Control and Treatment Groups Onset Study
Cumulative Pre-Test Score
M (SD)
Short Answer Section Score
M (SD)
Multiple-Choice Section Score
M (SD)
Control 11.41(2.70) 4.65(1.48) 6.76(2.09)
Treatment 11.59(2.95) 4.53(1.51) 7.06(2.28)
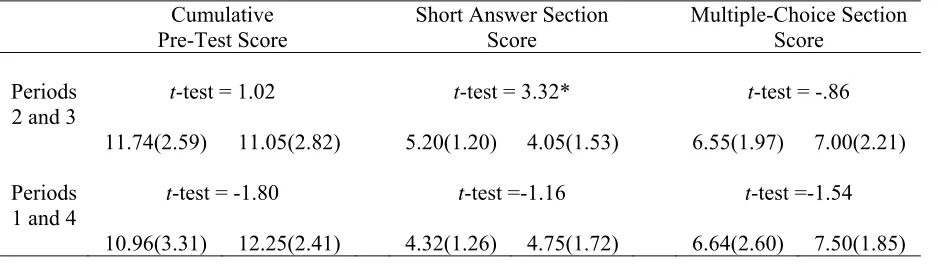
Equivalence of control and treatment class periods between teachers was also
Table 4
Equivalence of Class Periods Onset Study
Cumulative Pre-Test Score
Short Answer Section Score
Multiple-Choice Section Score
Periods 2 and 3
t-test = 1.02 t-test = 3.32* t-test = -.86
11.74(2.59) 11.05(2.82) 5.20(1.20) 4.05(1.53) 6.55(1.97) 7.00(2.21) Periods
1 and 4
t-test = -1.80 t-test =-1.16 t-test =-1.54
10.96(3.31) 12.25(2.41) 4.32(1.26) 4.75(1.72) 6.64(2.60) 7.50(1.85) Notes:
*p<.05
Effect of Treatment
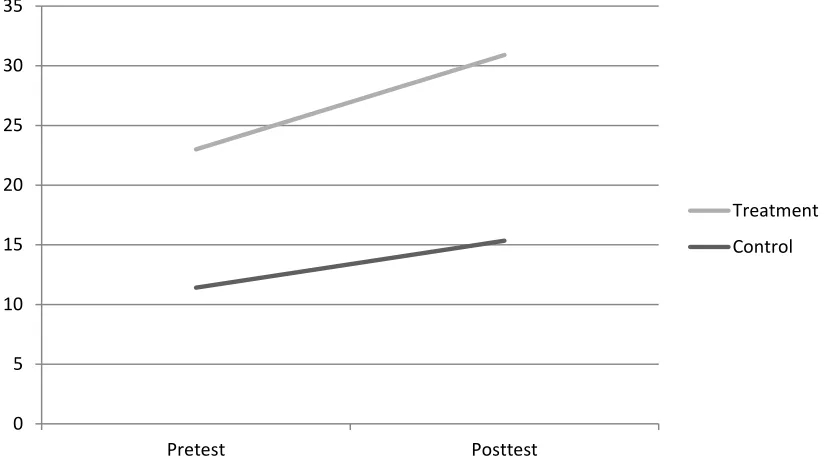
A paired-samples t-test was performed to determine if students’ knowledge
0 5 10 15 20 25 30 35
Pretest Posttest
Treatment
Control
Figure 3. Comparison of Treatment and Control Mean Pretest/Posttest Scores
An independent-samples t-test revealed no significant difference in posttest scores for the control (M=15.33, SD=3.33) and treatment (M=15.55, SD=2.61) group; t(126)=-.433, p=.67. Results from ANCOVA analysis revealed that covariate, students’ pretest scores, was not significantly related to students’ posttest scores, F(1,1) = 36.02, p=.77. These results indicate that while students in the DRL environment scored significantly higher from pretest to posttest, the mean posttest scores for students in the DRL were not significantly higher than the mean posttest scores for students in the lecture-based learning environment.
Confounding Variables
DRL and Students’ Problem Solving Skills (RQ2)
Equivalence of Control and Treatment Groups
Due to time limitation of the study, data was not obtained to measure students’
problem solving abilities prior to instruction, therefore a baseline was lacking to establish any potential differences in problem solving abilities among students in the control group
compared to students in the treatment group at the onset of the study. Equivalence of post-instruction problem solving abilities and perceived problem solving abilities, measured using scores from the problem-based activity and questionnaire, did not reveal significant
differences between the control (periods 2 and 3) and treatment (periods 1 and 4) groups that would indicate differences in students’ problem solving abilities or perceived problem solving abilities attributed to having a different teacher.
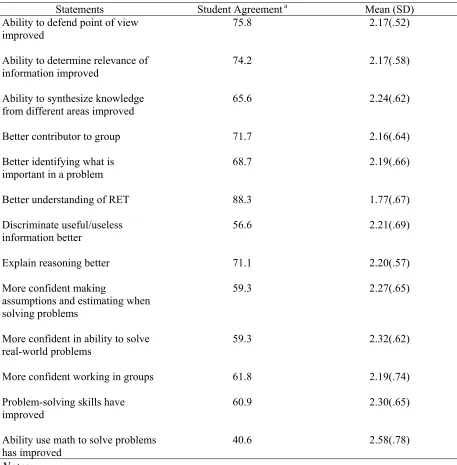
Table 5.
Reflective Questionnaire Response Frequencies and Descriptive Statistics
Statements Student Agreementa Mean (SD)
Ability to defend point of view improved
75.8 2.17(.52)
Ability to determine relevance of information improved
74.2 2.17(.58)
Ability to synthesize knowledge from different areas improved
65.6 2.24(.62)
Better contributor to group 71.7 2.16(.64)
Better identifying what is important in a problem
68.7 2.19(.66)
Better understanding of RET 88.3 1.77(.67)
Discriminate useful/useless information better
56.6 2.21(.69)
Explain reasoning better 71.1 2.20(.57)
More confident making
assumptions and estimating when solving problems
59.3 2.27(.65)
More confident in ability to solve real-world problems
59.3 2.32(.62)
More confident working in groups 61.8 2.19(.74)
Problem-solving skills have improved
60.9 2.30(.65)
Ability use math to solve problems has improved
40.6 2.58(.78) Notes: