Seismic Analysis and Evaluation of Spent Fuel Dry Cask Storage Systems
V. K. Luk ~), J. A. Smith ~), S. K. Shaukat 2~, R. M. Kenneally 2~, R. A. Dameron 3), Y. R. Rashid 3), and V. P. Sobash 3~
1) Sandia National Laboratories, Albuquerque, NM, USA
2) United States Nuclear Regulatory Commission, Washington, D.C., U S A 2 3) ANATECH Corporation, San Diego, CA, USA
ABSTRACT
Sandia National Laboratories (SNL), with support from ANATECH Corporation, is conducting a research program to develop a comprehensive methodology for the seismic evaluation of freestanding spent fuel dry cask storage systems. This program is funded by the Nuclear Regulatory Commission (NRC) to investigate a range of technical issues concerning the dry storage of spent nuclear fuel by conducting confirmatory research for establishing seismic criteria and review guidelines for the seismic behavior of these systems. The research program focuses on developing finite element analysis models that address the dynamic coupling of a module/cask, a flexible concrete pad, and an underlying soil/rock foundation, in particular, the soil-structure-interaction. Parametric analyses of the coupled models will be performed to include variations in module/cask geometry, site seismicity, foundation properties, and cask/pad interface friction. The analysis results, summarized as nomograms, will characterize the limiting conditions of these parameters for the seismic stability of modules/casks. This paper provides an overview of the research program and summarizes some results to date of the detailed analyses performed.
I N T R O D U C T I O N
One type of Independent Spent Fuel Storage Installations (ISFSI) licensed under 10 CFR Part 72 [1] consists of array(s) of freestanding dry cask storage systems resting on a concrete pad constructed on a natural sub-grade or engineered fill. The cask stability is a high priority issue to evaluate the seismic safety of these systems. The current Standard Review Plan (SRP), NUREG-1536, for these systems [2] calls for the use of a safety margin of 1.1 as the review criterion against cask sliding and overturning during a postulated design earthquake; that is, the cask is not allowed to move or tip. However, the casks may slide and wobble in an earthquake event of medium to high magnitude. In the safety review process, there is no guidance in the current review criteria to address the important issues of simultaneous sliding and tipping of casks, potential impact of neighboring casks, and structural integrity of their internals. In addition, the SRP states that the tip-over and cask-to-cask impact of casks in an earthquake are considered to be accidents and should be analyzed regardless of the likelihood of occurrence. The consequences of these occurrences have not been fully assessed by the NRC beyond the requirements that the licensing basis of the cask and the storage site must not be violated.
This paper focuses on developing and examining the results from a coupled finite element model involving rectangular concrete modules with steel horizontal casks. These specific modules/casks, which are planned to be installed at a West Coast site, consists of a tie-together unit of at least three modules. The analysis results included in this paper provide an in-depth investigation on the seismic response of these modules/casks with an independent analysis methodology in supporting the NRC staff to evaluate their license application.
COUPLED F I N I T E E L E M E N T ANALYSIS M O D E L
A three-dimensional coupled finite element model consisting of the three-module assembly of rectangular modules/casks, a flexible concrete pad, and an underlying soil foundation was developed to investigate the seismic response of the module/cask under prescribed earthquake excitations. The coupled modeling approach allows an in-depth evaluation of the nonlinear dynamic seismic behavior of the module/cask and in particular, the soil-structure-interaction (SSI) effect.
The model development effort involved two analysis groups who used independent modeling approaches to develop the coupled model. This modeling arrangement with separate efforts provided a better check-and-balance and a much- improved solution of the seismic response of the modules/casks. It will not be possible to otherwise validate the analysis
1 This work is sponsored by the United States Nuclear Regulatory Commission. Sandia is a multiprogram laboratory operated by Sandia Corporation, a Lockheed Martin Company, for the United States Department of Energy under Contract Number DE-A CO4-94AL85000.
2 This paper was prepared in part by an employee of the United States Nuclear Regulatory Commission. It presents information that does not currently represent an agreed-upon staff position. NRC has neither approved nor disapproved its technical contents.
SMiRT 16, Washington DC, August 2001 Paper # 1369
results due to lack of relevant test data. There were considerable differences in the analysis results produced from the two approaches. Most of the identified discrepancies were eventually resolved to arrive at a final model with all desirable features. This report discusses the details of the final model approach and results.
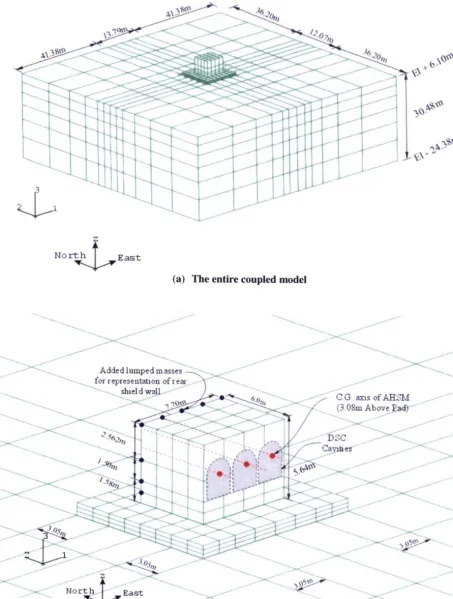
Description of Analysis Model
The coupled model of the three-module assembly, a flexible concrete pad, and an underlying soil foundation was developed using the ABAQUS/Explicit code, Version 5-8.19 [3]0 The layout of the model is illustrated in Figure 10 All elements are of the type "C3DSR", which is an 8-node solid, with reduced (one Gauss point) integration and built-in hourglass control. The module/cask was modeled with a 4x4x4 block of solid elements plus a layer of membrane elements attached to the back of the module/cask assembly (as shown in Figure 1), simulating the mass of a 0.914 m (3 foot) thick shield wall. The density of the solid elements was calculated and distributed such that the center of gravity of the assembly (with full fuel canisters in each of the three cavities) is located at the correct position. The modules/casks and their internals were modeled as elastic bodies and the three modules were assumed to be perfectly tied together in the model.
In the coupled model, the base of the concrete pad was assumed rigidly bonded to the top surface of the soil foundation° At the interface between the module and the pad, a sliding contact condition was assumed with assigned friction coefficients of 0.3, 0.5, or 0.75. The top of the pad was designated to be the "master" surface and the underside of the module to be the "slave" surface to prevent any portion of the module from entering the pad. The four vertical sides of the soil foundation were represented by edge columns that allow horizontal shear deformation only in order to simulate infinite boundary conditions. The input motions of seismic accelerations were applied at the base of the soil foundation.
Model Geometry
The total weight of the module/cask model is 213,207 kg (470,041 lbs). module/cask model whose specific dimensions are described below:
• Width = 2.56 m (8'- 5") (for a single module)
• Width = 7.70 m (25'- 3") (for a three-module assembly)
• Length = 6.00 m (19'- 7")
• Height = 5.64 m (18'- 6") (with shield block)
• Cask Height = 2.58 m (8'- 5.7")
• Height of combined center of gravity above pad = 3.08 m (10'- 1.13")
Figure 1 shows the details of the
The concrete pad model covers the area directly underneath the three-module assembly plus 3.04-m (10-foot) clearance on its all four sides.
• Thickness = 0.91 m (3')
• Width = 13.79 m (45'- 3")
• Length = 12.07 m (39'- 7")
Per US Corps of Engineers soil-structure-interaction modeling guidelines [4], the selected width and length of the
soil foundation should be seven times the corresponding dimensions of the pad. Therefore, the soil foundation was
dimensioned with width = 96.55 m (316'- 9") and length = 84.46 m (277'- 1"). In addition, the depth of the soil foundation was selected to be 30.48 m (100 feet) that is more than twice the width of the assembly.
Material Properties
The module/cask assembly and the concrete pad were assumed to behave elastically when subjected to the seismic excitations° The internal details of the assembly were not represented and the concrete pad would not crack in the coupled model. Table 1 provides their elastic material properties selected in the model.
Table 1. Elastic material properties of module/cask and pad
Structural Element
Pad
Shield Wall
Module (Zone 1)*
Module (Zone 2)*
Young's Modulus, E (MPa) (x 103)
24.856
27.789
27.789
27.789
Poisson's Ratio,v
0.2
0.2
0.2
0.2
Density, i 9 (kg/m 3)
2403
2403
1416 (from base to 1.57 m above pad)
2349 (from 1.57 m above pad to top)
* This arrangement puts the center of gravity of the assembly at the correct elevation.
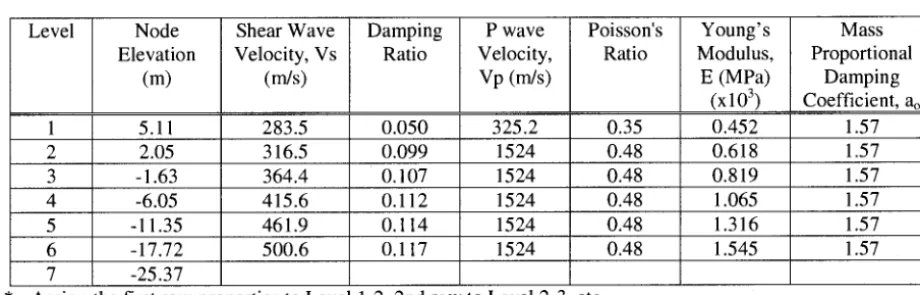
Table 2. Averaged properties vs. depth*
Level Node
Elevation (m)
Shear Wave Velocity, Vs
(m/s)
Damping Ratio
P wave Velocity, Vp (m/s)
Poisson's Ratio
Young's Modulus,
E (MPa)
(xl0 3)
Mass Proportional
Damping Coefficient, ao
1 5.11 283.5 0.050 325.2 0.35 0.452 1.57
2 2.05 316.5 0.099 1524 0.48 0.618 1.57
3 - 1.63 364.4 0.107 1524 0.48 0.819 1.57
4 -6.05 415.6 0.112 1524 0.48 1.065 1.57
5 -11.35 461.9 0.114 1524 0.48 1.316 1.57
6 - 17.72 500.6 0.117 1524 0.48 1.545 1.57
7 -25.37
* Assign the first row properties to Level 1-2, 2nd row to Level 2-3, etc.
Soil Damping
In the ABAQUS/Explicit code, the material damping is represented by Rayleigh damping, which usually involves two damping factors to account for stiffness and mass proportional damping. Since there would be a large run-time penalty associated with the stiffness proportional damping in the explicit calculations, the final analyses used the mass proportional
damping,
~n
only. This gives~n = a °
2o3 n
The fundamental period of the soil foundation model, T~ was approximately 0.4 seconds° The mass proportional damping coefficient ao then becomes
2n 4n
ao - 2 x
x { - ~ x {
T 0.4
The anchor point for the damping in this formula was set equal to 5% of critical damping.
Time Histories of Seismic Accelerations
Both sets of seismic time histories are defined at the free surface, but the earthquake excitations were applied at the base of the soil foundation in the coupled model. A simplistic procedure was used to approximate the seismic loading at the base of soil foundation and to achieve the desired surface shaking intensity. The procedure is summarized below:
1. A knockdown factor was applied to the magnitudes of the time histories of surface accelerations, 2. The modified seismic time histories were applied as input motions at the base of the soil foundation,
3. The analysis results at the flee-field surface were examined and their magnitudes were compared with the targeted peak ground acceleration, and
4. The knockdown factor was adjusted based on the comparison and the analysis process was iterated until the flee-field surface response arrived at a desirable range of the targeted peak ground acceleration.
This iterative procedure usually works reasonably well for hard soil or soft rock foundation. However, the soil profiledata at the chosen site indicate that its soil foundation is soft. The analysis results revealed that the soil foundation acted as a large amplifier for the horizontal motions while only modest amplification of vertical excitations was observed. It should be noted that the simplistic iterative procedure used in the analyses adjusted the magnitude of the seismic time histories only without any appropriate treatment of their frequency content. Using large knockdown factors in this procedure might significantly alter the characteristics of the seismic time histories. There is an on-going effort to develop an appropriate frequency-domain deconvolution procedure to adjust magnitudes and frequencies simultaneously. The seismic response of the assembly will be re-examined later with the modified time histories of deconvoluted accelerations.
ANALYSIS RESULTS
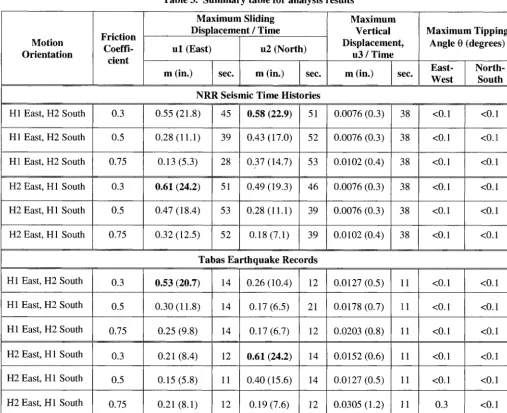
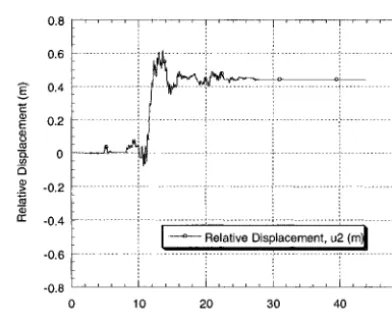
The seismic response of the three-module assembly is expressed in terms of three components of displacements and two components of rotations. The two horizontal displacements, u l and u2, and the vertical displacement, u3, which are referenced to the top surface of concrete pad, describe the sliding movements and the vertical uplift of the assembly, respectively. The rotational movements of the assembly are measured by the two tipping angles with respect to two horizontal axes. Table 3 provides the maximum displacements and rotations of the three-module assembly for each seismic loading configuration.
The analysis results summarized in Table 3 indicate that the three-module assembly experiences a very small amount of rotation when subjected to either set of seismic excitations. The case of lower coefficient of friction equal to 0.3 appears to be the dominating condition for the sliding displacements of the assembly. The highest sliding displacements of the assembly for each loading configuration (with coefficient of friction equal to 0.3) are highlighted in Table 3. The time histories of these sliding displacements are shown in Figure 5 through 8. In addition, the assembly undergoes a relatively low vertical uplift.
The maximum sliding displacement of 0.61 m (24.2 inches) is found for both sets of seismic excitations and is less than 1.52 m (5 feet), which is half of the design separation distance between the neighboring assemblies and half of the minimum distance to the edge of the pad.
SUMMARY
This research program investigates the seismic response of freestanding spent fuel dry cask storage systems. This paper, in particular, discusses the analysis results of the three-module assembly for tile rectangular modules/casks. A coupled model consisting of the assembly, a flexible concrete pad, and a soil foundation was developed to examine the nonlinear dynamic behavior of the assembly and to simulate the effect of soil-structure-interaction. The soil profile data, which was used in developing the soil foundation model, was chosen for a site in the West Coast of the United States.
The analysis effort used the artificial seismic time histories, produced by the NRR staff, whose response spectra are based on RG 1.60, and the actual Tabas earthquake records. Both sets of seismic time histories are defined at the free surface, but the earthquake excitations were applied at the base of the soil foundation in the coupled model. A simplistic procedure, which adjusts the magnitudes of seismic accelerations only without any appropriate treatment of their frequency content, was used to approximate the seismic loading at the base of the soil foundation and to achieve the desired surface shaking intensity. The analysis results indicate that large knockdown factors were needed for the seismic accelerations because of the soft soil foundation at the chosen site. There is an on-going effort to develop an appropriate frequency-domain deconvolution procedure to adjust magnitudes and frequencies simultaneously. The seismic response of the assembly will be re-examined later with the modified time histories of deconvoluted accelerations.
REFERENCES
1. Title 10, The Code of Federal Regulation, January 1, 1997.
2. Standard Review Plan for Dry Cask storage System, NUREG-1536, January 1, 1997.
3. ABAQUS/Explicit: User's Manual, Version 5.8-19, 1998, Pawtucket, RI, Hibbitt, Karlsson, and Sorensen, Inc. 4. US Army Corps of Engineers, Engineer Technical Letter No. 1110-2-339, March 1993.
5. J. Shoja-Taheri and J. G. Anderson, "The 1978 Tabas, Iran, Earthquake: An Interpretation of the Strong Motion Records," Bulletin of the Seismological Society of America, Vol. 78, No. 1, pp. 142-171, February 1988.
Table 3. Summary table for analysis results
Motion Orientation
Friction Coeffi-
cient
Maximum Sliding Displacement / Time u l (East)
m (in.) sec.
u2 (North)
m (in.) sec.
Maximum Vertical Displacement,
u3 / Time
m (in.) see.
Maximum Tipping Angle 0 (degrees)
East- West
North- South NRR Seismic Time Histories
H1 East, H2 South
H1 East, H2 South
H1 East, H2 South
H2 East, H1 South
H2 East, H1 South
H2 East, H1 South
0.3 0.5 0.75 0.3 0.5 0.75
0.55 (21.8)
0.28(11.1)
0.13(5.3)
0.61 (24.2)
0.47 (18.4)
0.32 (12.5)
0.58 (22.9) 51
39 0.43 (17.0) 52
28 0.37 (14.7) 53
51
53
0.49 (19.3) 46
0.28 (11.1) 39
0.18(7.1) 39
0.0076 (0.3) 38
0.0076 (0.3) 38
0.0102 (0.4) 38
0.0076 (0.3) 38
0.0076 (0.3) 38
0.0102 (0.4) 38
<0.1
<0.1
<0.1
<0.1
<0.1 <0.1
<0.1 <0.1
<0.1 <0.1
<0.1 <0.1
Tabas Earthquake Records
H1 East, H2 South
HI East, H2 South
H1 East, H2 South
H2 East, H1 South
H2 East, H1 South
H2 East, H 1 South
0.3 0.5 0.75 0.3 0.5 0.75
0.53 (20.7)
0.30 (11.8)
0.25 (9.8)
0.21 (8.4)
0.15 (5.8)
0.21 (8.1)
0.26 (10.4) 12
14 0.17 (6.5) 21
14 0.17 (6.7) 12
12 0.61 (24.2) 14
11 0.40 (15.6) 14
12 0.19(7.6) 12
0.0127 (0.5) 11
0.0178 (0.7) 11
0.0203 (0.8) 11
0.0152 (0.6) 11
0.0127 (0.5) 11
o.o3o5 (1.2) 1
,-..
Nort.h ~ E a s t
( a ) T h e e n t i r e c o u p l e d m o d e l
(;t,i:
- . . . . . . u.+::.;+ :+,+-+ ,-.+ +., --+ ... . ; - + b - + + ...
" I_ ~+
+
+
) - : - q ? +
A d d e d l u m p e d m a s s e s ' + - +-: ....
+ - for representation of rein - :~- " " _ - , + - -
-++ . s h i e l d w ~ ! .... " ... / ,~---~'~- -- . . . . . C G axis of A H e M
;,' ;-,, .... : . i ' ++ ' : : : ; . . - " ' + + : ... .... ++
. . . . _z,~.. :,,::+.J ++ i, ;' .+--" +--+J + • : - +
- - - . ~ +il Z ....
N o r t h E a s t
( b ) M o d u l e / c a s k a n d p a d s u b m o d e l s
2.0 ...
1.5
1.0
0.5
-0.5
-1.0
-1.5
-2.0 . . .
0 10 20 30 40 50 60 70 80
Time (seconds)
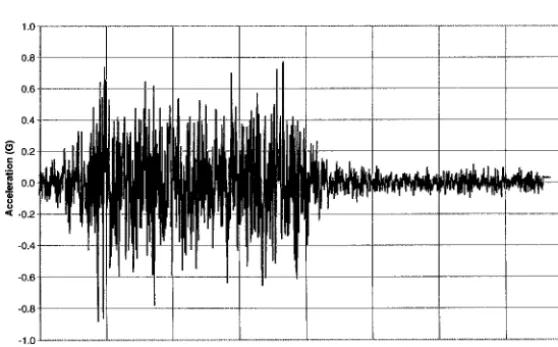
Figure 2. NRR seismic acceleration in the horizontal (east -west) direction, H1
1.5
1.0
,.-., 0.5 i
o.o
u i
-0.5 . . . .
-1.0 . . . . .
-1.5
_
-2.0
0 10 20 30 40 50 60 70
Time (seconds)
Figure 3. NRR seismic acceleration in the horizontal (north-south) direction, H2
0.8
0.6-
0.4-
~
0.2- i._ ~ 0.0-
'~ -0.2-
-0.4-
-0.6
-0.8
-1.0-
0 10 20 30 40 50 60 70
Time (seconds)
Figure 4. NRR seismic acceleration in the vertical direction
0.8 . . . I . . . . ! ' '-~--"-
0.6 . . . :~ ...
0.4
0.2
0
-0.2
-0.4 ... ', ...
l h
o Relative Displacemnt, u2 (m) I
-0.6 ...
- 0 . 8 , , , , i . . . , , , , , , , , , , , , , , , , , j , , , , _ _ L
0 10 20 30 40 50 60 70 80
Time (sac)
Figure 5. Time history of relative horizontal displacement, u2, for NRR seismic acceleration, H1, in
east-west direction (friction coefficient = 0.3)
0 . 8 , , , , , , , , , , , , , , , , , , , , , , , , , , , , , , , ,
0 . 6 i i i :: ' _ =!
0.4
0.2
0
-0.2
.°.4 ... : ... ,~ ... : ... • ... i. ...
-0.6 ... J ... [ o Relative Displacement, u l ( m ) I - - -
-0.8 . . . i .... i .... i .... i .... i . . . .
0 10 20 30 40 50 60 70 80
Time (sac)
Figure 6. Time history of relative horizontal displacement, ul, for NRR seismic acceleration, H2, in
east-west direction (friction coefficient = 0.3)
0.8
0.6 ... ~ ... ; ... ; ...
~ 0
. _
a
••••••••••••.••••••••••••••••••••i.•..••..•••••.••.!•••••..••••••..•.•..•.••••.••i....
~0o 4i
I
~ Relative Displacement, u'i (m)I-
.0.6/i-i--i-i
... --0.8
0 10 20 30 40 50
Time (sac)
0.8
0.6
~" 0.4
E
E 0.2
o
~ o
a
.~ -0.2
rr -0.4
:: [ o Relative Displacement u2 (m I
... ... -
-0.8
0 10 20 30 40 50
Time (sac)
Figure 7. Time history of relative horizontal displacement, ul, for Tabas seismic acceleration, H1,
in east-west direction (friction coefficient = 0.3)
Figure 8. Time history of relative horizontal displacement, u2, for Tabas seismic acceleration, H2,