Medical Devices: Evidence and Research 2018:11 29–36
Medical Devices: Evidence and Research
Dove
press
submit your manuscript | www.dovepress.com 29
R E v i E w
open access to scientific and medical research
Open Access Full Text Article
Digital stethoscope: technology update
Supreeya Swarup1
Amgad N Makaryus1,2
1Department of Cardiology,
Nassau University Medical Center, East Meadow, NY, 2Department
of Cardiology, Zucker School of Medicine at Hofstra/Northwell Health, Hempstead, NY, USA
Abstract: Cardiovascular disease (CVD) is recognized as the leading cause of mortality through-out the world. Abthrough-out one-third of global mortality is attributable to CVD. In addition to clinical presentation, specific clinical exam findings can assist in treating and preventing CVD. CVD may initially manifest as pulmonary pathology, and thus, accurate cardiopulmonary ausculta-tion is paramount to establishing accurate diagnosis. One of the most powerful tools available to physicians is the stethoscope. The stethoscope first emerged in the year 1818, invented by a French physician, René Laennec. Since then, the initial modest monaural wooden tube has evolved into a sophisticated digital device. This paper provides an analysis of the evolution of the stethoscope as well as highlights the advancement made by the modern digital stethoscope including the application of this tool in advancing care for patients suffering from CVD.
Keywords: cardiovascular disease, physical exam, diagnosis, treatment
Introduction
Cardiovascular disease (CVD) is recognized as the leading cause of mortality in coun-tries throughout the world, and thus, timely detection, treatment, and prevention are the
cornerstone of the comprehensive care that a physician provides to his/her patients.1
In 2015, 31% of global mortality was attributable to CVD, where 17.7 million people
died from a cardiac cause.1 Auscultation of the cardiovascular system can assist in
timely diagnosis of valvular heart disease (VHD), congestive heart failure, hypertensive disease, arrhythmias such as atrial fibrillation, obstructive arterial disease, and struc-tural heart disease among several others. Furthermore, multiple pulmonary diseases can manifest as right-sided heart disease and multiple heart diseases can first present as pulmonary pathology; thus, pulmonary auscultation and interpretation can further assist in forming accurate diagnosis.
Cardiovascular examination usually comprises the following: evaluation of the carotid arterial pulse and jugular venous pulse; auscultation for bruits; auscultation of venous hums, precordial impulses, and palpation of heart sounds and murmurs; auscultation of the heart sounds; and evaluation of the peripheral arterial and venous
system.2 Auscultation of the heart sounds is the foundation upon which a physician
can diagnose CVD and provide cost-effective means for additional tests. Auscultation represents recognition of mechanical vibration from the body surface at the frequency
range of sound (20–20,000 Hz).3 Vibrations below this frequency range are defined
as “infrasonic” and are usually appreciated as thrusts, heaves, and arterial or venous pulsations.
Correspondence: Amgad N Makaryus Department of Cardiology, Nassau University Medical Center, 2201 Hempstead Turnpike, East Meadow, NY 11554, USA
Tel +1 516 296 4949 Fax +1 516 572 3172 Email [email protected]
Journal name: Medical Devices: Evidence and Research Article Designation: Review
Year: 2018 Volume: 11
Running head verso: Swarup and Makaryus Running head recto: Digital stethoscope DOI: http://dx.doi.org/10.2147/MDER.S135882
Video abstract
Point your SmartPhone at the code above. If you have a QR code reader the video abstract will appear. Or use:
http://youtu.be/scDp0KBfkbw
Medical Devices: Evidence and Research downloaded from https://www.dovepress.com/ by 118.70.13.36 on 24-Aug-2020
For personal use only.
Dovepress
Swarup and Makaryus
In the modern world, several modalities are used in addi-tion to the clinical examinaaddi-tion in evaluaaddi-tion of CVD. An electrocardiogram (ECG) is an inexpensive and noninvasive test that can assist in recognition of arrhythmias and acute coronary syndromes and can be used as a screening tool for
CVD.4 Other modalities include the echocardiogram, cardiac
magnetic resonance imaging (CMRI), and computed tomog-raphy (CT). Echocardiogtomog-raphy uses reflected ultrasound waves to give information regarding cardiac hemodynamics, function, and structure. It is a powerful tool that is generally used in addition to ECG and chest X-ray for initial CVD
assessment.5 CMRI uses magnetic resonance imaging to
provide clear delineation of the cardiac anatomy, provides a detailed myocardial tissue analysis that aids in diagnosis of specific cardiomyopathies, provides myocardial viability
data, and can assist in evaluation of cardiac function.6 CT uses
X-rays in the acquisition of data with high spatial resolution. Cardiac CT today can be used to assess atherosclerosis in coronary artery disease, compute a calcium score,
evalu-ate the cardiopulmonary vasculature, and evaluevalu-ate valves.7
However, despite advances in these imaging modalities, each technique requires a technician trained to perform these tests and an experienced operator who can interpret the findings accurately. In addition, these machines are usually only available in large institutions, leaving many underserved areas without such advanced technology to aid in diagnosis
and treatment of CVD.1 Thus, it is imperative for a physician
to develop clinical acuity as well as employ easily available
tools such as a stethoscope for a timely diagnosis and treat-ment of CVD.
The conventional stethoscope
The stethoscope is an acoustic device that transmits the sounds from the chest piece through an air-filled hollow tube to the listener’s ears. The French physician René Laennec first invented it in the 1800s. The design was modest and consisted of a hollow wooden tube that was monaural. Around the same time period, a British physi-cian, Golding Bird, described his version of the stethoscope that comprised flexible tubing that was also monaural. Later, an Irish physician, Arthur Leared, advanced the
design and a binaural stethoscope emerged.8 The binaural
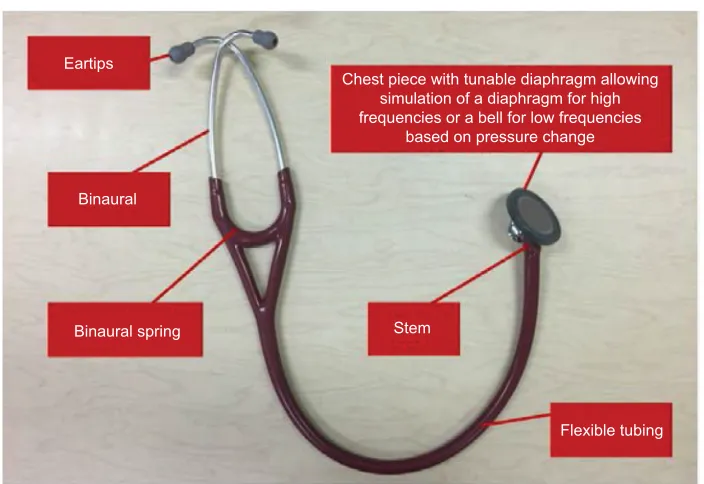
stethoscope has evolved tremendously since then; however, the concept remains the same. The current acoustic binaural stethoscope consists of a hollow tube attached to a chest piece consisting of a wider-based diaphragm and a smaller hollow bell. The diaphragm will transmit higher frequency sounds, whereas the bell will transmit lower-frequency sounds. Thus, the acoustic stethoscope will attenuate sound transmission proportional to the frequency created by the heart sounds. Due to the variation in sensitivity of a human ear, some sounds may not be heard due to low frequency, such as below 50 Hz. This limitation of the acoustic stetho-scope has led to the emergence of an electronic device that is far more sophisticated than the original conventional stethoscope (Figure 1).
Figure 1 Main components of the conventional stethoscope.
Eartips
Binaural
Binaural spring Stem
Flexible tubing Chest piece with tunable diaphragm allowing
simulation of a diaphragm for high frequencies or a bell for low frequencies
based on pressure change
Medical Devices: Evidence and Research downloaded from https://www.dovepress.com/ by 118.70.13.36 on 24-Aug-2020
Dovepress Digital stethoscope
Cardiac and pulmonary auscultation
It is vital for a physician to appreciate cardiac and pulmonary sounds in his/her patients in order to accurately formulate a diagnosis. Auscultation with a stethoscope provides clini-cal information that can assist in diagnosing, and altering and directing patient care. Heart sounds are created due to opening and closure of the valves, blood flow through any orifice, flow of blood into the ventricular chambers, and
rub-bing of the cardiac surfaces.9 Heart sound frequencies can be
impacted by valve apparatus; however, they normally range
from 10 to 200 Hz.10,11 The main areas of auscultation are
depicted in Figure 2.
Normal heart sounds comprise the first heart sound (S1), which is produced by the closure of the atrioventricular (AV) valves that are the mitral and tricuspid valves. This corre-sponds to the end of diastole and the beginning of ventricular
systole and precedes the upstroke in the carotid arteries.9–12
Variability in auscultation of S1 is described in Figure 3. The second heart sound (S2) is due to the closure of the aortic valve (A2) and the pulmonic valve (P2) at the conclusion
Figure 2 Main areas of cardiac auscultation.
Abbreviation: iCS, intercostal space.
Base of the heart
Interscapular area
Pulmonary area: 2nd
ICS left of sternum Left axilla
Tricuspid area: 4th and 5th ICS left of sternum
Mitral area: Cardiac apex
Apex of the heart
Carotid arteries
Aortic area: 2nd ICS right of the sternum or 3rd ICS left of the sternum
Figure 3 variability of auscultation of S1. Adapted from Leng S, Tan RS, Chai KT, wang C, Ghista D, Zhong L. The electronic stethoscope. Biomed Eng Online. 2015;14:66. Creative Commons license and disclaimer available from: http://creativecommons.org/publicdomain/zero/1.0/.15
Note: S1 is the first heart sound.
Abbreviations: MS, mitral stenosis; TS, tricuspid stenosis; MvP, mitral valve prolapse; Lv, left ventricular; ASD, atrial septal defect; Av, atrioventricular; MR, mitral regurgitation; TR, tricuspid regurgitation; DCM, dilated cardiomyopathy; CM, cardiomyopathy; Mi, myocardial infarction; M1, mitral valve; T1, tricuspid valve; Rv, right ventricular.
Loud S1: Increased transvalvular gradient (MS, TS, atrial myxoma), increased force of
ventricular contraction (tachycardia, hyperdynamic states), shortened PR interval
(tachycardia, preexcitation syndromes ex Wolff–Parkinson–White syndrome), MVP
Diminished S1: Inappropriate apposition of the AV valves (MR, TR, DCM), prolonged PR (bradycardia, heart block, digoxin toxicity), decreased force of ventricular contraction (CM, MI), increased calcification of AV valve,
increased distance from the heart (pericardial effusion, obesity,
emphysema, pleural effusion)
Reverse splitting S1 (M1 follows the closure of T1): Left bundle branch block,
RV pacing, severe MS, left atrial myxoma Muffled S1: Pleural
effusion, pericardial effusion, pneumothorax,
emphysema, obesity
Split S1: Premature ventricular contraction, right bundle branch block, LV pacing, ebstein
anomaly, ASD
Medical Devices: Evidence and Research downloaded from https://www.dovepress.com/ by 118.70.13.36 on 24-Aug-2020
Dovepress
Swarup and Makaryus
of systole, and it marks the beginning of the diastolic period. Variability in auscultation of S2 is further described in Figure 4.
The third heart sound (S3) occurs in early diastole as the blood enters the ventricle from the atria. It can be normal in individuals up to the age of 40 years; however, if audible in patients of older age, then S3 is pathologic. Pathologically, this can be due to systolic or diastolic ventricular dysfunction, ischemic heart disease, hyperkinetic states (fever, anemia,
preg-nancy, thyrotoxicosis, AV fistula), VHD, or volume overload.9
The fourth heart sound (S4) is a late diastolic sound and is usually produced when the blood from the atria is sud-denly decelerated due to a noncompliant left ventricle. Thus,
ventricular hypertrophy, ischemic heart disease, ventricular aneurysm, and hyperkinetic states causing forceful atrial
contraction can all produce an S4.9–12
In addition to the above heart sounds, an opening snap, valvular ejection clicks, and a variety of murmurs can also be
appreciated.9 A summary of common murmurs is described
in Table 1.
Furthermore, another vital component of auscultation is classification of pulmonary pathology to assist in making cor-rect diagnosis. However, accurate interpretation of pulmonary auscultation is subjective and largely dependent on the training of the physician. Auscultation should take place in a quiet room
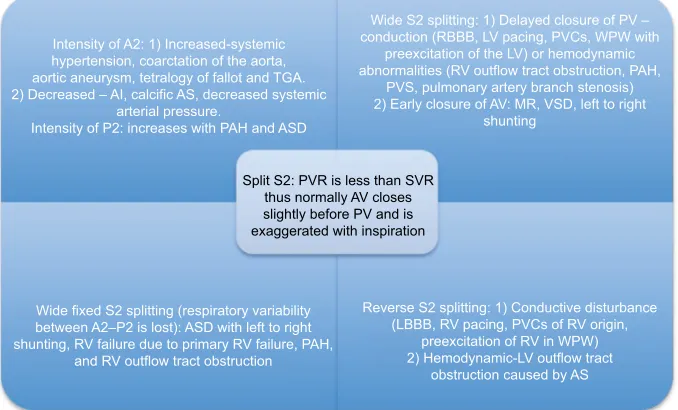
Figure 4 variability of auscultation of S2. Adapted from Leng S, Tan RS, Chai KT, wang C, Ghista D, Zhong L. The electronic stethoscope. Biomed Eng Online. 2015;14:66. Creative Commons license and disclaimer available from: http://creativecommons.org/publicdomain/zero/1.0/.15
Notes: A2 represents the closure of the aortic valve. P2 is the closure of the pulmonic valve. S2 is the second heart sound.
Abbreviations: TGA, transposition of great arteries; AI, aortic insufficiency; AS, aortic stenosis; PAH, pulmonary arterial hypertension; ASD, atrial septal defect; PV,
pulmonic valve; RBBB, right bundle branch block; Lv, left ventricular; PvC, premature ventricular contraction; wPw, wolff–Parkinson–white syndrome; Rv, right ventricle; PvS, pulmonic valve stenosis; Av, atrioventricular; MR, mitral regurgitation; vSD, ventricular septal defect; LBBB, left bundle branch block; PvR, pulmonary vascular resistance; SvR, systemic vascular resistance.
Intensity of A2: 1) Increased-systemic hypertension, coarctation of the aorta, aortic aneurysm, tetralogy of fallot and TGA. 2) Decreased – AI, calcific AS, decreased systemic
arterial pressure.
Intensity of P2: increases with PAH and ASD
Wide S2 splitting: 1) Delayed closure of PV – conduction (RBBB, LV pacing, PVCs, WPW with
preexcitation of the LV) or hemodynamic abnormalities (RV outflow tract obstruction, PAH,
PVS, pulmonary artery branch stenosis) 2) Early closure of AV: MR, VSD, left to right
shunting
Wide fixed S2 splitting (respiratory variability between A2–P2 is lost): ASD with left to right shunting, RV failure due to primary RV failure, PAH,
and RV outflow tract obstruction
Reverse S2 splitting: 1) Conductive disturbance (LBBB, RV pacing, PVCs of RV origin,
preexcitation of RV in WPW) 2) Hemodynamic-LV outflow tract
obstruction caused by AS
Split S2: PVR is less than SVR thus normally AV closes slightly before PV and is exaggerated with inspiration
Table 1 Description of common murmurs
Murmur Location Quality Description Radiation Pitch
AS Apex/RUS border Harsh Systolic, crescendo–decrescendo Carotid arteries High
AR RUS border/left 3rd–4th iCS Blowing Diastolic, decrescendo Apex
MS Apex Rumbling Mid-late diastolic with presystolic
accentuation
Low
MR Apex Blowing Holo-systolic Axilla/base of heart High
PS Left 2nd iCS Blowing Systolic, crescendo–decrescendo High
TR Left 4th iCS Blowing Diastolic Left sternal border/xiphoid High
HOCM Left lower sternal border Harsh Mid-late systolic High
vSD Left lower sternal border Harsh Holo-systolic High
PDA Left upper sternal border Harsh Continuous crescendo–decrescendo with peak about S2
High
MvP Apex Blowing Mid-late systolic Axilla/base High
Note: Adapted from Leng S, Tan RS, Chai KT, wang C, Ghista D, Zhong L. The electronic stethoscope. Biomed Eng Online. 2015;14:66. Creative Commons license and disclaimer available from: http://creativecommons.org/publicdomain/zero/1.0/.15
Abbreviations: AS, aortic stenosis; RUS, right upper sternal;AR, aortic regurgitation; iCS, intercostal space; MS, mitral stenosis; MR, mitral regurgitation; PS, pulmonic stenosis; TR, tricuspid regurgitation; HOCM, hypertrophic obstructive cardiomyopathy; vSD, ventricular septal defect; PDA, patent ductus arteriosus; MvP, mitral valve prolapse.
Medical Devices: Evidence and Research downloaded from https://www.dovepress.com/ by 118.70.13.36 on 24-Aug-2020
Dovepress Digital stethoscope
with the patient in a seated position. Auscultation should be done in a symmetrical fashion starting at the apices anteriorly moving to the base and then progression to the posterior chest. Patients should be asked to take deep breaths with their mouth open, while breath sounds should be evaluated for their quality, intensity, and for the presence of unanticipated sounds.
Normal frequency of pulmonary sounds varies from 100
to 1000 Hz.13 Moreover, frequency of wheezing ranges from
100 to 5000 Hz, rhonchus is 150 Hz, coarse crackle is 350
Hz, and fine crackle is 650 Hz.13 Tracheal sounds that are
normal are clearly heard in both phases of respiratory cycle, whereas normal lung sound is only heard on inspiration
and early phase of expiration.14 Wheezing can be heard on
inspiration, expiration, or both, and is musical in nature with
a high pitch.14 Rhoncus may be heard on inspiration,
expira-tion, or both, and is low pitch in nature similar to snoring.14
Fine crackles are heard on mid-to-late inspiration and can be heard on expiration, and are usually not transferred to the
mouth and unaffected by cough.14 Coarse crackle is heard
on early inspiration and throughout expiration, is affected by
cough, and is transferred to the mouth.14 Pleural friction rub
and stridor are explosive and high-pitch sounds, respectively,
which can also be appreciated during auscultation.14 Since
multiple pulmonary sounds can be appreciated, and at times simultaneously, digital stethoscope has facilitated in allow-ing a clinician to accurately understand the pathology behind the sound. As seen by the information that can be gleaned as
noted above, the stethoscope serves as an important tool to diagnose a plethora of cardiovascular and pulmonary disease processes by auscultating heart and lung sounds.
The emergence of the digital
stethoscope
A digital stethoscope is able to convert an acoustic sound to electronic signals, which can be further amplified for optimal listening. These electronic signals can be further processed and digitalized to transmit to a personal computer or a
lap-top.15 The diagnostic power provided by digital stethoscope
auscultation to a physician can assist in altering management in patient care (Figure 5).
The digital stethoscope consists of three different mod-ules, data acquisition, preprocessing, and signal processing,
before the listener can appreciate the auscultated sound.15
The data acquisition module involves a microphone and a piezoelectric sensor. It is responsible for filtering, buffer-ing, and amplification of the auscultated sounds, as well as conversion of the acoustic sound to a digital signal. The preprocessing module filters the digital signal and removes any artifacts. These digital data are then forwarded to the signal-processing module, which will package the informa-tion in a higher-order classificainforma-tion and cluster the data for
a clinical diagnostic decision.15
Unlike the acoustic stethoscope, the transducers on a digital stethoscope are of wide variety. One of the transducing
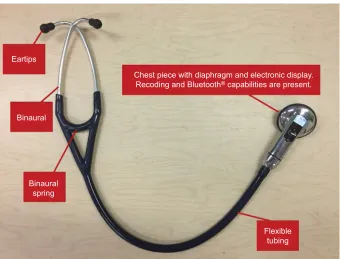
Figure 5 Main components of the digital electronic stethoscope.
Eartips
Binaural
Binaural spring
Flexible tubing Chest piece with diaphragm and electronic display.
Recoding and Bluetooth® capabilities are present.
Medical Devices: Evidence and Research downloaded from https://www.dovepress.com/ by 118.70.13.36 on 24-Aug-2020
Dovepress
Swarup and Makaryus
methods involves the microphone in the chest piece.16 The
sound signals are detected by the stethoscope diaphragm, which is transferred to another diaphragm inside the micro-phone. This allows for the conversion of a simple and direct acoustic sound to an electrical signal. The signal can then be displayed as a phonocardiogram on an electronic device (Figure 6). However, two diaphragms separated by an air path can result in excessive ambient noise signals and inaccurate
electrical signal transfer.15
A piezoelectric sensor functions differently to the double-diaphragm mechanism. In a piezoelectric transducer, the sounds picked up by the stethoscope diaphragm cause distortion of a crystal substance that is responsible for then
producing an electrical signal.16,17 The distortion of the crystal
can produce the electrical signal that may not truly capture
the original sound ascertained by the diaphragm.15
A capacitive micro-electromechanical system is another modality used for a transducer. The diaphragm of the stetho-scope is suspended in a nominal capacitance field, where the capacitance changes according to the acoustic pressure formed by the heart sound. The change in capacitance is able
to generate an electrical signal.18
Currently, almost all available digital stethoscopes allow for selection of different frequency response modes allowing the listener to better hear sounds from the heart, lung, and other areas of the body. There are also multiple mechanisms by which a digital stethoscope can suppress ambient and friction noise to allow the listener to hear sounds that are as original as
possible. For instance, the 3M® Littmann Range offers
piezo-electric sensor which uses the ambient noise reduction as an adaptive noise canceller by which it allows to amplify sounds
up to 24 times.19 The Thinklabs® One Digital stethoscope is
able to amplify sounds up to 100 times by applying capacitive
transducer.20 This technology is able to employ ambient noise
reduction but can also use specific heart sound extraction creating a rigorous tool to hear specific heart sounds such as valvular clicks as well as use specific computer algorithms to
extrapolate frequencies to understand pulmonary pathology.20
The Welch-Allyn® Elite Electronic Stethoscope allows for a
bell mode ranging from 20 to 420 Hz, specifically for heart sounds, and diaphragm mode ranging from 350 to 1900 Hz,
which is better used for lung auscultation.21 Furthermore, the
Ekoscope® stethoscope offers built-in ECG capability, and the
ViScope® stethoscope can empower a physician with real-time
display of multiple waveforms.22,23 A digital stethoscope also
allows the operator to record the heart sounds and upload them to a computer for further visualization, analysis, and transmission. Additionally, some digital stethoscopes can
also be connected to Bluetooth® to wirelessly transmit sound
signals to a remote processing unit.
Medical advancements and
applications in cardiac and
pulmonary auscultation
Aside from providing increased precision and audible advan-tage over the conventional stethoscope, digital stethoscopes have also been studied for their utility of screening for obstructive coronary artery disease. Turbulent blood flow occurs due to hemodynamically significant coronary artery disease and manifests as intracoronary murmurs. However, conventional stethoscopes lack the auscultation power to detect these murmurs. We studied the correlation between diagnosis of coronary artery disease using an electronic
stethoscope and lesions noted on cardiac CT.24 In our
pro-spective single-site study, we wanted to study the accuracy in correlation between the severity and location of coronary artery disease seen on cardiac CT and the microbruits pro-cessed by the Cardiac Sonospectrographic Analyzer (CSA; SonoMedica, Vienna, VA, USA) of the electronic stetho-scope. A total of 161 patients were studied, and the overall sensitivity of the CSA to ascertain coronary artery disease of
>50% in any major epicardial artery was 89.5% (p< 0.001).24
Similarly, Azimpour et al studied similar correlation between audible intracoronary murmurs using a digital
stethoscope and the findings on coronary angiography.25 In
123 patients, they were able to ascertain the sensitivity and
specificity of acoustic detection of lesions with >50% stenosis
in any coronary artery to be 0.70 and 0.80, respectively.25
The promise of this new tool to supplement noninvasive imaging in the diagnosis of obstructive coronary disease rests on the premise that small audible signals generated by the turbulent flow in the coronary artery can be appreciated. The
CSA, CADence™, and CADScor®System are a few examples
of acoustic detection systems that are currently being studied
to validate against CT and invasive coronary angiography.26
A summary of recent studies is provided in Table 2.
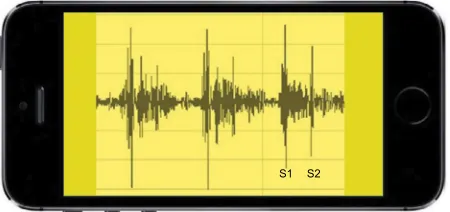
Figure 6 Simulated phonocardiogram of normal S1 and S2 heart sounds seen on a portable device through Bluetooth® integration.
Note: S1 and S2 represent the first and the second heart sound respectively.
S1 S2
Medical Devices: Evidence and Research downloaded from https://www.dovepress.com/ by 118.70.13.36 on 24-Aug-2020
Dovepress Digital stethoscope
Furthermore, due to the innovation of the digital stetho-scope and the capability to transmit the heart sounds wire-lessly, there is potential to develop and advance the field of
telemedicine.27 This will allow physicians to access patients’
heart sounds live and alter care and trajectory of their health directly.
Digital aspect of pulmonary auscultation involves record-ing of the pulmonary sound, computer analysis of the signals obtained, and classification of the sounds based on the
fre-quency analyses.28 Computer-based pulmonary sound analysis
allows for optimizing and quantifying auscultated lung sounds based on the lung sound as well as the spectral characteristics. The Fourier transform has been the most common analysis tool that has been used to understand pulmonary
ausculta-tion.28 The Fourier transform is able to degenerate the signal
to the frequencies that comprise the signal. Neural network, which is a machine-learning algorithm, can further process this information and classify the different frequencies into
pulmonary sounds.28 Gurung et al performed a meta-analysis
of studies that have tried to understand the prognostic power of combining digital pulmonary auscultation with computer-based algorithms. Although the sample size was limited, they were able to uncover that the specificity and sensitivity of identifying abnormal pulmonary sounds using
computer-based algorithms were 85% and 80%, respectively.28
It is also important to note that multiple cardiopulmonary pathologies are connected, and researchers have started to use digital technology to garner accurate diagnosis. For
instance, Kaddoura et al used automated machine learn-ing and language-recognition-inspired-speech algorithm to ascertain if the digitally acquired heart sounds were linked to
pulmonary hypertension (PH).29 The algorithm used was able
to closely examine the heart sound and collect information such as amplitude, intensity, shape, and frequency. The heart sounds from PH patients were compared to non-PH patients, and they discovered the algorithm accurately diagnosed PH
74% of the time.29 These recent discoveries have opened
the door for further research to further optimize the current technology, to ultimately empower the physician to better assist the patient.
Conclusion
Multiple cardiopulmonary pathologies can be appreciated by the simple mechanism of auscultation. The prevalence of CVD is rising in the world, and multiple CVDs may first manifest as pulmonary symptoms; thus, it is imperative that a physician has the ability to accurately examine a patient even with limited resources. The stethoscope is a powerful tool that is easy to use and allows for direct impact on patient care. With multiple sophisticated advancements made in medicine, which aid in clinical diagnosis and management, none of the modalities compare to the simplicity and vitality of a stethoscope. The emergence of a digital stethoscope has only made this historic tool even more refined. The physician can now hear heart and lung sounds with more accuracy and precision. Through this advancement, there is now potential
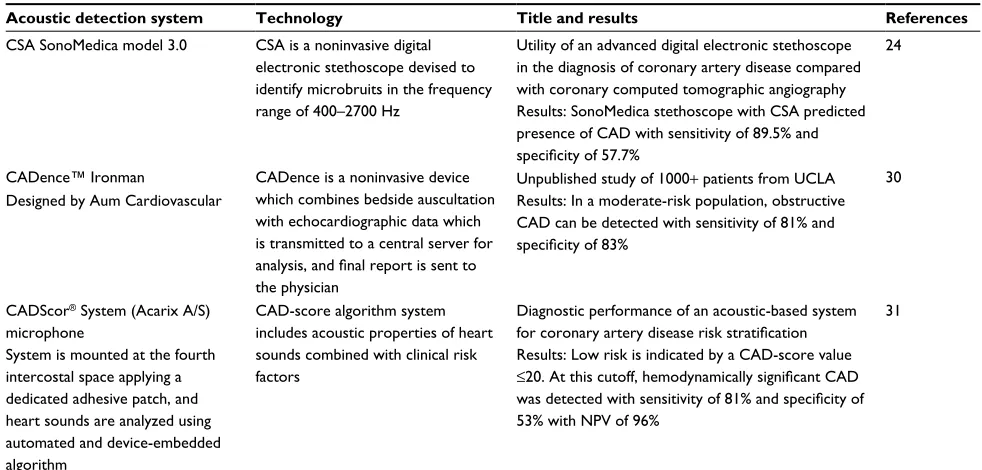
Table 2 Summary of recent studies utilizing acoustic detection system in diagnosing obstructive coronary artery disease
Acoustic detection system Technology Title and results References
CSA SonoMedica model 3.0 CSA is a noninvasive digital electronic stethoscope devised to identify microbruits in the frequency range of 400–2700 Hz
Utility of an advanced digital electronic stethoscope in the diagnosis of coronary artery disease compared with coronary computed tomographic angiography
24
Results: SonoMedica stethoscope with CSA predicted presence of CAD with sensitivity of 89.5% and
specificity of 57.7%
CADence™ ironman CADence is a noninvasive device which combines bedside auscultation with echocardiographic data which is transmitted to a central server for
analysis, and final report is sent to
the physician
Unpublished study of 1000+ patients from UCLA 30
Designed by Aum Cardiovascular Results: in a moderate-risk population, obstructive
CAD can be detected with sensitivity of 81% and
specificity of 83%
CADScor® System (Acarix A/S)
microphone
CAD-score algorithm system includes acoustic properties of heart sounds combined with clinical risk factors
Diagnostic performance of an acoustic-based system
for coronary artery disease risk stratification
31
System is mounted at the fourth intercostal space applying a dedicated adhesive patch, and heart sounds are analyzed using automated and device-embedded algorithm
Results: Low risk is indicated by a CAD-score value ≤20. At this cutoff, hemodynamically significant CAD was detected with sensitivity of 81% and specificity of
53% with NPv of 96%
Abbreviations: CSA, Cardiac Sonospectrographic Analyzer; CAD, coronary artery disease; UCLA, University of California, Los Angeles; NPv, negative predictive value.
Medical Devices: Evidence and Research downloaded from https://www.dovepress.com/ by 118.70.13.36 on 24-Aug-2020
Dovepress
Medical Devices: Evidence and Research
Publish your work in this journal
Submit your manuscript here: https://www.dovepress.com/medical-devices-evidence-and-research-journal
Medical Devices: Evidence and Research is an international, peer-reviewed, open access journal that focuses on the evidence, technology, research, and expert opinion supporting the use and application of medical devices in the diagnosis, monitoring, treatment and management of clinical conditions and physiological processes. The identification of novel
devices and optimal use of existing devices which will lead to improved clinical outcomes and more effective patient management and safety is a key feature. The manuscript management system is completely online and includes a quick and fair peer-review system. Visit http://www. dovepress.com/testimonials.php to read real quotes from authors.
Dove
press
Swarup and Makaryus
to auscultate for obstructive coronary artery disease, and other bruits and obstructive vascular diseases such as carotid artery stenosis, and examine multiple frequencies that may comprise pulmonary auscultation. Furthermore, there is also potential to drastically impact patient care by appreciating disease pro-cesses earlier and to prevent fatal outcome. Medical care can also be provided in areas that are underserved or which do not have medical facilities by applying digital stethoscope tech-nology to telemedicine to allow remote assessment. Although research still needs to be implemented to validate the digital stethoscope further, currently this tool allows the user to be a better diagnostician and thereby deliver better medical care.
Disclosure
The authors report no conflicts of interest in this work.
References
1. World Health Organization. Cardiovascular diseases (CVDs). Available from: http://www.who.int/mediacentre/factsheets/fs317/en/. Accessed 31 July 2017.
2. Felner JM. An overview of the cardiovascular system. In: Walker HK, Hall WD, Hurst JW, editors. Clinical Methods: The History, Physical, and Laboratory Examinations. 3rd ed. Boston: Butterworths; 1990. 3. Tavel ME. Cardiac auscultation. A glorious past – but does it have a
future? Circulation. 1996;93(6):1250–1253.
4. National Heart, Lung, and Blood Institute. How is heart disease diag-nosed? Available from: http://www.nhlbi.nih.gov/health/health-topics/ topics/hdw/diagnosis.html. Accessed 31 July 2017.
5. Esmaeilzadeh M, Parsaee M, Maleki M. The role of echocardiography in coronary artery disease and acute myocardial infarction. J Tehran Heart Cent. 2013;8(1):1–13.
6. De Cobelli F, Pieroni M, Esposito A, et al. Delayed gadolinium-enhanced cardiac magnetic resonance in patients with chronic myocar-ditis presenting with heart failure or recurrent arrhythmias. J Am Coll Cardiol. 2006;47(8):1649–1654.
7. Nikolaou K, Alkadhi H, Bamberg F, Leschka S, Wintersperger BJ. MRI and CT in the diagnosis of coronary artery disease: indications and applications. Insights Imaging. 2011;2(1):9–24.
8. Roguin A. Rene Theophile Hyacinthe Laënnec (1781–1826): the man behind the stethoscope. Clin Med Res. 2006;4(3):230–235.
9. The Heart.org/Medscape. Heart sounds. Available from: http://emedicine. medscape.com/article/1894036-overview#a30. Accessed 31 July 2017. 10. Yoganathan AP, Gupta R, Udwadia FE, et al. Use of the fast Fourier
transform for frequency analysis of the first heart sound in normal man. Med Biol Eng. 1976;14(1):69–73.
11. Stein PD, Sabbah HN, Lakier JB, Magilligan DJ Jr, Goldstein D. Fre-quency of the first heart sound in the assessment of stiffening of mitral bioprosthetic valves. Circulation. 1981;63(1):200–203.
12. Shea MJ. Cardiac Auscultation. Merck Manual Professional Version. Kenilworth: Merck; 2016.
13. Ohshimo S, Sadamori T, Tanigawa K. Innovation in analysis of respira-tory sounds. Ann Intern Med. 2016;164(9):638–639.
14. Bohadana A, Izbicki G, Kraman SS. Fundamentals of lung auscultation. N Engl J Med. 2014;370(8):744–751.
15. Leng S, Tan RS, Chai KT, Wang C, Ghista D, Zhong L. The electronic stethoscope. Biomed Eng Online. 2015;14:66.
16. Smith C, inventor; Smith C, assignee. Transducer for sensing body sounds. United States patent US 6661897B2. 2003 Dec 9.
17. Grundlehner B, Buxi D. Methods to characterize sensors for capturing body sounds. Paper presented at: International Conference on Body Sensor Networks (BSN); May 23–25, 2011; Dallas.
18. Kevin TCC, Han D, Ravinder PS, et al. 118-db dynamic range, contin-uous-time, opened-loop capacitance to voltage converter readout for capacitive MEMS accelerometer. In: IEEE Asian Solid-State Circuits Conference; November 8–10, 2010; Beijing.
19. 3M Littmann Range. Available from: https://www.littmann.com/3M/ en_US/littmann-stethoscopes/. Accessed September 5, 2017. 20. Thinklabs One Digital. Available from: http://www.thinklabs.com/.
Accessed September 5, 2017.
21. Welch-Allyn Elite Electronic Stethoscope. Available from: https://www. welchallyn.com/content/welchallyn/americas/en/products/categories/ discontinued-products/physical-exam/stethoscopes.html. Accessed September 5, 2017.
22. Ekoscope. Available from: http://www.ekoscope.com/. Accessed September 5, 2017.
23. ViScope. Available from: http://hdmedicalgroup.com/our-products/ viscope/. Accessed September 5, 2017.
24. Makaryus AN, Makaryus JN, Figgatt A, et al. Utility of an advanced digital electronic stethoscope in the diagnosis of coronary artery disease compared with coronary computed tomographic angiography. Am J Cardiol. 2013;111(6):786–792.
25. Azimpour F, Caldwell E, Tawfik P, Duval S, Wilson RF. Audible coronary artery stenosis. Am J Med. 2016;129(5):515–521.
26. Thomas JL, Winther S, Wilson RF, Bøttcher M. A novel approach to diagnosing coronary artery disease: acoustic detection of coronary turbulence. Int J Cardiovasc Imaging. 2017;33(1):129–136.
27. Lakhe A, Sodhi I, Warrier J, Sinha V. Development of digital stethoscope for telemedicine. J Med Eng Technol. 2016;40(1):20–24.
28. Gurung A, Scrafford CG, Tielsch JM, Levine OS, Checkley W. Com-puterized lung sound analysis as diagnostic aid for the detection of abnormal lung sounds: a systematic review and meta-analysis. Respir Med. 2011;105(9):1396–1403.
29. Kaddoura T, Vadlamudi K, Kumar S, et al. Acoustic diagnosis of pulmo-nary hypertension: automated speech-recognition-inspired classification algorithm outperforms physicians. Sci Rep. 2016;6:33182.
30. MEDPAGE TODAY®. iMedicalApps: non-invasive devices for heart disease screening. Available from: https://www.medpagetoday.com/ blogs/iltifathusain/67366. Accessed November 14, 2017.
31. Winther S, Nissen L, Schmidt SE, et al. Diagnostic performance of an acoustic-based system for coronary artery disease risk stratification. Heart. Epub 2017 Nov 9.
Medical Devices: Evidence and Research downloaded from https://www.dovepress.com/ by 118.70.13.36 on 24-Aug-2020