Effect of Cocoa Pods Storage on the Temperature
and Physicochemical Changes during Shallow Box
Fermentation
Khairul Bariah, S1, Fazilah, A.2 and Tajul A. Y.2
1
Cocoa Research and Development Centre Bagan Datuk, Perak, Malaysian Cocoa Board, P. O. Box 30, Sg. Dulang Road, 36307 Sg. Sumun, Perak, Malaysia
2
Food Technology Division, School of Industrial Technology, Universiti Sains Malaysia, 11800 Pulau Pinang, Malaysia
Abstract
The effect of four pods storage durations (PS0, PS2, PS4 and PS6) on temperature, total soluble solids (TSS) and acidity during cocoa fermentation using shallow box was evaluated. The study demonstrated the temperature for the PS4 and PS6 were increased significantly (P <0.05) to 43.3°C and 44.4°C after 24 hours. The TSS value for the PS0 increased significantly to 25.43°Brix after 120 hours of fermentation, but for the PS2, PS4 and PS6 were decreased. The pH values of pulps for the PS0, PS2, PS4 and PS6 were increased significantly to 5.04, 5.16, 5.44 and 6.30, respectively. Inversely, the pH of wet cocoa beans significantly decreased (P <0.05) to the final pH of 5.08, 5.16, 5.31 and 5.24 for PS0, PS2, PS4 and PS6, respectively. Meanwhile, TA either in the cocoa pulps or in wet beans were inversely proportional to the pH value.
Keywords: Pods Storage Duration, Cocoa Fermentation, Temperature, Total Soluble Solids, Acidity, Shallow box.
1. Introduction
Theobroma cacao L., commonly known as cocoa and has been reclassified into the Malvaceae family (Bayer & Kubitzki, 2003). The seeds inside the fruit are the main ingredient in chocolate production and its derivatives (Sousa et al., 2016), which encompassed three parts ie mucilaginous pulp, seed coat and cotyledon. The most outer parts that surrounding the seed are white and sweet mucilaginous pulp, where the microbial activities take place and a decisive factor on the outcome of the fermentation step (Dennis, 2006). Inside of the seeds is cotyledon as main part, which consists of two convoluted cotyledons and have unpleasant taste with no any chocolate flavour (Voigt & Lieberei, 2014). The seeds need to undergo fermentation process to develop the chocolate flavour precursor (Voigt & Lieberei, 2014).
Basically, the fermentation process is conducted by customarily piled the cocoa seeds into heaps or in
container. The fermentation spontaneously starts with succession of microbial namely yeasts, lactic acid bacteria (LAB), and acetic acid bacteria (AAB) at the pulp. Their activities especially yeast resulted in increased of fermenting mass temperature and liquefied of the pulp. At the same time, ethanol as well as organic acids predominantly acetic acid were produced and diffused into the cocoa beans (De Vuyst & Wecks, 2016; Ho et al., 2014). Following the diffusion of ethanol and organic acid into beans, stimulates the onset of complex biochemical reactions such as induction of the proteolysis by aspartic endoprotease and carboxypeptidase, and hydrolysis of phenolic component (Sousa et al., 2016; Voigt & Lieberei, 2014).
The production of high quality dried cocoa beans is a result from the good fermentation process. The fermentation process which involving the physicochemical changes inside and outside of the beans is influenced by various factors (Hernández-Hernández et al., 2016). Consequently, the changes of temperature and acidity are suggested as indicator to the proper fermentation process. During fermentation, the temperature of fermenting mass is reported to increase from ambient temperature towards exceeding 40°C before decreased (Hernández-Hernández et al., 2016; De Vuyst & Weckx, 2016). Whereas, the acidity of the fermenting mass (pulp) is changing from acidic in range of 3.3 - 4.0 to less acidic, 4.21 - 4.90 at the end of fermentation (Moreira, et al., 2013). However, pods storage and fermentation technique are reported to affect the temperature and the physicochemical changes of cocoa beans.
www.ijiset.com content of Malaysian cocoa beans. Although implement of
the pods storage prior fermentation managed to improve cocoa flavour especially excessive acidity problem, the beans are prone to over-fermentation and to date, no further study is carried out to overcome the problem. In addition, recent studies on the effect of pods storage duration using heap fermentation to Ghanaian cocoa are reported that pods storage for more than seven days increased the FFA levels (Afoakwa et al., 2013; 2011). Therefore, this study focused on the effect of pods storage duration using shallow box technique on selected biochemical changes in wet beans.
2. Material and method
2.1 Cocoa pods
Healthy cocoa pods of mixed clones were harvested from the Cocoa Research and Development Centre (CRDC), Hilir Perak, Perak, Malaysia. The pods were harvested at the same maturity level as described by Ahmad Kamil et al. (2011) and according to predetermined storage duration.
2.2 Pods storage
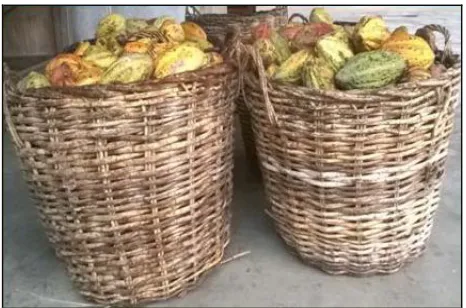
The harvested pods were transported to a fermentary where the experiments carried out. Upon arrival, the pods were sorted and damage pods taken out. The pods were stored in baskets with dry and well aerated conditions under a roof as described by Biehl et al. (1989) and labeled according to storage duration ie. zero (PS0), two (PS2), four (PS4) and six (PS6) days (Figure 1). Prior to fermentation, the pods were split opened and fresh seeds extracted manually. Only healthy fresh seeds were used for fermentation trial.
Fig. 1 Storage pods in the basket under roof at predetermined duration.
2.3a Cocoa fermentation
Fermentation was carried out simultaneously in shallow box measuring 90 cm X 60 cm X 31 cm (Figure 2) for maximum days of five. A total of 150 kg fresh seeds were placed in the first box and covered with clean gunny sack. Turning was done at 72 hours by transferring the fermenting mass from one box to another.
Fig. 2 Fermentation was carried out concurrently in shallow box.
2.3b Sampling and samples preparation
About 500 g of wet fermented cocoa beans were taken out diagonally from the top, middle and the bottom layer of fermenting mass according to Khairul Bariah, (2014) at predetermined time of 0, 24, 48, 72, 96 and 120 hours of fermentation. Subsequently, the beans combined uniformly and divided into four quarter by cross with each quarter consist about 125 g of wet fermented beans. The pulp containing testa of the beans was then separated from cotyledon (known as nib after fermentation) by peeled using scalpel. Liquid nitrogen was poured on the samples in between the process to ensure the samples remain intact. Afterwards, the pulp containing testa and nib were weighed using analytical balance (Adam AAA250LE), placed into separated Falcon tube and labeled accordingly before stored at -80ºC for further analysis.
2.4 Analyses
2.4a Temperature
2.4b Total soluble solids
The total soluble solids (TSS) of the cocoa pulp were measured using an Atago Digital Hand-held Pocket Refractometer PAL-1 as described by Paddaa et al., (2011) with slight modification. About 1.0 gram of pulp containing testa prepared earlier was added with 1 ml distilled water (v/v). The mixture was homogenised for 30 sec and subsequently filtered through 4 layers of cheesecloth. The filtrate was collected and prepared in triplicate. The total soluble solids were measured by placing 100 µl of filtrate onto the refractometer. The measurement was taken in triplicate and reported as an average °Brix.
2.4c Acidity
The acidity level was determined in cocoa pulps and wet cocoa nibs by pH measurement and Titratable Acidity (TA). The pH was determined according to Khairul Bariah, (2014) with slight modification where about 10 g of the cocoa pulp containing testa or cocoa nibs were added with 90 ml of boiling distilled water. The mixtures were homogenate for two minutes before filtered using Whatman No. 1 filter paper. The collected filtrate was divided into three aliquots with approximately 25 mL each and left to cool at ambient temperature. The pH of each aliquot was read in triplicate using a pH meter and reported as an average. Subsequently, the aliquots were further used for titration analysis as described by Nazaruddin et al., (2006) with slight modification. In which the aliquots titrated with 0.1N NaOH to an endpoint pH of 8.1 and results were reported as average Meq of NaOH and calculated using the following formula;
(3.1)
Vtitr = total volume of titrant to reach the end point in ml
N = Normality of titrant
Ws = weight of sample
Eq.wt= Equivalent weight of NaOH
2.5 Statistical analysis
The experiment was design as 4 x 6 factorial arrangement of duration of pod storage (0, 2, 4 and 6 days) and duration of fermentation (0, 1, 2, 3, 4 and 5 days) and laid out in a Completely Randomised Design (CRD). Data was analyzed using ANOVA followed by mean comparison by Turkey test at p <0.05 levels with using Minitab version 16.1.0
3. Result and Discussion
3.1 Changes of Temperature
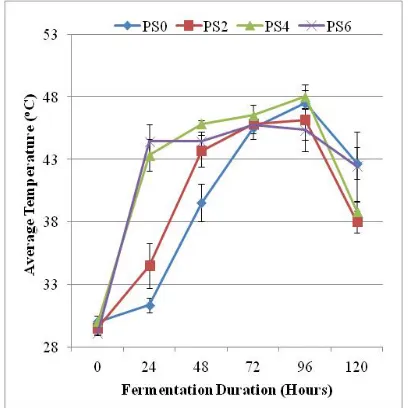
Overall, the changes of temperature in all the fermenting mass were indicated the onset of fermentation. The temperature changes of the fermenting mass from different pods storage duration throughout the fermentation process were shown in Fig 3. In the beginning, the temperature of all the fermenting mass was almost same but in between 0 to 72 hours of fermentation, the temperature increased significantly at different rates. The temperature for the batches of PS6 and PS4 were reached to more than 40°C as early as 24 hours. Whereas, the PS2 and PS0 only reached teh respective temperature at 48 and 72 hours of fermentation, respectively. It was also observed that the temperature of all the fermenting mass approached each other at 72 hours of fermentation.
Fig. 3 Changes of the temperature at the different duration of pods storage and fermentation. PS0 for zero days, PS2 for two days, PS4 for four days and PS6 for six
days of pods storage.
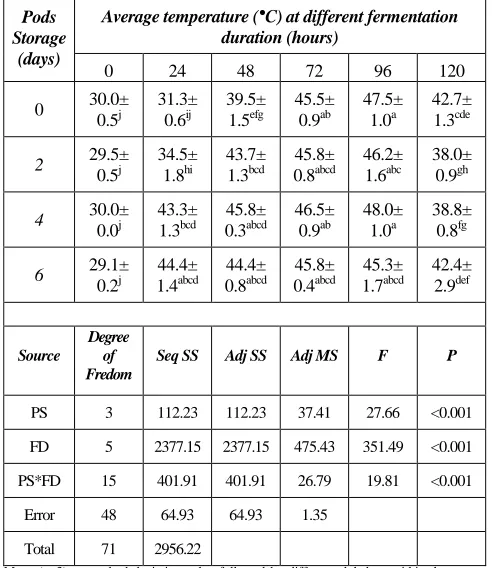
www.ijiset.com Statistical analysis distinguished the duration of pods
storage has significantly (F15, 48=19.81, p<0.001) interaction effect with fermentation on the temperature changes (Table 1). Multiple comparisons by Tukey Method revealed that the temperature changes only significantly different at 24, 48 and 120 hours of fermentation.
Table 1: Comparison of the temperature (°C) of fermenting mass among different storage and fermentation duration
Pods Storage
(days)
Average temperature (°C) at different fermentation duration (hours)
0 24 48 72 96 120
0 30.0±
0.5j
31.3± 0.6ij
39.5± 1.5efg
45.5± 0.9ab
47.5± 1.0a
42.7± 1.3cde
2 29.5±
0.5j
34.5± 1.8hi
43.7± 1.3bcd
45.8± 0.8abcd
46.2± 1.6abc
38.0± 0.9gh
4 30.0±
0.0j
43.3± 1.3bcd
45.8± 0.3abcd
46.5± 0.9ab
48.0± 1.0a
38.8± 0.8fg
6 29.1±
0.2j
44.4± 1.4abcd
44.4± 0.8abcd
45.8± 0.4abcd
45.3± 1.7abcd
42.4± 2.9def
Source
Degree of Fredom
Seq SS Adj SS Adj MS F P
PS 3 112.23 112.23 37.41 27.66 <0.001
FD 5 2377.15 2377.15 475.43 351.49 <0.001
PS*FD 15 401.91 401.91 26.79 19.81 <0.001
Error 48 64.93 64.93 1.35
Total 71 2956.22
Mean (n=3) ± standard deviation value followed by different alphabets within the same
column were significantly different at p<0.05.
The observations coincided with previous researched, where pods storage for few days prior to fermentation will drastically be increased the temperature (Hollywood, et al., 2008). Meanwhile, the increment in temperature of the fermenting mass using pods without storage was delayed for the first 24 hours (Albertini, et al., 2015). This might due to the fact that during storage, pods still have metabolic activities which are respiration and transpiration (Paul and Pandey, 2014), which will be resulted in the breakdown of carbohydrate and release of moisture (Rab, et al., 2015). When the seeds were subjected to the fermentation process, the pulp viscosity became reduced; hence allowed better aeration into the fermenting mass. At the same time, yeasts actively metabolize the remaining carbohydrate to produce ethanol. Ethanol production is an
exothermic process, which causes a temperature increase, hence faster the fermentation (De Vuyst and Weckx, 2016).
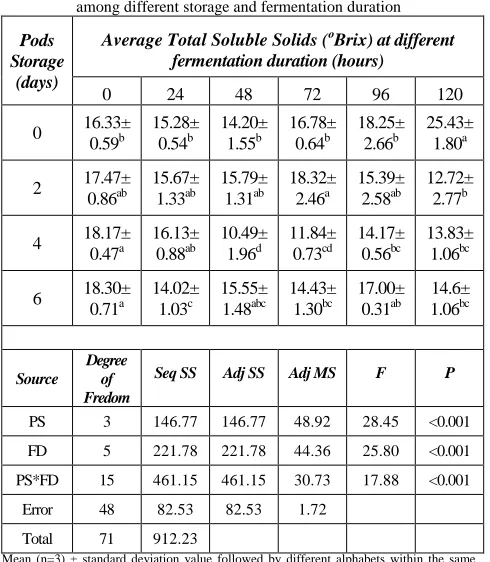
3.2 Changes of Total Soluble Solids
This study reveled that duration of pods storage and fermentation have significant (F15, 48=17.88, p<0.001) effect on the changes of the total soluble solids in pulp (Table 2). The total soluble solids in the pulp for the PS0 batch were significantly lower compared to the batches of PS6 and PS4 but not for the PS2 batch. During fermentation, the total soluble solids for all the samples exhibited similar decreasing trend at the beginning of 24 hours fermentation. But the changes of the total soluble solids were inconsistent afterwards. The total soluble solids in the pulp for the respective batches of PS4 and PS0 were continued to decrease until 48 hours of fermentation before increased afterwards. Whereas, the total soluble solids in the pulp for the PS2 batch was continued to increase until 72 hours of fermentation before decreased until fermentation was terminated at 120 hours. On the other hand, the total soluble solids in the pulp for the PS6 batch was fluctuated up and down in between 24 to 120 hours of fermentation durations.
Cocoa is non-climacteric fruit, where it not capable to continue their ripening process after harvested but will begin to decay. During this decayed process, the fruit will experience breakdown of complex carbohydrates (Rab, et al., 2015). Thus, might be resulted in increase of the total soluble solids during the storage. Storage study in other fruits pulp such as tangerine citrus (Hassan, et al., 2014), mango (Hossain, et al., 2014) and guava (Islam, et al., 2008), exhibited similar findings, where the total soluble solids increased when the duration of storage extended. Storage of fruit up to a certain period was suggested will result in increased of total soluble solids content which due to hydrolysis of starch into sugar (Islam, et al., 2008).
3.3 Changes of Acidity
Table 2: Comparison of the total soluble solids (ᴏBrix) in cocoa pulps among different storage and fermentation duration
Pods Storage
(days)
Average Total Soluble Solids (ᴏBrix) at different fermentation duration (hours)
0 24 48 72 96 120
0 16.33± 0.59b
15.28± 0.54b
14.20± 1.55b
16.78± 0.64b
18.25± 2.66b
25.43± 1.80a
2 17.47± 0.86ab
15.67± 1.33ab
15.79± 1.31ab
18.32± 2.46a
15.39± 2.58ab
12.72± 2.77b
4 18.17± 0.47a
16.13± 0.88ab
10.49± 1.96d
11.84± 0.73cd
14.17± 0.56bc
13.83± 1.06bc
6 18.30± 0.71a
14.02± 1.03c
15.55± 1.48abc
14.43± 1.30bc
17.00± 0.31ab
14.6± 1.06bc
Source
Degree of Fredom
Seq SS Adj SS Adj MS F P
PS 3 146.77 146.77 48.92 28.45 <0.001
FD 5 221.78 221.78 44.36 25.80 <0.001
PS*FD 15 461.15 461.15 30.73 17.88 <0.001
Error 48 82.53 82.53 1.72
Total 71 912.23
Mean (n=3) ± standard deviation value followed by different alphabets within the same
column were significantly different at p<0.05.
Table 3: Comparison of the pH in cocoa pulps among different storage and fermentation duration
Pods Storage
(days)
Average pH of cocoa pulps at different fermentation duration (hours)
0 24 48 72 96 120
0 3.99 ± 0.01jk
4.01 ± 0.02j
3.79 ± 0.01m
4.42 ± 0.01gh
4.58 ± 0.01f
5.04 ± 0.02d
2 4.29 ± 0.02i
3.85 ± 0.02lm
3.89 ± 0.01kl
4.48 ± 0.01fg
4.53 ± 0.00f
5.16 ± 0.03c
4 4.32 ± 0.02i
3.89 ± 0.02lm
4.30 ± 0.03i
4.51 ± 0.02fg
4.73 ± 0.00e
5.44 ± 0.05b
6 4.33 ± 0.01hi
3.93 ± 0.01jkl
4.49 ± 0.01fg
4.70 ± 0.14e
5.16 ± 0.01c
6.30 ± 0.01a
Source Degree of
Fredom
Seq SS Adj SS Adj MS F P
PS 3 2.83 2.83 0.95 892.57 <0.001
FD 5 19.13 19.13 3.83 3614.17 <0.001
PS*FD 15 2.22 2.22 0.15 140.13 <0.001
Error 48 0.05 0.05 0.001
Total 71 24.24
Mean (n=3) ± standard deviation value followed by different alphabets within the same
column were significantly different at p<0.05.
In contrast, the extended duration of pods storage exhibited lower pH in the nibs for the PS6 and PS4 batches with the respective value of 6.19 ± 0.01 and 6.14 ± 0.01 compared to 6.28 ± 0.01 in the PS0 batch (Table 4). But exceptional for the PS2 where the pH value was slightly higher. After 24 hours of fermentation, the pH of nib for the batches of PS6, PS4, PS2 and PS0 were decreased to 5.67 ± 0.01, 5.69 ± 0.02, 6.17 ± 0.01 and 6.14 ± 0.01, respectively. The decreasing trend of pH was continued until 72 hours of fermentation. However, after 96 hours the pH value in nib for the PS0 batch was still decreased whereas PS2, PS4 and PS6 increased. The final pH values in all the wet fermented beans after 120 hours of fermentation were 5.08 ± 0.01, 5.16 ± 0.01, 5.31 ± 0.01 and 5.24 ± 0.01 for the batches of PS0, PS2, PS4 and PS6, respectively.
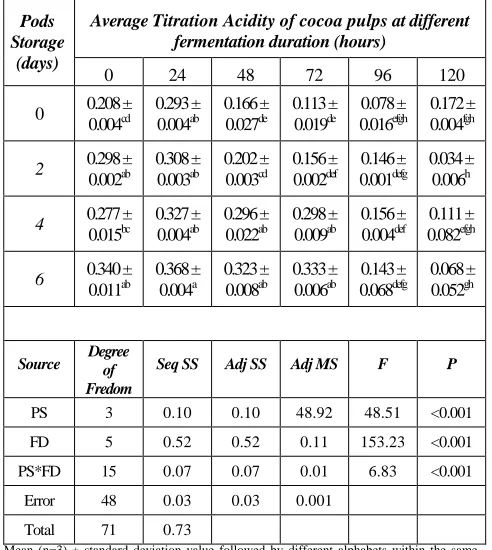
Additionally, titratable acidity (TA) in both pulp and nib were inversely corresponded to the pH trend (Table 5 and 6). Although the TA values fluctuated, overall the TA trend in pulp was significantly decreased, otherwise in nib increased. Statistical analysis demonstrated that the duration of pods storage and fermentation as well as their interaction have a significant effect on the changes of the pH in pulp (Table 3) and wet cocoa beans (Table 4). Similar findings were observed for the changes of TA in wet cocoa nibs (Table 6), but in cocoa pulp, the changes were only significant at the 0, 48 and 72 hours of fermentation (Table 5).
www.ijiset.com Table 4: Comparison of the pH in wet cocoa nibs among different
storage and fermentation duration
Pods Storage
(days)
Average pH of wet cocoa nibs at different fermentation duration (hours)
0 24 48 72 96 120
0 6.28±
0.01b 6.14± 0.01d 5.47± 0.02f 5.09± 0.01l 5.00± 0.01m 5.08± 0.01l
2 6.32±
0.01a 6.17± 0.01cd 5.40± 0.01g 4.93± 0.02o 4.94± 0.01no 5.16± 0.01k
4 6.14±
0.01d 5.69± 0.02e 5.10± 0.01l 5.21± 0.02j 5.32± 0.02h 5.31± 0.01h
6 6.19±
0.01c 5.67± 0.01e 5.27± 0.01i 4.97± 0.02mn 5.33± 0.01h 5.24± 0.01ij
Source Degree of
Fredom
Seq SS Adj SS Adj MS F P
PS 3 0.04 0.04 0.01 98.75 <0.001
FD 5 13.97 13.97 2.79 19292.67 <0.001
PS*FD 15 1.54 1.54 0.10 710.29 <0.001
Error 48 0.01 0.01 0.0001
Total 71 15.56
Mean (n=3) ± standard deviation value followed by different alphabets within the same
column were significantly different at p<0.05.
Table 5: Comparison of the titration acidity in cocoa pulps among different storage and fermentation duration
Pods Storage
(days)
Average Titration Acidity of cocoa pulps at different fermentation duration (hours)
0 24 48 72 96 120
0 0.208 ± 0.004cd 0.293 ± 0.004ab 0.166 ± 0.027de 0.113 ± 0.019de 0.078 ± 0.016efgh 0.172 ± 0.004fgh
2 0.298 ± 0.002ab 0.308 ± 0.003ab 0.202 ± 0.003cd 0.156 ± 0.002def 0.146 ± 0.001defg 0.034 ± 0.006h
4 0.277 ± 0.015bc 0.327 ± 0.004ab 0.296 ± 0.022ab 0.298 ± 0.009ab 0.156 ± 0.004def 0.111 ± 0.082efgh
6 0.340 ± 0.011ab 0.368 ± 0.004a 0.323 ± 0.008ab 0.333 ± 0.006ab 0.143 ± 0.068defg 0.068 ± 0.052gh
Source Degree of
Fredom
Seq SS Adj SS Adj MS F P
PS 3 0.10 0.10 48.92 48.51 <0.001
FD 5 0.52 0.52 0.11 153.23 <0.001
PS*FD 15 0.07 0.07 0.01 6.83 <0.001
Error 48 0.03 0.03 0.001
Total 71 0.73
Mean (n=3) ± standard deviation value followed by different alphabets within the same
column were significantly different at p<0.05.
Table 6: Comparison of the titration acidity (TA) in wet cocoa nibs among different storage and fermentation duration
Pods Storage
(days)
Average titration acidity of wet cocoa nibs at different fermentation duration (hours)
0 24 48 72 96 120
0 0.053 ± 0.007ij 0.093 ± 0.025hij 0.240 ± 0.028efg 0.400 ± 0.083b 0.507 ± 0.049a 0.333 ± 0.015bcd
2 0.007 ± 0.001j 0.013 ± 0.003j 0.117 ± 0.025hi 0.267 ± 0.008def 0.371 ± 0.032bc 0.299 ± 0.033cde
4 0.067 ± 0.009ij 0.171 ± 0.009gh 0.209 ± 0.008fg 0.268 ± 0.009def 0.288 ± 0.002cdef 0.236 ± 0.029efg
6 0.063 ± 0.008ij 0.237 ± 0.034efg 0.288 ± 0.008cdef 0.353 ± 0.025bcd 0.309 ± 0.029cde 0.205 ± 0.025fg
Source Degree of
Fredom
Seq SS Adj SS Adj MS F P
PS 3 0.09 0.09 0.03 38.13 <0.001
FD 5 0.88 0.88 0.18 226.58 <0.001
PS*FD 15 0.21 0.21 0.01 17.88 <0.001
Error 48 0.04 0.04 0.001
Total 71 1.21
Mean (n=3) ± standard deviation value followed by different alphabets within the same
column were significantly different at p<0.05.
4. Conclusions
This study revealed that the pods storage was significantly influenced the changes of the temperature, the total soluble solids and acidity either pH or TA in cocoa pulps as well as nibs during the fermentation process. Statistical analysis by General Linear Model (GLM) ANOVA revealed that both factors ie duration of pods storage and duration of fermentation have significantly interaction effect on the changes of the temperature (F15, 48=19.81, p<0.001), the total soluble solids (F15, 48=17.88, p<0.001) and acidity either pH (F15, 48=140.13, p<0.001) in pulps or nibs (F15, 48=710.29, p<0.001) as well as TA (F15, 48=6.83, p<0.001) in pulps or nibs (F15, 48=17.88, p<0.001), suggested that the increased of pods storage duration will shorten the fermentation duration using shallow box technique.
Acknowledgments
Board for for permission to present this paper. Thanks also extended to the staff of Primary Processing Unit, Cocoa Research and Development Centre Bagan Datuk, Malaysian Cocoa Board (MCB).
References
[1] Afoakwa, E.O., Kongor, J.E., Takrama, J.F., and Budu, A.S. (2013). Changes in acidification, sugars and mineral composition of cocoa pulp during fermentation of pulp pre-conditioned cocoa (Theobroma cacao) beans. Int J Food Sci Nutr., 20(3): 1215 - 1222.
[2] Afoakwa, E.O., Quao, J., Takrama, J.F., Budu, A.S. and Saalia, F.K. (2011). Effect of pulp preconditioning on acidification, proteolysis, sugars and free fatty acids concentration during fermentation of cocoa (Theobroma cacao) beans. Int J Food Sci Nutr., 62(7): 755 - 764.
[3] Ahmad Kamil, M.J., Alias, A., Azmi, C.A., Boney, M., Harnie, H., Haya, R., Khairul Bariah, S., Lee, C.H., Meriam, M.Y., Mohd Yusoff, A.S., Mohd Zamri, A. Ghani, Mohamed Helmi, S., Navies, M., Nuraziawati, M.Y., Nurfadzilah, M., Rozita, O., Saripah, B. and Shari Fuddin, S. (2013). Cocoa Planting Manual, Sustainable Cocoa. Sabah, Malaysia: Malaysian Cocoa Board.
[4] Albertini, B., Schoubben, A., Guarnaccia, D., Pinelli, F., Vecchia, M.D., Ricci, M., Di Renzo, G. C., and Blasi, P. (2015). Effect of Fermentation and Drying on Cocoa Polyphenols. J. Agric. Food Chem, 63(45): 9948 - 9953. [5] Bayer & Kubitzki, (2003)
[6] Biehl, B., Meyer, B., Crone, G., Pollmann, L. and Said, M. B. (1989). Chemical and physical changes in the pulp during ripening and post-harvest storage of cocoa pods. Journal of the Science Food and Agriculture, 48: 189 - 208.
[7] De Vuyst, L. and Weckx, S. (2016). The cocoa bean fermentation process: from ecosystem analysis to starter culture development. Journal of Applied Microbiology, 121: 5 - 17.
[8] Dennis, N.S. (2006). The microbiology of Ghanaian cocoa fermentations. PhD thesis, Royal Veterinary and Agricultural University, Copenhagen, Denmark
[9] Hassan, Z.H., Lesmayati, S., Qomariah, R. and Hasbianto, A. (2014). Effects of Wax Coating Applications and Storage Temperatures on the Quality of Tangerine Citrus (Citrus reticulata) var. Siam Banjar. International Food Research Journal, 21: 641 - 648.
[10] Hernández-Hernández, C., López-Andrade, P.A., Ramírez-Guillermo, M.A., Ramírez, D.G. and Caballero Pérez, J. F. (2016). Evaluation of different fermentation processes for use by small cocoa growers in Mexico. Food Science & Nutrition, 4(5): 690–695.
[11] Hollywood, N., Toan, H.T and Thanh, N.V. (2008). Cocoa Processing Methods for the Production of High Quality Cocoa in Vietnam. Australian Government (18 p.).
[12] Hossain, Md.A., Masud Rana, Md., Kimura, Y. and Hairul Azman, R. (2014). Changes in Biochemical Characteristics and Activities of Ripening Associated Enzymes in Mango Fruit during the Storage at Different Temperatures. BioMed Research International, 11 pages.
http://dx.doi.org/10.1155/2014/232969
[13] Islam, F., Islam, A., Al Munsur, M.A.Z. and Rahim, M.A. 2008. Shelf life and quality of guava cv. Kazi as affected by stages of ripening, storage temperature and wrapping materials. Progress. Agric. 19(2): 1 - 12.
[14] Jespersen, L., Nielsen, D.S., Hønholt, S., Jakobsen, M. (2005). Occurrence and diversity of yeasts involved in fermentation of West African cocoa beans. FEMS Yeast Research, 5: 441–453.
[15] Khairul Bariah, S. (2014). Impact of fermentation duration on the quality of Malaysian cocoa beans using shallow box. KKU Res. J. 19(Suppl. I.): 74-80.
[16] Moreira, I. M. V., Miguel, M. G. C. P., Duarte, W. F., Dias, D. R., and Schwan, R. F. (2013). Microbial succession and the dynamics of metabolites and sugars during the fermentation of three different cocoa (Theobroma cacao L.) hybrids. Food Res Int, 54: 9–17.
[17] Nazaruddin, R., Seng, L.K., Hassan, O. and Said, M. (2006). Effect of pulp preconditioning on the content of polyphenols in cocoa beans (Theobroma cacao) during fermentation. Industrial Crops and Production 24(1): 87–94.
[18] Padaa, M.S., do Amarante, C.V.T., Garcia, R.M., Slaughter, D.C. and Mitcham, E.J. (2011). Methods to analyze physico-chemical changes during mango ripening: A multivariate approach. Postharvest Biology and Technology 62: 267 - 274.
[19] Paul, V. and Pandey, R. (2014). Role of internal atmosphere on fruit ripening and storability—a review. Journal of Food
Science and Technology, 51(7):
1223-1250. http://doi.org/10.1007/s13197-011-0583-x
[20] Rab, A., Najia, Sajid, M., Bibi, F., Jan, I., Nabi G. and Nawab, K. (2015). Quality changes in heat treated sweet orange fruit during storage at low temperature. The Journal of Animal & Plant Sciences, 25(3): 661-668.
[21] Sousa, L.S., Rocha, F.S., Silveira, P.T.S., Bispo, E.S. and Soares, S.E. (2016). Enzymatic activity of proteases and its isoenzymes in fermentation process in cultivars of cocoa (Theobroma cacao L.) produced in southern Bahia, Brazil. Food Sci. Technol (Campinas), 36(4): 656 – 663.
[22] Voigt, J. and Lieberei, R. (2014). Biochemistry of Cocoa Fermentation. In: Schwan, S.F. and Fleet, G.H. (Eds.). Cocoa and Coffee Fermentation (pp. 194 - 226). Boca Raton: CRC press.