Open Access
Proceedings
Multilocus analysis of GAW15 NARAC chromosome 18
case-control data
Sharon R Browning* and Jessica Thomas
Address: Department of Statistics, The University of Auckland, Private Bag 92019, Auckland, New Zealand
Email: Sharon R Browning* - [email protected]; Jessica Thomas - [email protected] * Corresponding author
Abstract
The Genetic Analysis Workshop 15 rheumatoid arthritis data included a set of 460 cases and 460 controls genotyped at 2300 closely spaced markers on a 10 megabase region of chromosome 18q. We conducted a multilocus analysis of these data using a localized haplotype clustering method that adapts to linkage disequilibrium structure and can be applied to large, densely genotyped data sets such as this one. We found a protective haplotype carried by 33 individuals that was significantly associated with rheumatoid arthritis in these data after adjusting for multiple testing. This haplotype was located less than 500 base pairs upstream of the CCBE1 gene. The association was not detected using single-marker tests, but could be found using a variety of multilocus tests.
Background
Multilocus data analysis has potential for improved power over single marker testing for association studies. Relative power of single-marker and multilocus methods is determined by a number of factors [1], particularly the frequency of the causal variant, which is a proxy for the age of the mutation [2]. Recent work has demonstrated that haplotypic methods can have higher power than sin-gle-marker methods for ungenotyped causal variants with population frequencies of 5% or less, under realistic sce-narios [3]. In the absence of information about the fre-quency of a causal variant, a good strategy is to apply both single-marker and haplotypic cluster tests.
Multiple testing adjustment is critical for analyses involv-ing large numbers of tests, in order to determine whether
the most significant associations are likely to be true asso-ciations or are only noise. For highly correlated tests a Bonferroni correction is excessively conservative. Permu-tation testing [4] provides a means of controlling family-wise error rates without being overly conservative, but it is often considered to be infeasible due to computational constraints. Beagle is a new program that performs single-marker and multilocus analysis, and adjusts for the multi-ple tests performed with permutation testing, while being computationally fast even on large data sets [3]. The type of multilocus test that Beagle uses is a localized haplotype cluster test [5].
Genetic Analysis Workshop (GAW) 15 Problem 2 involved studies designed to investigate genetic risk fac-tors for rheumatoid arthritis. One of these studies from Genetic Analysis Workshop 15
St. Pete Beach, Florida, USA. 11–15 November 2006
Published: 18 December 2007
BMC Proceedings 2007, 1(Suppl 1):S11
<supplement> <title> <p>Genetic Analysis Workshop 15: Gene Expression Analysis and Approaches to Detecting Multiple Functional Loci</p> </title> <editor>Heather J Cordell, Mariza de Andrade, Marie-Claude Babron, Christopher W Bartlett, Joseph Beyene, Heike Bickeböller, Robert Culverhouse, Adrienne Cupples, E Warwick Daw, Josée Dupuis, Catherine T Falk, Saurabh Ghosh, Katrina A Goddard, Ellen L Goode, Elizabeth R Hauser, Lisa J Martin, Maria Martinez, Kari E North, Nancy L Saccone, Silke Schmidt, William Tapper, Duncan Thomas, David Tritchler, Veronica J Vieland, Ellen M Wijsman, Marsha A Wilcox, John S Witte, Qiong Yang, Andreas Ziegler, Laura Almasy and Jean W MacCluer</editor> <note>Proceedings</note> <url>http://www.biomedcentral.com/content/pdf/1753-6561-1-S1-info.pdf</url> </supplement>
This article is available from: http://www.biomedcentral.com/1753-6561/1/S1/S11 © 2007 Browning and Thomas; licensee BioMed Central Ltd.
involved a dense panel of 2300 single-nucleotide poly-morphisms (SNPs) that were genotyped in cases and con-trols on a 10 megabase region of chromosome 18q. This region has shown evidence for linkage to rheumatoid arthritis in U.S. and French linkage scans [6,7]. The geno-typed individuals included 460 rheumatoid arthritis cases and 460 controls collected by the North America Rheuma-toid Arthritis Consortium (NARAC). The controls were recruited from a New York City population [GAW15 Problem 2 data description].
We applied a localized haplotype-cluster test [5] to these data using Beagle, and found an association with a rare protective haplotype located upstream of the CCBE1 gene. Other types of multilocus test confirmed this association.
Methods
Quality control and ethnicity
As a quality control measure, we tested for Hardy-Wein-berg disequilibrium (HWD) in controls using an exact test. One marker had a HWD p-value of 3.1 × 10⁻¹²
(SNP194), which is clearly significant after correction for multiple testing. We removed all markers with p-values less than 10-4, which was a total of five markers (SNPs
194, 386, 794, 811, 1957). We also checked rates of miss-ing data. One case individual (Family ID 09082 and indi-vidual ID 200) had no genotypes, and was removed from the analysis. All other individuals had at most 6% missing data, and all SNPs had at most 8% missing data, which we felt was acceptable.
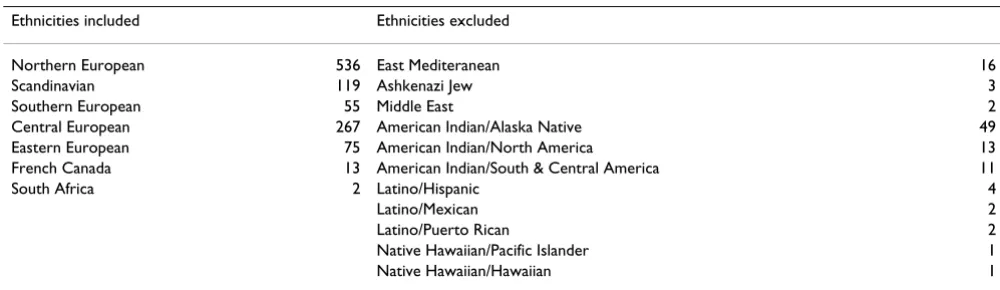
All the individuals self-identified as White. All but 144 also provided one or more ethnic subclassifications. These are shown in Table 1. To try to keep the sample ethnically homogenous without reducing the sample size too much, we excluded any individuals with ethnicities shown in the right column of Table 1. In total, 74 individuals were excluded on these grounds. This ethnicity exclusion was performed prior to analysis. Subsequent to the association
analysis, we further investigated the ethnicity of individu-als carrying a significant haplotype that was identified in the association analysis.
Localized haplotype cluster analysis
The localized haplotype cluster method [5] empirically models the linkage disequilibrium structure in densely spaced genetic markers to derive haplotype clusters that are localized to specific positions. The approach is similar to a haplotype block approach, in that it adapts to local linkage disequilibrium, but it is more flexible and does not impose a block structure on the data. The fitted hap-lotype clusters are tested for association with case-control status, and permutation of case-control status can be used to correct for multiple testing [3,4].
The localized haplotype cluster method takes as input phased haplotype data with imputed missing values. We used fastPHASE version 1.1 [8] to do the phasing and imputation. We found that with this amount of data, increasing the number of clusters (parameter K) improved the quality of the phasing (measured by accuracy in infer-ring masked data), as did increasing the number of itera-tions of the expectation-maximization (EM) algorithm (parameter C). We used C = 40 and K = 30 for the haplo-type data used in subsequent analyses, although using default values (C = 25 and K = 10) gave almost identical results in the localized haplotype cluster analysis. Haplo-types were phased without regard to trait status.
Using the phased haplotypes, we fit a localized haplotype model. We used the fitted model to perform localized haplotype cluster tests [5] (4345 tests; Fisher's exact test applied to each haplotype cluster). We also performed single-marker allelic tests, with inferred missing data from the fastPHASE analysis, using Fisher's exact test (2295 tests). Using permutation, we adjusted for multiple test-ing, adjusting simultaneously for both classes of test (a
Table 1: Numbers of individuals reporting the ethnicities shown
Ethnicities included Ethnicities excluded
total of 6640 tests). All these analyses were conducted with the Beagle program [3].
Other analyses
For comparison with the localized haplotype cluster tests, we ran a multilocus score test [9] and a haplotype block-based test using Haploview version 3.32 [10]. We also used Haploview to investigate the linkage disequilibrium structure around an area showing significant association. Default settings were used for Haploview except where otherwise noted.
Results
Significant haplotype association with rheumatoid arthritis
The localized haplotype cluster analysis detected an asso-ciation that was significant after adjustment for multiple testing. The p-value for this cluster was 6.13 × 10⁻⁶ before
adjustment for multiple-testing, and 0.012 after adjusting for multiple testing (10,000 permutations), including adjustment for single-marker tests as well as all the local-ized haplotype cluster tests [3]. None of the single-marker test p-values were less than 0.2 after adjusting for multiple testing.
The significant haplotype cluster consisted of haplotypes having the sequence 2,1 at SNPs 1631 (rs2195534) and 1632 (rs1791320). These SNPs are located less than 500 base pairs upstream of CCBE1 (collagen and calcium binding EGF domains 1) on chromosome 18q21.32 (NCBI build 36.2, dbSNP build 126). SNPs 1515 to 1630 are located within this gene. Haplotypes in the sample with this 2,1 sequence at SNPs 1631 and 1632 also all share the sequence 1,1,2,1,1 at SNPs 1626 to 1630. A total of 32 of the individuals included in the analysis have this haplotype, of whom 29 are controls, so the haplotype is associated with reduced risk of rheumatoid arthritis. There was also one carrier (a case individual) among the
indi-viduals excluded from the analysis on grounds of ethnic-ity.
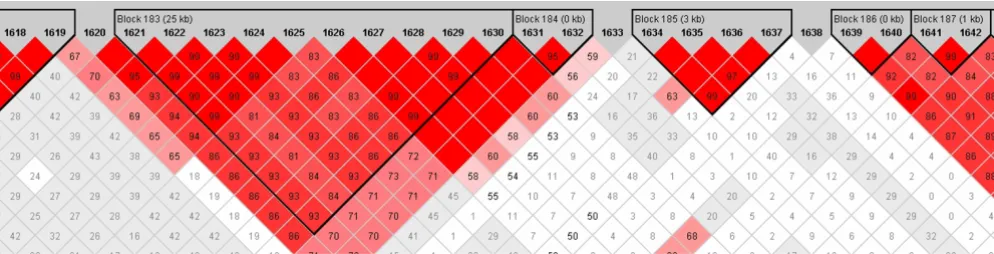
Figures 1 and 2 from Haploview show the linkage disequi-librium structure around the significant haplotype. SNPs 1631 and 1632 form a haplotype block that is in fairly strong LD with a block comprising SNPs 1621–1630 (Fig. 2).
Eight of the 32 carriers included in the analysis have some Eastern European ancestry, whereas only 72 of the 845 individuals included in the analysis have Eastern Euro-pean ancestry, so the haplotype is enriched in this ethnic group. All other ethnic groups had similar frequencies in the overall sample and in the carriers. All 8 individuals with Eastern European ancestry carrying the haplotype were controls. The 72 individuals with Eastern European ancestry included 37 cases and 35 controls. If the individ-uals with Eastern European ancestry are removed from the analysis, the haplotype is no longer significant after adjustment for multiple testing.
Comparison with other analysis methods
Single-marker allelic tests did not detect significant associ-ations after correction for multiple testing. The unad-justed p-values for single marker tests of SNPs 1631 and 1632 were 1.0 and 0.2, respectively. The smallest unad-justed p-value in the region consisting of SNPs 1620–1632 was 0.01 for SNP 1621, however the multiple-testing adjusted permutation p-values for all markers in this region were 1.0.
We ran a multilocus score test [9] with SNPs 1631 and 1632 on the same individuals used in the localized haplo-type clustering tests. For this test, the genohaplo-types at the SNPs are coded as 0, 1, or 2 depending on the number of copies of one of the alleles. Individuals with a missing genotype at one of the two SNPs were removed from the
Block structure around significant haplotype
Figure 1
analysis (four individuals). The test statistic was 15.0, yielding a p-value of 5.6 × 10⁻⁴ (tail of chi-square
distribu-tion with 2 degrees of freedom). We did not attempt to adjust for multiple testing because it is unclear what set of tests should be considered, but we note that the score test p-value is almost 100 times higher than that obtained using localized haplotype clustering (6.1 × 10⁻⁶) and thus
would probably not survive correction for multiple testing of all relevant marker sets in the data.
We used Haploview [10] to test for association between haplotypes defined by blocks (default settings) and case-control status, using the raw genotype data, with the same individuals used as in the other analyses. In total, 2300 single-marker tests and 1135 haplotype tests (from 264 blocks) were performed. The minimum unadjusted p-value was 1.7 × 10⁻⁵ obtained for haplotype "21" in the
block made up of SNPs 1631 and 1632. In 1000 permuta-tions, 24 obtained minimum p-values lower than the orig-inal minimum p-value, so that the multiple-testing adjusted p-value is 0.024, which is higher than that found using the localized haplotype cluster method. Although Haploview did not require data to be phased before input, it did take longer to do the permutation testing, with 1000 permutations running overnight, compared to 4 minutes for the 10,000 permutations of the haplotype cluster test with Beagle. Whereas Haploview takes a full likelihood-based EM approach to haplotype testing, Beagle uses inferred haplotypes, and constructs haplotype clusters without regard to case-control status, so that permutation-testing does not need to redefine the clusters or re-esti-mate the haplotypes and is very fast (for details, see Browning and Browning [3]).
Conclusion
Large genetic data sets such as this one pose computa-tional and statistical challenges. By using the Beagle soft-ware [3], we were able to use permutation to adjust for the multiple tests performed, including both single-marker
and localized haplotype cluster tests. We detected a signif-icant association with a protective haplotype located upstream of the CCBE1 gene. This haplotype is over-rep-resented in Eastern European individuals relative to other ethnicities in the sample, but the association does not appear to be a population structure artifact as roughly equal numbers of Eastern European cases and controls were included in the sample.
Competing interests
The author(s) declare that they have no competing inter-ests.
Acknowledgements
The authors thank Brian Browning for providing the Beagle software and for helpful comments. SB was supported by a grant from the University of Auckland Research Committee.
This article has been published as part of BMC Proceedings Volume 1 Sup-plement 1, 2007: Genetic Analysis Workshop 15: Gene Expression Analysis and Approaches to Detecting Multiple Functional Loci. The full contents of the supplement are available online at http://www.biomedcentral.com/ 1753-6561/1?issue=S1.
References
1. Akey J, Jin L, Xiong M: Haplotypes vs. single marker linkage dis-equilibrium tests: what do we gain? Eur J Hum Genet 2001,
9:291-300.
2. Schaid DJ: Evaluating associations of haplotypes with traits.
Genet Epidemiol 2004, 27:348-364.
3. Browning BL, Browning SR: Efficient multilocus association test-ing for whole genome association studies ustest-ing localized haplotype clustering. Genet Epidemiol 2007, 31:365-375. 4. Churchill GA, Doerge RW: Empirical threshold values for
quan-titative trait mapping. Genetics 1994, 138:963-971.
5. Browning SR: Multilocus association mapping using variable-length Markov chains. Am J Hum Genet 2006, 78:903-913. 6. Jawaheer D, Seldin MF, Amos CI, Chen WV, Shigeta R, Etzel C, Damle
A, Xiao X, Chen D, Lum RF, Monteiro J, Kern M, Criswell LA, Albani S, Nelson JL, Clegg DO, Pope R, Schroeder HW, Bridges SL, Pisetsky DS, Ward R, Kastner DL, Wilder RL, Pincus T, Callahan LF, Flemming D, Wener MH, Gregersen PK, North American Rheumatoid Arthritis Consortium: Screening the genome for rheumatoid arthritis susceptibility genes: a replication study and combined analy-sis of 512 multicase families. Arthritis Rheum 2003, 48:906-916.
LD structure around SNPs 1631 and 1632
Figure 2
Publish with BioMed Central and every scientist can read your work free of charge "BioMed Central will be the most significant development for disseminating the results of biomedical researc h in our lifetime."
Sir Paul Nurse, Cancer Research UK
Your research papers will be:
available free of charge to the entire biomedical community
peer reviewed and published immediately upon acceptance
cited in PubMed and archived on PubMed Central
yours — you keep the copyright
Submit your manuscript here:
http://www.biomedcentral.com/info/publishing_adv.asp
BioMedcentral
7. Osorio YFJ, Bukulmez H, Petit-Teixeira E, Michou L, Pierlot C, Cail-leau-Moindrault S, Lemaire I, Lasbleiz S, Alibert O, Quillet P, Bardin T, Prum B, Olson JM, Cornélis F: Dense genome-wide linkage analysis of rheumatoid arthritis, including covariates. Arthritis Rheum 2004, 50:2757-2765.
8. Scheet P, Stephens M: A fast and flexible statistical model for large-scale population genotype data: applications to infer-ring missing genotypes and haplotypic phase. Am J Hum Genet
2006, 78:629-644.
9. Chapman JM, Cooper JD, Todd JA, Clayton DG: Detecting disease associations due to linkage disequilibrium using haplotype tags: a class of tests and the determinants of statistical power. Hum Hered 2003, 56:18-31.
10. Barrett JC, Fry B, Maller J, Daly MJ: Haploview: analysis and visu-alization of LD and haplotype maps. Bioinformatics 2005,