University of South Carolina
Scholar Commons
Theses and Dissertations
2017
Association of Gestational Weight Gain during
Twin Gestations and Adverse Maternal Outcomes
Kerry SpillaneUniversity of South Carolina
Follow this and additional works at:https://scholarcommons.sc.edu/etd Part of theEpidemiology Commons
This Open Access Thesis is brought to you by Scholar Commons. It has been accepted for inclusion in Theses and Dissertations by an authorized administrator of Scholar Commons. For more information, please [email protected].
Recommended Citation
ASSOCIATIONOFGESTATIONALWEIGHTGAINDURINGTWIN GESTATIONSANDADVERSEMATERNALOUTCOMES
by
Kerry Spillane
Bachelor of Arts
University of South Carolina, 2014
Submitted in Partial Fulfillment of the Requirements
For the Degree of Master of Science in Public Health in
Epidemiology
Norman J. Arnold School of Public Health
University of South Carolina
2017
Accepted by:
Nansi Boghossian, Director of Thesis
Andrew Ortaglia, Reader
Jihong Liu, Reader
ii
iii
ACKNOWLEDGEMENTS
I am indebted to several individuals for their constant encouragement, support, and
assistance with this thesis and my Master’s degree. I would like to begin by thanking my
wonderful fiancé, Mauk, for the most valuable and consistent love, patience, and
motivation. I love you. Thank you to my mom and Shannon, who may have not fully
understood what I have been working on for the last two years, but nevertheless provided
unwavering love, support, and faith in me. I am so lucky to have you all as my family!
I would also like to acknowledge the guidance and support of the individual members of
my thesis committee. I am especially grateful to Dr. Nansi Boghossian and Dr. Andrew
Ortaglia for their close involvement in this thesis, as well as the entirety of my graduate
school career. Thank you both for your continuous guidance and encouragement, and for
answering countless questions over the last two years.
And finally, I would like to acknowledge the eight other women in my cohort. I am very
lucky to have shared this experience (including all the stress, trials and tribulations) and
countless laughs with such intelligent, motivated, and strong women. I am honored to
iv
ABSTRACT
Objective: To examine the association between gestational weight gain (GWG) in twin gestations and the odds of adverse maternal outcomes.
SettingandParticipants: Study population included 3,081 women with a twin gestation delivered between 23-42 gestational weeks from 19 hospitals across the United States
(2002-2008) participating in the Consortium on Safe Labor (CSL) study.
MainOutcomes: Main outcomes of interest included: gestational hypertension, preeclampsia, gestational diabetes mellitus, and cesarean delivery.
Methods: Quantile regression estimated the 25th and 75th percentiles of total GWG, respective of pre-pregnancy BMI and gestational age at delivery, and was used to create
our new total GWG guidelines. Participants’ concordance with our GWG guidelines was
categorized as below, within, or above respective of total GWG, pre-pregnancy BMI, and
gestational age at delivery. Logistic regression was used to estimate adjusted odds ratios
and 95% confidence intervals assessing associations between concordance with our
GWG guidelines and adverse maternal outcomes of interest. All logistic regression
models were adjusted for maternal age, race/ethnicity, pre-pregnancy BMI, marital status,
smoking, alcohol, gestational age at delivery, hospital site number, insurance type, and
v
were excluded from analyses for gestational hypertension and preeclampsia, and
gestational diabetes mellitus, respectively.
Results: We found that after adjusting for confounders, GWG above our guidelines was associated with increased odds of gestational hypertension [OR: 2.04, 95% CI: 1.60,
2.61], and preeclampsia [OR: 1.63, 95% CI: 1.26, 2.10], while GWG below our
guidelines was associated with decreased odds of cesarean delivery [OR: 0.79, 95% CI:
0.64, 0.97]. In the adjusted models, a 5 kilogram increase in total GWG was associated
with increased odds of gestational hypertension [OR: 1.32, 95% CI: 1.23, 1.42],
preeclampsia [OR: 1.16, 95% CI: 1.01, 1.33] (when total GWG was < 19 kilograms), and
cesarean delivery [OR: 1.08, 95% CI: 1.01, 1.15]. Adjusted results for gestational
diabetes mellitus were not significant.
Conclusions: We found evidence of an increase in the odds of developing gestational hypertension, preeclampsia (when total GWG < 19 kilograms), and having a cesarean
delivery for every 5 kilogram increase in total GWG. Weight gain above our guidelines
was associated with increased odds of developing gestational hypertension and
preeclampsia, while weight gain below our guidelines was associated with decreased
odds of having a cesarean delivery. Further research is required to understand the
vi
TABLE OF CONTENTS
ACKNOWLEDGEMENTS ... iii
ABSTRACT ... iv
LIST OF TABLES ... viii
LIST OF FIGURES ...x
LIST OF ABBREVIATIONS ... xi
CHAPTER 1 INTRODUCTION ...1
1.1 BACKGROUND ...1
1.2 PURPOSE AND SPECIFIC AIMS ...3
1.3 ORGANIZATION OF THESIS ...4
CHAPTER 2 LITERATURE REVIEW ...6
2.1 SEARCH METHODS ...6
2.2 FINDINGS ...7
2.3 DISCUSSION ...10
2.4 MOVING FORWARD ...11
CHAPTER 3 METHODS ...18
3.1 STUDY POPULATION ...18
3.2 EXPOSURE OF INTEREST ...19
3.3 OUTCOMES OF INTEREST ...19
vii
3.5 ANALYSIS ...21
CHAPTER 4 RESULTS ...29
4.1 STUDY POPULATION ...29
4.2 GESTATIONAL HYPERTENSION ...30
4.3 PREECLAMPSIA ...31
4.4 GESTATIONAL DIABETES MELLITUS ...32
4.5 CESAREAN DELIVERY ...33
CHAPTER 5 DISCUSSION ...39
5.1 SUMMARY OF RESULTS ...39
5.2 GESTATIONAL HYPERTENSION ...39
5.3 PREECLAMPSIA ...40
5.4 GESTATIONAL DIABETES MELLITUS ...41
5.5 CESAREAN DELIVERY ...42
5.6 DIFFERENCES AND GAPS IN THE LITERATURE ...42
5.7 STRENGTHS AND LIMITATIONS ...44
5.8 FUTURE STUDIES ...45
5.9 CONCLUSIONS ...46
REFERENCES ...47
viii
LIST OF TABLES
Table 2.1 Epidemiologic Studies on the Association Between Gestational Weight Gain (GWG) in Twin Gestations and Adverse Maternal Outcomes ...14
Table 3.1 Classification of Outcomes of Interest...20
Table 3.2 Demographic Characteristics by Availability of Pre-Pregnancy BMI Status ....25
Table 4.1Demographic Characteristics Based on Concordance with the Quantile
Regression Total Gestational Weight Gain (GWG) Guidelines among Twin Gestations in the CSL Study (N=3,081) ...34
Table 4.2 Unadjusted Odds Ratios of Adverse Pregnancy Outcomes by Concordance with the Quantile Regression Total Gestational Weight Gain (GWG) Guidelines among Twin Gestations in the CSL Study ...36
Table 4.3 Adjusted Odds Ratios of Adverse Pregnancy Outcomes by Concordance with the Quantile Regression Total Gestational Weight Gain (GWG) Guidelines among Twin Gestations in the CSL Study ...36
Table 4.4 Unadjusted Odds Ratios of Total Gestational Weight Gain (GWG) and Adverse Pregnancy Outcomes among Twin Gestations in the CSL Study...37
Table 4.5 Adjusted Odds Ratios of Total Gestational Weight Gain (GWG) and Adverse Pregnancy Outcomes among Twin Gestations in the CSL Study...37
Table 4.6 Quantile Regression Total Gestational Weight Gain (GWG) Guidelines for Twin Gestations, Stratified by Pre-Pregnancy Body Mass Index (BMI) Category (in kilograms) ...38
Table A.1 Gestational Hypertension and Concordance with Quantile Regression
Gestational Weight Gain (GWG) Guidelines ...49
Table A.2 Preeclampsia and Concordance with Quantile Regression Gestational Weight Gain (GWG) Guidelines ...51
ix
Table A.4 Cesarean Delivery and Concordance with Quantile Regression Gestational
Weight Gain (GWG) Guidelines ...55
Table A.5 Cesarean Delivery and Total Gestational Weight Gain (GWG) ...57
Table A.6 Cesarean Delivery and Total Gestational Weight Gain (GWG) ...59
Table A.7 Cesarean Delivery and Total Gestational Weight Gain (GWG) ...61
Table A.8 Cesarean Delivery and Total Gestational Weight Gain (GWG) ...62
Table A.9 Association Between Gestational Hypertension and Total GWG and Concordance with GWG Guidelines among Twins in the CSL Study ...64
Table A.10 Association Between Preeclampsia and Total GWG and Concordance with GWG Guidelines among Twins in the CSL Study ...65
Table A.11 Association Between Gestational Diabetes Mellitus and Total GWG and Concordance with GWG Guidelines among Twins in the CSL Study ...66
x
LIST OF FIGURES
Figure 2.1 Flow Chart of Literature Review Search ...13
Figure 3.1 Directed Acyclic Graph (DAG) Minimally Adjusted Model ...24
Figure 3.2 Plotted Regressions for Gestational Hypertension ...27
Figure 3.3 Plotted Regressions for Preeclampsia ...27
Figure 3.4 Plotted Regressions for Gestational Diabetes Mellitus ...28
xi
LIST OF ABBREVIATIONS
A.OR ... Adjusted Odds Ratio
ART... Assisted Reproductive Technology
BMI ... Body Mass Index
CI... Confidence Interval
CSL ... Consortium on Safe Labor
DAG ... Direct Acyclic Graph
GDM ... Gestational Diabetes Mellitus
GWG ... Gestational Weight Gain
ICD-9 ... International Classification of Diseases, Ninth Edition
IOM ... Institute of Medicine
KG ... Kilograms
LBS ... Pounds
MULTI ... Multi-Racial
NICHD ... National Institute of Child Health and Human Development
NHW ... Non-Hispanic White
OR ... Odds Ratio
PI ...Pacific Islander
xii
SAS ... Statistical Analysis Software
SGA... Small-For-Gestational Age
US ... United States
1
CHAPTER
1
INTRODUCTION
1.1 BACKGROUND
Over the last three decades, there has been a substantial increase in twin birth
rates in the United States (U.S.)2. Twins account for an estimated 3.3% of all live births
in the U.S.7. The substantial increase in twin gestations has been attributed to the trend in
pregnancy delay, with multiples naturally occurring at greater rates among older women,
and the increased use of assisted reproductive technology (ART)2,12,14. Twin gestations
are commonly associated with higher rates of low birthweight, preterm delivery,
gestational diabetes mellitus (GDM), preeclampsia, cesarean delivery, and infant
mortality16. One in six neonatal deaths (defined as death within the first 28 days) is a
twin, and approximately 60% of all twin gestations are delivered preterm (defined as < 37
completed weeks of gestation)3,5.
As the rate of twin gestations continues to increase in the U.S., it is of supreme
importance to focus on reducing the risks of associated adverse maternal outcomes.
Weight gain during pregnancy has been associated with increased risks of GDM,
gestational hypertension, preeclampsia, cesarean delivery, and preterm delivery for both
singletons and twins3,13. The current epidemiological literature analyzing the association
2
largely focused on singletons. Twin gestations are considered too different from singleton
gestations to be included in the same analyses. The differences in gestational growth
patterns and the increased risks for preterm delivery, low birth weight, and
small-for-gestational age (SGA), are some of the most commonly noted differences between twin
and singleton gestations. Additionally, studies examining the impact of GWG in twin
gestations have been primarily focused on neonatal outcomes.
In 2009, the Institute of Medicine (IOM) issued the following provisional total
GWG guidelines for term (defined as 37-42 gestational weeks) twin gestations for three
pre-pregnancy body mass index (BMI) categories (using the World Health Organization
(WHO) definitions): 17-25 kilograms (kg) for normal-weight (18.50-24.9 kg/m2); 14-23
kg for overweight (25.0-29.9 kg/m2); 11-19 kg for obese (>30 kg/m2)9. There were no
provisional guidelines issued for women with an underweight pre-pregnancy BMI
(<18.50 kg/m2) due to insufficient evidence9. These guidelines reflect the interquartile
range (IQR), between the 25th and 75th percentiles, of cumulative GWG for women who
delivered twins between 37-42 gestational weeks, with an average twin birthweight of
2,500 grams or greater9,11. The IOM deemed these guidelines as provisional since they
are entirely based on weight gain percentiles in a specific population of twin gestations,
and because the guidelines committee did not conduct the same rigorous, extensive
analysis of associated outcomes for multiples as it did for singletons,11.
The IOM provisional GWG guidelines intend to optimize maternal and neonatal
outcomes associated with GWG. However, the guidelines for twin gestations are only
intended for term deliveries, and as such only apply to an estimated 40% of all twin
3
built-in correlation between gestational duration and total GWG. Women who deliver at
earlier gestational ages clearly do not have equal opportunities to gain weight compared
to women who deliver at later gestational ages. The most commonly utilized method for
adapting the provisional IOM guidelines for preterm deliveries is the average weekly rate
of GWG (computed as total GWG divided by gestational age at delivery). However, this
average weekly rate calculation assumes a linear increase in GWG throughout pregnancy,
and does not properly account for the differences in weight gain patterns by trimester. To
best examine the association between GWG and the risk of adverse maternal outcomes in
all twin gestations, the GWG guidelines must accurately account for the built-in
relationship between GWG and gestational age.
Given the increased prevalence of twins in the U.S., the general higher risk of
adverse outcomes in twins compared to singletons, and the different growth trajectories
for twins and singletons, it is necessary to: 1) determine optimal GWG guidelines for all
twin gestations and 2) focus research on the association between GWG in twin gestations
and adverse maternal outcomes.
1.2 PURPOSE AND SPECIFIC AIMS
The purpose of this thesis will be to examine the association between GWG and
adverse maternal outcomes (including gestational hypertension, preeclampsia, GDM, and
cesarean delivery) in twin gestations. Specifically, we aim to:
I. Examine GWG as a function of gestational age among twin gestations.
4
Hypothesis for Aim I: We hypothesize that GWG is not linearly associated with gestational age. A non-parametric function should be used to assess the
functional relationship between GWG and gestational age. As such quantile
regression should be used to create new GWG guidelines that account for the
relationship between GWG and gestational duration in twin gestations.
II. Examine the association between both total GWG and concordance with our
quantile regression GWG guidelines and the odds of gestational hypertension,
preeclampsia, GDM, and cesarean delivery in twin gestations.
Research Question: Are women with total GWG below or above our developed GWG guidelines at greater risk of developing adverse maternal outcomes of
interest compared to women with GWG within our guidelines? Do the odds of
adverse maternal outcomes of interest increase as total GWG increases?
Hypothesis for Aim II: Based on previous findings, we hypothesize that the odds of developing gestational hypertension, preeclampsia, GDM, and cesarean
delivery are higher for women who gain weight above our GWG guidelines
compared to women with weight gain within our guidelines, and that the odds of
adverse maternal outcomes increase as total GWG increases.
1.3 ORGANIZATION OF THESIS
Chapter I has provided sufficient background information on both the exposure
and population of interest, in addition to outlining the main research aims and objectives
5
the association of GWG and adverse maternal outcomes in twin gestations, and
demonstrate how this thesis will address the gaps in the current epidemiological
literature. Chapter III will explain in detail the methods of research and statistical
techniques used to analyze the data. The results of the analyses will be presented in
Chapter IV. Chapter V will provide a summary, thorough discussion of findings, and
6
CHAPTER 2
LITERATURE REVIEW
2.1 SEARCH METHODS
Studies evaluating the association between GWG and adverse maternal outcomes
in twin gestations were identified through PubMed. Advanced search criteria limited the
search results to studies published in the English language, performed on human subjects,
and with a full-text edition available. Keywords used to conduct the literature search
included: gestational weight gain, twins, multiples. After limiting the search to the above
criteria, 43 articles were identified in PubMed.
We reviewed all 43 articles (titles and abstracts) to identify studies focusing on
GWG in twin gestations and maternal outcomes. We screened 13 full articles to confirm
they were examining the association between GWG in twin gestations and maternal
outcomes. From there, seven studies were assessed for eligibility. To be deemed eligible,
studies had to focus on our association of interest using a specified measure of GWG as
one of the primary exposures of interest. The bibliographies of each eligible article were
then carefully reviewed to identify additional studies that were not present in the original
PubMed search results. An additional four articles were identified from the bibliographies
and then assessed for eligibility. After applying the above exclusion criteria, a final six
studies were included in the literature review. Please refer to Figure 2.1 for a flowchart of
7
2.2 FINDINGS
All six studies included in the literature review were retrospective cohort studies
5-7, 11, 12, 14. All studies used the 2009 IOM GWG guidelines for twin gestations to
categorize and assess GWG 5-7, 11, 12, 14. All subsequent references to “guidelines”
throughout Chapter 2 refer to the IOM 2009 provisional guidelines. Lal & Kominiarek
and Pettit et al measured GWG as the weekly rate of GWG 11, 14.Weekly rate of weight
gain was calculated as total GWG divided by gestational age at delivery (in weeks). They
then also divided the 2009 IOM guidelines by 37 to define optimal weekly guidelines,
and create the adequacy of adherence to GWG guidelines categories11, 14. Lucovnik et al
evaluated GWG as the total change in gestational BMI; calculated as pre-pregnancy BMI
subtracted from BMI at time of delivery12. Fox et al 2010, Fox et al 2011, and Gavard &
Artal all measured GWG as total GWG 5-7. Total GWG was calculated by subtracting the
participant’s recorded pre-pregnancy weight from the recorded weight at labor and
delivery admission. Five studies focused on GWG throughout the entire pregnancy
duration, while Pettit et al only focused on GWG between 20-28 gestational weeks14.
The most commonly controlled for variables included: maternal age, maternal
race/ethnicity, gestational age at delivery (weeks), smoking during pregnancy, alcohol
consumption during pregnancy, parity, pre-pregnancy BMI, chronic hypertension, and
chronic diabetes mellitus. Additional variables less commonly controlled for included:
use of ART, socioeconomic status, education level, and cervical length. All variables
controlled for in each study are listed in Table 2.1. The main findings for the six studies
8
study design, sample size, measure of GWG, method of comparison, control variables,
and main findings.
Gestational Hypertension
Four studies examined the association between GWG and gestational
hypertension in twin gestations5,6,11,14. Lal & Kominiarek found a statistically significant
positive trend between increasing GWG and gestational hypertension for women with an
underweight/normal-weight pre-pregnancy BMI (p=0.01), and for women with an obese
pre-pregnancy BMI (p<0.01)11. However, they did not find any significant differences in
the rates of gestational hypertension for women with an overweight pre-pregnancy BMI
as GWG increased (p=0.06)11. Fox et al 2010 did not find any significant associations
between adequacy of weight gain (comparing weight gain within and above the
recommend guidelines to weight gain below the guidelines) and gestational hypertension
across all pre-pregnancy BMI categories (normal-weight p=0.282; overweight p=0.410;
obese p=0.771)5. Fox et al 2011 also did not report any significant differences in the
likelihood of developing gestational hypertension as total GWG increased across the
three pre-pregnancy BMI groups in any of their analyses (p=0.943)6. Pettit et al did not
find any significant differences in the rates of gestational hypertension when comparing
women with adequate GWG (defined as within or below) to those with excessive GWG
(p=0.34)14.
Preeclampsia
Four of the studies examined the association between GWG and preeclampsia
9
as total GWG increased in any of their analyses (p=0.864)6. Gavard et al found a
significant positive trend between increasing GWG and the development of preeclampsia
(p<0.05)7. Women who gained greater than 42 pounds had 1.72 times the odds of
developing preeclampsia compared to women who gained 25-42 pounds, with borderline
statistical significance (a.OR 1.72, 95% CI 1.00-2.99, p=0.052)7. Gavard et al
additionally found a significant positive trend between increasing GWG and
preeclampsia in a sub-analysis for twin pairs with concordant birth weights (defined as
difference in birth weights < 20%)7. Lal & Kominiarek found a significant association
between increasing total GWG and the likelihood of developing preeclampsia across all
pre-pregnancy BMI categories (p<0.01)11. Pettit et al reported finding a significantly
higher rate of preeclampsia among women with adequate GWG at 20-28 gestational
weeks compared to women with inadequate GWG at 20-28 gestational weeks (p=0.01)14.
Gestational Diabetes
Five of the studies assessed the association between GWG and the risk of
GDM5,6,11,12,14. Pettit et al found a borderline statistically significant increase in the rate of
GDM for women with inadequate GWG at 20-28 gestational weeks compared to those
with adequate GWG (p=0.06)14. Fox et al 2011 did not find any significant differences in
the risk of GDM across all pre-pregnancy BMI categories (p=0.157)6. Lal & Kominiarek
found a positive trend between the development of GDM and increasing GWG for
women with an overweight pre-pregnancy BMI (p=0.04)11. They also found that women
with an obese pre-pregnancy BMI were more likely to develop GDM as total GWG
increased (p<0.01)11. However, they did not find any significant differences in the rates
10
GWG adequacy (p=0.2)11. Fox et al 2010 did not find any significant differences in the
rates of GDM for those with normal weight gain compared to those with low weight gain
across all pre-pregnancy BMI categories (normal-weight p=0.499; overweight p=0.739;
obese p=0.081)5. Lucovnik et al reported that women who developed GDM were more
likely to have higher pre-pregnancy BMIs (p<0.001)12. Overall, BMI change during
pregnancy was significantly less in twin gestations with GDM compared to those without
GDM (p<0.001)12. This finding is surprising, since it appears that women who gained
less weight during pregnancy were more likely to develop GDM. This unexpected change
may be explained by dietary counseling intervention after disease diagnosis12.
Cesarean Delivery
The association between GWG and cesarean delivery was only examined in two
studies. Gavard et al and Pettit et al examined the association between GWG and
cesarean delivery in twin gestations7, 14. Gavard et al found a borderline statistically
significant positive trend between increasing total GWG and having a cesarean delivery
(p=0.06)7. Significant positive trends between increasing GWG and cesarean delivery
were also found in a sub-analysis of twin pairs with concordant birthweights (p<0.05)7.
Pettit et al did not find any significant differences in the rates of cesarean deliveries
between women with adequate GWG compared to women with excessive GWG at 20-28
gestational weeks (p=0.34)14.
2.3 DISCUSSION
The current epidemiological literature analyzing the impact of GWG in twin
11
in twin gestations often exclude preterm deliveries since the IOM provisional GWG
guidelines are only intended for term deliveries. Additionally, in most studies, women
with an underweight BMI are commonly excluded or combined with the normal-weight
category due to the lack of specific 2009 IOM guidelines for women with an underweight
pre-pregnancy BMI. It is important to evenly represent and assess the associations of
interest for each pre-pregnancy BMI category to make accurate comparisons, and to
improve maternal outcomes for all twin gestations.
There are several strengths of the current research evaluating the association
between GWG in twin gestations and adverse maternal outcomes. The use of medical
records, birth certificates, and strong participation from large hospital networks has made
it feasible to identify twin gestations and include them in epidemiological research
studies. Large databases have also enabled the current research to obtain relatively
diverse sample populations, which greatly improved the generalizability of results.
2.4 MOVING FORWARD
To improve the epidemiological research on the association between GWG and
adverse maternal outcomes in twin gestations, researchers should aim to conduct larger,
prospective cohort studies. Prospective studies would enable researchers to obtain more
accurate measurements of pre-pregnancy BMI, weight gain throughout pregnancy, and
gestational age. Larger sample populations may also potentially improve the distribution
of participants across pre-pregnancy BMI categories and adequacy of adherence to GWG
12
The available current literature calls into question the 2009 IOM recommended
provisional GWG guidelines for twin gestations. It is evident from current findings that
further investigation is required to develop and define appropriate and optimal GWG
guidelines for all twin gestations. Due to the increased rates of preterm birth, low birth
weight, and SGA in twin gestations, it is imperative for GWG guidelines to properly
account for the pattern of weight gain in twin gestations. As such, additional research
13
Figure 2.1 Flow Chart of Literature Review Search
Final Inclusion 6
Identif
ica
tio
n
Scre
ened
E
lig
ibi
lit
y
Inclu
sio
n
PubMed 43
Full-Text Articles Screened 13
Assessed for Eligibility 7
14
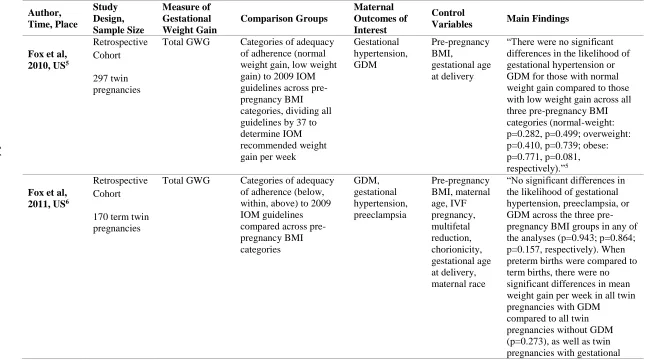
Table 2.1 Epidemiologic Studies on the Association Between Gestational Weight Gain (GWG) in Twin Gestations and Adverse Maternal Outcomes Author, Time, Place Study Design, Sample Size Measure of Gestational Weight Gain Comparison Groups Maternal Outcomes of Interest Control
Variables Main Findings
Fox et al, 2010, US5
Retrospective Cohort
297 twin pregnancies
Total GWG Categories of adequacy of adherence (normal weight gain, low weight gain) to 2009 IOM guidelines across pre-pregnancy BMI categories, dividing all guidelines by 37 to determine IOM recommended weight gain per week
Gestational hypertension, GDM Pre-pregnancy BMI, gestational age at delivery
“There were no significant differences in the likelihood of gestational hypertension or GDM for those with normal weight gain compared to those with low weight gain across all three pre-pregnancy BMI categories (normal-weight: p=0.282, p=0.499; overweight: p=0.410, p=0.739; obese: p=0.771, p=0.081, respectively).”5
Fox et al, 2011, US6
Retrospective Cohort
170 term twin pregnancies
Total GWG Categories of adequacy of adherence (below, within, above) to 2009 IOM guidelines compared across pre-pregnancy BMI categories GDM, gestational hypertension, preeclampsia Pre-pregnancy BMI, maternal age, IVF pregnancy, multifetal reduction, chorionicity, gestational age at delivery, maternal race
“No significant differences in the likelihood of gestational hypertension, preeclampsia, or GDM across the three pre-pregnancy BMI groups in any of the analyses (p=0.943; p=0.864; p=0.157, respectively). When preterm births were compared to term births, there were no significant differences in mean weight gain per week in all twin pregnancies with GDM
15
hypertension or preeclampsia to all twin pregnancies without hypertension or preeclampsia (p=0.315).” 6
Gavard & Artal, 2014, US7 Retrospective Cohort 405 twin pregnancies born to women with obese pre-pregnancy BMIs
Total GWG Three 2009 IOM
guidelines categories of GWG (< 25 lbs., 25-42 lbs., >42 lbs.) compared across three BMI classifications of obesity [class I (>30.0 - < 35.0 kg/m2), class II (>35.0 - <40.0 kg/m2), class III (>40.0 kg/m2)]. Also, looked at outcomes assessed by GWG categories per concordant and discordant birthweight pairs Preeclampsia, cesarean delivery Maternal age, race, education, pre-pregnancy BMI, socioeconomic status, smoking status, parity, chronic diabetes, chronic hypertension, gestational age at delivery
“A significant increasing trend with GWG was found for preeclampsia (p <0.05). An increasing trend with gestational weight gain for cesarean delivery was of borderline significant (p=0.06). Women who gained >42 pounds had a borderline significantly higher odds of preeclampsia than women who gained 25-42 pounds (a.OR 1.72, 95% CI 1.00-2.99). Analyses by obesity class showed that women who gained >42 pounds always had an elevated, although
nonsignificant, odds of preeclampsia than women who gained 25-42 pounds (data not shown). Significant increasing trends with GWG were found for preeclampsia (p<0.05) and cesarean delivery (p<0.05) in concordant twin pairs.” 7
Lal & Kominiarek, 2015, US11
Retrospective Cohort
2,654 twin pregnancies
Weekly rate of GWG (total GWG divided by gestational age in weeks at delivery)
Categories of adequacy of adherence (below, within, above) to 2009 IOM guidelines divided by 37 compared across pre-pregnancy BMI categories Gestational hypertension, GDM, preeclampsia Pre-pregnancy BMI, maternal age, parity, race, chronic hypertension
“For women with
16
women with an overweight pre-pregnancy BMI increased as GWG increased (p<0.01; p=0.04, respectively). There were no significant differences in the rates of GDM for women with underweight/normal-weight pre-pregnancy BMIs (p=0.2), or gestational
hypertension for women with an overweight pre-pregnancy BMI (p=0.6) in relation to GWG adequacy. Women with an obese pre-pregnancy BMI were statistically significantly more likely to develop preeclampsia, gestational hypertension, and GDM (all p<0.01) with increasing GWG.” 11
Lucovnik et al, 2014, Slovenia12 Retrospective Cohort 2,046 twin pregnancies delivered at >36 weeks, compared to 6,138 singletons Total Gestational BMI change (BMI at delivery – pre-gravid BMI)
Twins were compared to singletons (matched by parity and maternal age 3:1), as well as twin pregnancies with diagnosis of GDM compared to those with diagnosis of preeclampsia Preeclampsia, GDM Number of fetuses, maternal age, parity, diagnosis of gestational diabetes or preeclampsia
17
higher incidence of
preeclampsia with greater BMI change in twin pregnancies (p=0.07). Higher pre-pregnancy BMI was associated with a higher incidence of
preeclampsia and GDM in both twin and singleton pregnancies” 12
Pettit et al, 2015, US14
Retrospective Cohort
489 twin pregnancies
Weekly rate of GWG
Categories of adequacy of adherence (adequate, inadequate) to 2009 IOM guidelines divided by 37 across pre-pregnancy BMI categories Gestational hypertension, GDM, preeclampsia, cesarean delivery
History of prior preterm birth, short cervical length, chorionicity
“There was a borderline significant positive difference in the rates of GDM for women with inadequate GWG at 20-28 weeks compared to those with adequate GWG at 20-28 weeks (p=0.06). There were no significant differences in the rates of cesarean delivery and gestational hypertension between women with adequate and excessive GWG (p=.0.39; p=0.34, respectively). There was a significantly higher rate of preeclampsia or HEELP syndrome in women with adequate GWG at 20-28 weeks compared to women with inadequate GWG at 20-28 weeks (p=0.01)”14
*Abbreviations: p is the abbreviation for P-value; a.OR is the abbreviation for Adjusted Odds Ratio, 95% CI is the abbreviation for 95% Confidence Interval
18
CHAPTER 3
METHODS
3.1 STUDY POPULATION
The Eunice Kennedy Shriver National Institute of Child Health and Human
Development (NICHD) Consortium on Safe Labor (CSL) retrospective cohort study
collected data on 228,438 deliveries from 19 hospitals across the United States from
2002-2008. A more detailed description on the CSL study is provided elsewhere17, 18. The
CSL contains information on a total of 4,840 twin gestations. Information was obtained
from electronic medical records and supplemented with International Classification of
Diseases, 9th revision (ICD-9) codes in the patient discharge summary. Medical records
provided information on maternal demographics, reproductive history, medical history,
prenatal history of current pregnancy, labor admission assessment, labor progression,
labor and delivery summary, and maternal postpartum conditions. For this study, only
women with a twin gestation delivered between 23-42 gestational weeks with a known
pre-pregnancy BMI, pre-pregnancy weight, and weight at labor and delivery admission
were included (n=3,081). Observations with a gestational age greater than 42 weeks
(n=1), missing pre-pregnancy BMI (n=1,758), pre-pregnancy weight (n=1,544), or
weight at labor and delivery admission (n=118) were excluded from the analyses
(missing overlap: missing pre-pregnancy BMI and pre-pregnancy weight n=1,544;
missing pre-pregnancy BMI and labor admission weight n=658; missing pre-pregnancy
19
We compared the demographic characteristics and pregnancy complications for
observations with a pre-pregnancy BMI to observations missing pre-pregnancy BMI to
evaluate whether they were missing at random. After comparing the demographic
characteristics and pregnancy complications between the two groups, we did not detect
any differences. Table 3.2 provides the demographic characteristics for observations by
availability of pre-pregnancy BMI status.
3.2 EXPOSURE OF INTEREST
The exposure of interest is total GWG and was calculated as maternal
pre-pregnancy weight (in kg) subtracted from the recorded maternal weight at labor and
delivery admission. Total GWG was examined as both a continuous variable (total kg)
and as a categorical variable. For the categorical variable, each observation’stotal GWG
was categorized as below, within, or above our total GWG guidelines that we developed
using quantile regression, respective of pre-pregnancy BMI and gestational age at
delivery. From this point forward, all references to “guidelines” refer to our developed
total GWG guidelines, unless noted otherwise. A detailed description of the methods used
to create our guidelines will be discussed later in the chapter. Women with weight gain
within our guidelines served as the reference group for comparisons. The quantile
regression total GWG guidelines will be presented in Chapter 4.
3.3 OUTCOMES OF INTEREST
The examined maternal outcomes included: gestational hypertension,
preeclampsia (systolic BP (SBP) ≥140mm Hg, a diastolic BP (DBP) ≥90mm Hg
occurring after 20 weeks’ gestation among previously normotensive women without and
20
respectively)1, GDM (1-hour glucose challenge test > 140 mg/dl)8,9, and cesarean
delivery. Outcomes of interest were classified using the electronic medical records and
the supplemental ICD-9 codes. The ICD-9 codes and definitions of these outcomes are
listed in Table 3.1.
Table 3.1 Classification of Outcomes of Interest
Outcome ICD-9 Code
Source of
Data Defined Cesarean Delivery 669.7 ICD9 and
EMR
Cesarean delivery without mention of indication
Gestational Diabetes Mellitus
648.0 ICD9 and
EMR
Diabetes mellitus complicating pregnancy, childbirth, or the puerperia
Gestational Hypertension
642.3 ICD9 and
EMR
Transient hypertension of pregnancy
Preeclampsia 642.4 (mild) 642.5 (severe)
ICD9 and EMR
Mild or unspecified preeclampsia Severe preeclampsia
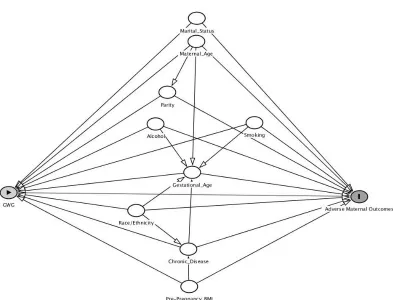
3.4 POTENTIAL CONFOUNDERS
Potential confounders of the association between GWG and the adverse maternal
outcomes of interest included: maternal age (continuous variable), race/ethnicity
(non-Hispanic white, non-(non-Hispanic black, (non-Hispanic, Asian/Pacific
Islander/Multi-Racial/other/unknown), pre-pregnancy BMI (categorized as underweight (<18.50
kg/m2), normal-weight (<24.99 kg/m2), overweight (25.0 – 29.99 kg/m2), and obese (>30
kg/m2), marital status (married, single/widowed/divorced, unknown), smoking (yes vs
no), alcohol consumption during pregnancy (yes vs no), gestational age at delivery
(continuous variable), hospital site number, insurance type (private, public,
self-pay/unknown/other), history of cesarean delivery (yes, no, unknown), and parity
21
analyses using theoretically-based models, based on the literature review and findings
from previous epidemiological studies. History of cesarean delivery was only controlled
for in the analyses of cesarean delivery. Please refer to the Direct Acyclic Graph (DAG)
Minimally Adjusted Model in Figure 3.1.
3.5 ANALYSIS
All analyses were limited to twin gestations delivered between 23-42 gestational
weeks with an available maternal pre-pregnancy BMI, pre-pregnancy weight, and weight
at admission to labor and delivery (n=3,081). For all analyses, GWG within our
guidelines, respective of pre-pregnancy BMI and gestational age at delivery, served as the
comparison group. For the analyses of gestational hypertension and preeclampsia, women
with chronic hypertension were excluded (n=70). For the analyses of GDM, women with
chronic diabetes mellitus were excluded (n=58).
For Study Aim I, we used a non-parametric regression to examine the distribution
of GWG as a function of gestational age for each pre-pregnancy BMI category. As
hypothesized, our results showed that the relationship between GWG and gestational age
is far from linear. After examining the non-parametric regression of the functional
relationship between GWG and gestational age, we placed a linear spline knot at 37
gestational weeks to provide the flexibility which allowed the slope coefficients to
change after 37 gestational weeks. The placement of the knot was based on the
distribution of the raw data, since the relationship between GWG and gestational age
evidently changed after 37 gestational weeks. Using the spline knot enabled us to more
22
We then used quantile regression, keeping a linear spline knot placed at 37
gestational weeks, to create new GWG guidelines for twin gestations that more
accurately reflect the functional relationship between GWG and gestational age. Quantile
regression was used to estimate the 25th and 75th percentiles of total GWG as a function
of gestational age for each pre-pregnancy BMI category. We created our total GWG
guidelines using the interquartile range (IQR), between the 25th and 75th percentiles, of
total GWG as the recommended range of total GWG for each gestational age at delivery,
respective of pre-pregnancy BMI. We then categorized each observation’s concordance
with our total GWG guidelines. Concordance was categorized as either below, within, or
above if total GWG was less than the 25th percentile, between the 25th and 75th
percentiles, or greater than the 75th percentile, respectively, respective of each
observation’s pre-pregnancy BMI and gestational age at delivery.
For Study Aim II, logistic regression was used to estimate the odds of adverse
maternal outcomes in association with increasing total GWG or concordance with our
total GWG guidelines. Estimates of the exposure-outcome relationships were obtained
after adjusting for all potential confounders using theoretically-based models, and are
presented as odds ratios (ORs) with their 95% confidence intervals (95% CIs). For the
analyses using continuous total GWG as the exposure of interest, we first ran
non-parametric regression models to examine the relationships between increasing total GWG
and the log odds of each maternal outcome and to assess the appropriateness of using
logistic regression. The non-parametric regression results suggested that it is appropriate
to model the relationships between total GWG and the log odds of gestational
23
relationship between total GWG and the log odds of preeclampsia was far from linear,
and a linear spline knot was needed to match the logistic regression to the non-parametric
regression. Based on the non-parametric regression results for preeclampsia, a linear
spline knot was placed at 19 kilograms to force the logistic regression model to better
reflect the non-parametric relationship. Please refer to Figure 3.2, Figure 3.3, Figure 3.4,
and Figure 3.5 for SAS generated graphs that simultaneously plot the non-parametric
regression, logistic regression, and modified logistic regression with linear spline knots
(when applicable) for each outcome of interest (pages 28-29). Results from SAS outputs
of logistic regression models using generalized linear models can be found in Appendix
A. Statistical significance was set at the 5% level. Statistical analyses were carried out
24
25
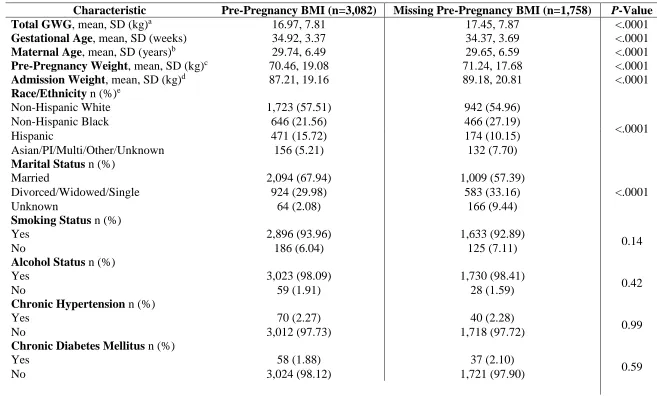
Table 3.2 Demographic Characteristics by Availability of Pre-Pregnancy BMI Status
Characteristic Pre-Pregnancy BMI (n=3,082) Missing Pre-Pregnancy BMI (n=1,758) P-Value
Total GWG, mean, SD (kg)a 16.97, 7.81 17.45, 7.87 <.0001
Gestational Age, mean, SD (weeks) 34.92, 3.37 34.37, 3.69 <.0001
Maternal Age, mean, SD (years)b 29.74, 6.49 29.65, 6.59 <.0001
Pre-Pregnancy Weight, mean, SD (kg)c 70.46, 19.08 71.24, 17.68 <.0001
Admission Weight, mean, SD (kg)d 87.21, 19.16 89.18, 20.81 <.0001
Race/Ethnicity n (%)e
Non-Hispanic White 1,723 (57.51) 942 (54.96)
<.0001
Non-Hispanic Black 646 (21.56) 466 (27.19)
Hispanic 471 (15.72) 174 (10.15)
Asian/PI/Multi/Other/Unknown 156 (5.21) 132 (7.70)
Marital Status n (%)
Married 2,094 (67.94) 1,009 (57.39)
<.0001
Divorced/Widowed/Single 924 (29.98) 583 (33.16)
Unknown 64 (2.08) 166 (9.44)
Smoking Status n (%)
Yes 2,896 (93.96) 1,633 (92.89)
0.14
No 186 (6.04) 125 (7.11)
Alcohol Status n (%)
Yes 3,023 (98.09) 1,730 (98.41)
0.42
No 59 (1.91) 28 (1.59)
Chronic Hypertension n (%)
Yes 70 (2.27) 40 (2.28)
0.99
No 3,012 (97.73) 1,718 (97.72)
Chronic Diabetes Mellitus n (%)
Yes 58 (1.88) 37 (2.10)
0.59
26
Parity n (%)f
Nulliparous 1,340 (43.48) 788 (44.85)
0.36
Multiparous 1,742 (56.52) 969 (55.15)
History of Cesarean Delivery n (%)
Yes 420 (13.63) 245 (13.94)
<.0001
No 2,564 (83.19) 1,382 (78.61)
Unknown 98 (3.18) 131 (7.45)
Insurance Type n (%)
Private 1,735 (56.29) 1,236 (70.31)
<.0001
Public 980 (31.80) 466 (26.51)
Self-Pay/Other/Unknown 367 (11.91) 56 (3.19)
Gestational Hypertension n (%)g
Yes 138 (4.58) 65 (3.78)
0.19
No 2,874 (95.42) 1,653 (96.22)
Preeclampsia n (%)g
Yes 171 (5.55) 111 (6.31)
0.27
No 2,911 (94.45) 1,647 (93.69)
Gestational Diabetes Mellitus n (%)h
Yes 207 (6.85) 150 (8.72)
0.02
No 2,817 (93.15) 1,571 (91.28)
Cesarean Delivery n (%)
Yes 2,063 (66.94) 1,178 (67.01)
0.96
No 1,019 (33.06) 580 (32.99)
All p-values obtained using chi square test.
a Pre-Pregnancy BMI category frequency missing n=104; Missing Pre-Pregnancy BMI category frequency missing n=1,558
b Missing Pre-Pregnancy BMI category frequency missing n=12
c Missing Pre-Pregnancy BMI category frequency missing n=1,544
d Pre-Pregnancy BMI category frequency missing n=104; Missing Pre-Pregnancy BMI category frequency missing n=658
e Pre-Pregnancy BMI category frequency missing n=86; Missing Pre-Pregnancy BMI category frequency missing n=44
f Missing Pre-Pregnancy BMI category frequency missing n=1
g Women with chronic hypertension (n=70) were excluded from the analyses of gestational hypertension and preeclampsia.
27
Figure 3.2 Plotted Regressions for Gestational Hypertension
28
Figure 3.4 Plotted Regressions for Gestational Diabetes Mellitus
29
CHAPTER 4
RESULTS
4.1 STUDY POPULATION
The average total GWG for the study population was 16.97 kg, with a minimum
and maximum value of -15.88 and 57.08 kg, respectively. Of the 3,081 women included
in our study, 52.52% (n=1,618) were within, 26.94% (n=830) were below, and 20.55%
(n=633) were above our GWG guidelines, respective of pre-pregnancy BMI and
gestational age at delivery. We did not observe any large differences in the percentages of
pre-pregnancy BMI categories between our concordance categories. Outcomes of interest
included gestational hypertension (n=138), preeclampsia (n=171), GDM (n=207), and
cesarean delivery (n=2,063). Table 4.1 provides demographic information for the study
population categorized by concordance with our GWG guidelines.
Compared to women with GWG within our guidelines, women with GWG below
our guidelines were significantly more likely to have an obese pre-pregnancy BMI (22.77
vs 18.97%, p<.0001), be non-Hispanic black (24.58 vs 17.0%, p<.0001), Hispanic (19.16
vs 15.08%, p<.0001), not married (35.18 vs 25.28%, p<.0001), smokers (7.83 vs 5.25%,
p=0.01), multiparous (63.37 vs 55.13%, p<.0001), and have public health insurance
30
Women with GWG above our guidelines were significantly less likely to be
Hispanic (10.74 vs 17.0%, p<.0001), but were significantly more likely to have an obese
pre-pregnancy BMI (25.75 vs 18.97%, p<.0001), be non-Hispanic black (26.38 vs 17.0%,
p<.0001), not married (35.23 vs 25.28%, p<.0001), nulliparous (48.82 vs 44.87%,
p<.0001), have chronic diabetes mellitus (2.84 vs 1.48%, p=0.03), and have public health
insurance (35.07 vs 27.50%), p=0.001) compared to women with GWG within our
guidelines.
Quantile regression was used to create GWG guidelines with the IQR serving as
the recommended range of total GWG, respective of pre-pregnancy BMI and gestational
age at delivery. Concordance between total GWG and our guidelines was categorized as
below, within, or above if total GWG was less than the 25th percentile, between the 25th
and 75th percentiles, or greater than the 75th percentile, respectively. The quantile
regression total GWG guidelines are presented in Table 4.6.
4.2 GESTATIONAL HYPERTENSION
The unadjusted and adjusted results for the association between concordance with
our guidelines and total GWG and the odds of gestational hypertension are presented in
Tables 4.2, 4.3, 4.4., and 4.5, respectively. In the crude model, weight gain below our
GWG guidelines was not significantly associated with gestational hypertension [OR:
0.76, 95% CI: 0.47, 1.23] (Table 4.2). Weight gain above our GWG guidelines was found
to be significantly associated with increased odds of gestational hypertension in the crude
model [OR: 2.20, 95% CI: 1.50, 3.24] (Table 4.2). After adjusting for maternal age,
pre-pregnancy BMI, race/ethnicity, marital status, smoking, alcohol, parity, insurance, and
31
with increased odds of gestational hypertension [OR: 2.04, 95% CI: 1.60, 2.61] (Table
4.3). In the adjusted model, GWG below our guidelines was not found to be significantly
associated with gestational hypertension [OR: 0.82, 95% CI: 0.61, 1.11] (Table 4.3).
In the crude model for total GWG, a 5 kilogram increase in total GWG was found
to be significantly associated with the odds of gestational hypertension [OR: 1.32, 95%
CI 1.23, 1.42] (Table 4.4) In the adjusted model, a 5 kilogram increase in total GWG was
again found to be significantly associated with gestational hypertension [OR: 1.31, 95%
CI 1.23, 1.40] (Table 4.5). The odds of developing gestational hypertension increased by
31% for each 5 kg increase in total GWG, after controlling for all covariates in the model.
4.3 PREECLAMPSIA
The unadjusted and adjusted results for the association between concordance with
our guidelines and total GWG and the odds of preeclampsia are presented in Tables 4.2,
4.3, 4.4., and 4.5, respectively. In the crude model, GWG below our guidelines was not
significantly associated with preeclampsia [OR: 0.90, 95% CI: 0.60, 1.34] (Table 4.2).
GWG above our guidelines was significantly associated with increased odds of
developing preeclampsia in the crude model [OR: 1.59, 95% CI: 1.10, 2.30] (Table 4.2).
After adjusting for potential confounders, weight gain above our GWG guidelines was
significantly associated with increased odds of preeclampsia [OR: 1.63, 95% CI: 1.26,
2.10] (Table 4.3). GWG below our guidelines remained statistically insignificant after
adjusting for potential confounders [OR: 0.95, 95% CI: 0.72, 1.25] (Table 4.4).
In the crude model for total GWG, a 5 kilogram increase in total GWG was not
significantly associated with increased odds of preeclampsia [OR: 1.04, 95% CI: 0.97,
32
the adjusted model for total GWG and preeclampsia to better match the logistic
regression to the non-parametric regression. The association between total GWG and
preeclampsia was significantly different when total GWG was less than 19 kilograms
compared to when total GWG was greater than 19 kilograms (p=0.0002). When total
GWG was less than 19 kilograms, a 5 kilogram increase in total GWG was found to be
borderline significantly associated with the odds of developing preeclampsia [OR: 1.16,
95% CI: 1.01, 1.33] (Table 4.5). When total GWG was greater than 19 kilograms, a 5
kilogram increase in total GWG was not significantly associated with preeclampsia [OR:
0.80, 95% CI: 0.62, 1.02] (Table 4.5).
4.4 GESTATIONAL DIABETES MELLITUS
The unadjusted and adjusted results for the association between concordance with
our guidelines and total GWG and the odds of GDM are presented in Tables 4.2, 4.3,
4.4., and 4.5, respectively. In the crude model, GWG below [OR: 1.10, 95% CI: 0.78,
1.54] or GWG above [OR: 0.92, 95% CI: 0.62, 1.36] our guidelines were not
significantly associated with GDM (Table 4.2). After adjustment, weight gain below
[OR: 1.15, 95% CI: 0.90, 1.47] or above [OR: 0.92, 95% CI: 0.69, 1.23] our GWG
guidelines remained insignificantly associated with the odds of GDM (Table 4.3).
In the crude model for total GWG, a 5 kilogram increase in total GWG was
significantly associated with decreased odds of GDM [OR: 0.91, 95% CI: 0.84, 0.98]
(Table 4.4). However, after adjustment, increasing total GWG was not significantly
33
4.5 CESAREAN DELIVERY
The unadjusted and adjusted results for the association between concordance with
our guidelines and total GWG and the odds of cesarean delivery are presented in Tables
4.2, 4.3, 4.4., and 4.5, respectively. In the crude model, GWG below our guidelines was
significantly associated with decreased odds of cesarean delivery [OR: 0.74, 95% CI:
0.62, 0.88] (Table 4.2). Weight gain above our guidelines was not significantly associated
with cesarean delivery in the crude model [OR: 1.19, 95% CI: 0.97, 1.45] (Table 4.2).
After adjustment, weight gain below our GWG guidelines was significantly associated
with decreased odds of cesarean delivery [OR: 0.79, 95% CI: 0.64, 0.97] (Table 4.3).
GWG above our guidelines remained insignificantly associated with the odds of cesarean
delivery in the adjusted model [OR: 1.16, 95% CI: 0.91, 1.46] (Table 4.3).
In the crude model for total GWG, increasing total GWG was not significantly
associated with cesarean delivery [OR: 1.06, 95% CI: 1.00, 1.12] (Table 4.4). After
adjustment, a 5 kilogram increase in total GWG was borderline significantly associated
with increased odds of cesarean delivery in the adjusted model [OR: 1.08, 95% CI: 1.01,
1.15] (Table 4.5). For each 5 kilogram increase in total GWG, the odds of having a
34
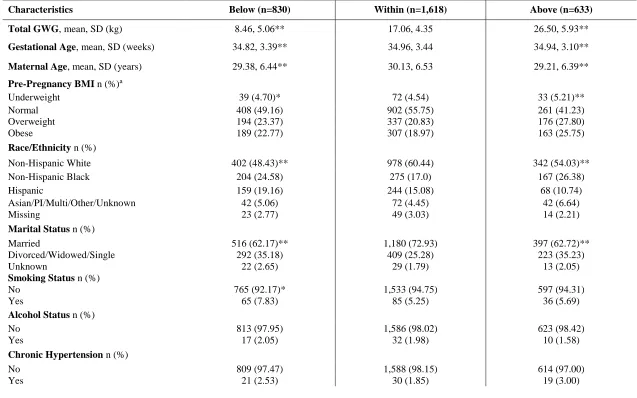
Table 4.1 Demographic Characteristics Based on Concordance with the Quantile Regression Total Gestational Weight Gain (GWG) Guidelines among Twin Gestations in the CSL Study (N=3,081)
Characteristics Below (n=830) Within (n=1,618) Above (n=633)
Total GWG,mean, SD (kg) 8.46, 5.06** 17.06, 4.35 26.50, 5.93**
Gestational Age, mean, SD (weeks) 34.82, 3.39** 34.96, 3.44 34.94, 3.10**
Maternal Age, mean, SD (years) 29.38, 6.44** 30.13, 6.53 29.21, 6.39**
Pre-Pregnancy BMI n (%)a
Underweight 39 (4.70)* 72 (4.54) 33 (5.21)**
Normal 408 (49.16) 902 (55.75) 261 (41.23)
Overweight 194 (23.37) 337 (20.83) 176 (27.80)
Obese 189 (22.77) 307 (18.97) 163 (25.75)
Race/Ethnicity n (%)
Non-Hispanic White 402 (48.43)** 978 (60.44) 342 (54.03)**
Non-Hispanic Black 204 (24.58) 275 (17.0) 167 (26.38)
Hispanic 159 (19.16) 244 (15.08) 68 (10.74)
Asian/PI/Multi/Other/Unknown 42 (5.06) 72 (4.45) 42 (6.64)
Missing 23 (2.77) 49 (3.03) 14 (2.21)
Marital Status n (%)
Married 516 (62.17)** 1,180 (72.93) 397 (62.72)**
Divorced/Widowed/Single 292 (35.18) 409 (25.28) 223 (35.23)
Unknown 22 (2.65) 29 (1.79) 13 (2.05)
Smoking Status n (%)
No 765 (92.17)* 1,533 (94.75) 597 (94.31)
Yes 65 (7.83) 85 (5.25) 36 (5.69)
Alcohol Status n (%)
No 813 (97.95) 1,586 (98.02) 623 (98.42)
Yes 17 (2.05) 32 (1.98) 10 (1.58)
Chronic Hypertension n (%)
No 809 (97.47) 1,588 (98.15) 614 (97.00)
35
Chronic Diabetes n (%)
No 814 (98.07) 1,594 (98.52) 615 (97.16)*
Yes 16 (1.93) 24 (1.48) 18 (2.84)
Parity n (%)
Nulliparous 304 (36.63)** 726 (44.87) 309 (48.82)
Multiparous 526 (63.37) 892 (55.13) 324 (51.18)
History of Cesarean Delivery n (%)
No 674 (81.20)* 1,363 (84.24) 526 (83.10)
Yes 115 (13.86) 212 (13.10) 93 (14.69)
Unknown 41 (4.94) 43 (2.66) 14 (2.21)
Insurance Type n (%)
Private 411 (49.52)** 974 (60.20) 349 (55.13)**
Public 313 (37.71) 445 (27.50) 222 (35.07)
Self-Pay/Other/Unknown 106 (12.77) 199 (12.30) 62 (9.79)
P-values were obtained using chi-square tests. Concordance categorized as “within” our recommended guidelines (n=1618) served as the reference group.
* Indicates P <.05 ** Indicates P <.0001
a Maternal pre-pregnancy BMI is categorized as underweight if BMI is <18.5 kg/m2, normal-weight if BMI is 18.5 to 24.9 kg/m2,
36
Table 4.2 Unadjusted Odds Ratios of Adverse Pregnancy Outcomes by Concordance with the Quantile Regression Total Gestational Weight Gain (GWG) Guidelines among Twin Gestations in the CSL Study
Outcome Below (n=830) Within (n=1,618) Above (n=633)
Gestational Hypertension a 0.76 (0.47, 1.23) 1.00 (ref.) 2.20 (1.50, 3.24)*
Preeclampsia a 0.90 (0.60, 1.34) 1.00 (ref.) 1.59 (1.10, 2.30)*
Gestational Diabetes Mellitus b 1.10 (0.78, 1.54) 1.00 (ref.) 0.92 (0.62, 1.36)
Cesarean Delivery 0.74 (0.62, 0.88)* 1.00 (ref.) 1.19 (0.97, 1.45)
All numbers are ORs with 95% CIs. ORs are obtained from logistic regression using generalized linear models. Concordance categorized as “within” our quantile regression GWG guidelines (n=1,618) served as the reference group.
*Indicates significant results.
a Women with chronic hypertension (n=70) were excluded from the analyses of gestational hypertension and preeclampsia.
b Women with chronic diabetes mellitus (n=58) were excluded from the analyses of GDM.
Table 4.3 Adjusted Odds Ratios of Adverse Pregnancy Outcomes by Concordance with the Quantile Regression Total Gestational Weight Gain (GWG) Guidelines among Twin Gestations in the CSL Study
Outcome Below (n=830) Within (n=1,618) Above (n=633)
Gestational Hypertension a 0.82 (0.61, 1.11) 1.00 (ref.) 2.04 (1.60, 2.61)*
Preeclampsia a 0.95 (0.72, 1.25) 1.00 (ref.) 1.63 (1.26, 2.10)*
Gestational Diabetes Mellitus b 1.15 (0.90, 1.47) 1.00 (ref.) 0.92 (0.69, 1.23)
Cesarean Delivery 0.79 (0.64, 0.97)* 1.00 (ref.) 1.16 (0.91, 1.46)
All numbers are ORs with 95% CIs. ORs are obtained from logistic regression using generalized linear models. All results are adjusted for maternal age, race/ethnicity, gestational age, pre-pregnancy BMI, smoking status, alcohol status, parity, insurance type, marital status, and hospital site number. Concordance categorized as ‘within” our quantile regression GWG guidelines (n=1,618) served as the reference group.
*Indicates significant results.
a Women with chronic hypertension (n=70) were excluded from the analyses of gestational hypertension and preeclampsia.
37
Table 4.4 Unadjusted Odds Ratios for a 5 Kilogram Increase in Total Gestational Weight Gain (GWG) and Adverse Pregnancy Outcomes among Twin Gestations in the CSL Study
Outcome Odds Ratio, (95% CI)
Gestational Hypertension a 1.32 (1.23, 1.42)*
Preeclampsia a 1.04 (0.97, 1.12)
Gestational Diabetes Mellitus b 0.91 (0.84, 0.98)*
Cesarean Delivery 1.06 (1.00, 1.12)
All numbers are ORs with 95% CIs. ORs are obtained from logistic regression using generalized linear models *Indicates significant results.
a Women with chronic hypertension (n=70) were excluded from the analyses of gestational hypertension and preeclampsia.
b Women with chronic diabetes mellitus (n=58) were excluded from the analyses of GDM.
Table 4.5 Unadjusted Odds Ratios for a 5 Kilogram Increase in Total Gestational Weight Gain (GWG) and Adverse Pregnancy Outcomes among Twin Gestations in the CSL Study
Outcome Odds Ratio (95% CI)
Gestational Hypertension a 1.31 (1.23, 1.40)*
Preeclampsia a
Total GWG < 19 kg 1.16 (1.01, 1.33)*
Total GWG > 19 kg 0.80 (0.62, 1.02)
Gestational Diabetes Mellitus b 0.96 (0.89, 1.03)
Cesarean Delivery 1.08 (1.01, 1.15)*
All numbers are ORs with 95% CIs. ORs are obtained from logistic regression using generalized linear models. All results are adjusted for maternal age, race/ethnicity, gestational age, pre-pregnancy BMI, smoking status, alcohol status, parity, insurance type, marital status, and hospital site number.
*Indicates significant results.
a Women with chronic hypertension (n=70) were excluded from the analyses of gestational hypertension and preeclampsia.
38
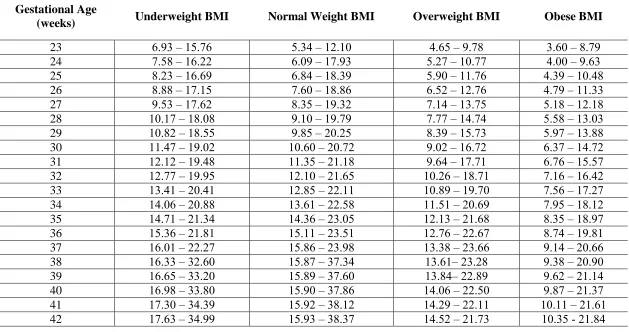
Table 4.6 Quantile Regression Total Gestational Weight Gain (GWG) Guidelines for Twin Gestations, Stratified by Pre-Pregnancy Body Mass Index (BMI) Category (in kilograms)
Gestational Age
(weeks) Underweight BMI Normal Weight BMI Overweight BMI Obese BMI
23 6.93 – 15.76 5.34 – 12.10 4.65 – 9.78 3.60 – 8.79
24 7.58 – 16.22 6.09 – 17.93 5.27 – 10.77 4.00 – 9.63
25 8.23 – 16.69 6.84 – 18.39 5.90 – 11.76 4.39 – 10.48
26 8.88 – 17.15 7.60 – 18.86 6.52 – 12.76 4.79 – 11.33
27 9.53 – 17.62 8.35 – 19.32 7.14 – 13.75 5.18 – 12.18
28 10.17 – 18.08 9.10 – 19.79 7.77 – 14.74 5.58 – 13.03
29 10.82 – 18.55 9.85 – 20.25 8.39 – 15.73 5.97 – 13.88
30 11.47 – 19.02 10.60 – 20.72 9.02 – 16.72 6.37 – 14.72
31 12.12 – 19.48 11.35 – 21.18 9.64 – 17.71 6.76 – 15.57
32 12.77 – 19.95 12.10 – 21.65 10.26 – 18.71 7.16 – 16.42
33 13.41 – 20.41 12.85 – 22.11 10.89 – 19.70 7.56 – 17.27
34 14.06 – 20.88 13.61 – 22.58 11.51 – 20.69 7.95 – 18.12
35 14.71 – 21.34 14.36 – 23.05 12.13 – 21.68 8.35 – 18.97
36 15.36 – 21.81 15.11 – 23.51 12.76 – 22.67 8.74 – 19.81
37 16.01 – 22.27 15.86 – 23.98 13.38 – 23.66 9.14 – 20.66
38 16.33 – 32.60 15.87 – 37.34 13.61– 23.28 9.38 – 20.90
39 16.65 – 33.20 15.89 – 37.60 13.84– 22.89 9.62 – 21.14
40 16.98 – 33.80 15.90 – 37.86 14.06 – 22.50 9.87 – 21.37
41 17.30 – 34.39 15.92 – 38.12 14.29 – 22.11 10.11 – 21.61
39
CHAPTER 5
DISCUSSION
5.1 SUMMARY OF RESULTS
In summary, we found that GWG below our guidelines was significantly
associated with decreased odds of having a cesarean delivery compared to GWG within
our guidelines. GWG above our guidelines was associated with increased odds of
developing gestational hypertension and preeclampsia compared to GWG within our
guidelines. We found a significant positive trend between increasing total GWG and the
odds of developing gestational hypertension, preeclampsia (when total GWG < 19
kilograms), and cesarean delivery. When total GWG was greater than 19 kilograms,
increasing GWG was insignificantly negatively associated with the odds of preeclampsia.
There were no significant associations with GDM.
5.2 GESTATIONAL HYPERTENSION
In the adjusted model, GWG above our GWG guidelines was found to be
significantly associated with an increase in the odds of developing gestational
hypertension. In the adjusted model for total GWG, increasing total GWG was also found
to be significantly associated with increased odds of gestational hypertension. While we
found significant associations for gestational hypertension for both GWG above our
guidelines and total GWG, most other studies have not found this to be true 5,6,11,14. Lal &
40
gestational hypertension which supports our findings11. Fox et al 2010 and Fox et al 2011
did not find any significant differences between adequacy of adherence to IOM GWG
guidelines and the odds of gestational hypertension 5,6. Gavard & Artal also did not find
any significant differences in the odds of gestational hypertension as total GWG
increased7. However, Gavard & Artal only assessed the association between GWG and
gestational hypertension in women with an obese pre-pregnancy BMI 7. The differences
between our findings and the findings from previous studies can be attributed to the
substantial variation in the study populations, sample sizes, GWG guidelines used,
measure of GWG, and differences in inclusion criteria. Fox et al 2010, Fox et al 2011,
and Gavard & Artal all used the 2009 IOM provisional guidelines5-7. Further, Fox et al
2010 used the common weekly rate of GWG, which unlike our guidelines does not
account for the built-in relationship between gestational duration and total GWG5.
5.3 PREECLAMPSIA
In the adjusted model, GWG above our guidelines and an increase in total GWG
(when total GWG was less than 19 kg) were both found to be significantly associated
with an increase in the odds of developing preeclampsia. When total GWG was greater
than 19 kilograms, the odds of preeclampsia insignificantly decreased as total GWG
increased. Studies within the literature support our findings of a positive trend between
increasing GWG and preeclampsia7,11. Gavard & Artal found a significant positive trend
between increasing GWG and the likelihood of developing preeclampsia7. Lal &
Kominiarek also found a significant increase in the rates of preeclampsia for women with
an underweight//normal-weight pre-pregnancy BMI whose GWG was above the IOM