Abstract— Process is a set of related actions and transactions to achieve a certain object. Process model is a process of designing and communicating the current or intended future state of a software process. It is used for viewing systems in multiple perspectives. To compare two process models we use a graphical notation called petri net. A petri net consist of two types of nodes called places and transition. Which are used to model behavior of systems in terms of flow. Comparison of process models can reveal number of process variations in a contemporary norms for process modeling. A process model is very important to develop quality projects. So we are introducing a tool based method for calculating efficiency of process models by using petri nets. This paper consists of methodology to compare two process models and we can find out efficiency of those process models.
Index Terms—. Petri nets, process models, transitions, tokens, performance, free choice net.
1. INTRODUTION
Process model define a separate set of activities, actions, tasks, milestones, and work products that are required high-quality software. It provides root map for software engineering process. Firstly, we find the information what is present in the process model and recall measures for two models - say model 1 and model 3 - and some typical behavior -say log - when these process models measures are compared to another model - say model 2 - with respect to log.
In other words, if the exactitude and remind values for (model 1, model 2, log) and (model 2, model 3, log) are known, what can be secondary about the values for (model 1, model 3, log)? Secondly, we reason if two pocess models are correspondent then they are behaviorally same with respect to a given typical behavior. Thirdly, this paper also discusses the accomplishment of the accuracy and remind measures in the context of genetic mining, where there is a need to evaluate models in an expected manner. Moreover,in this domain the hypothesis of having example activities in terms of event log sis very natural.
The remainder is organized as follows. Firstly, we describe the basic concepts of petri nets and those petri nets are defined by using a diagrammatic notation. In the design part comparison of process model can be represented by using UML notations like use case, sequence diagrams. In the implementation part we represent the modules for comparing
the process models. And those models are represented as two petri nets by using bidirectional graph.
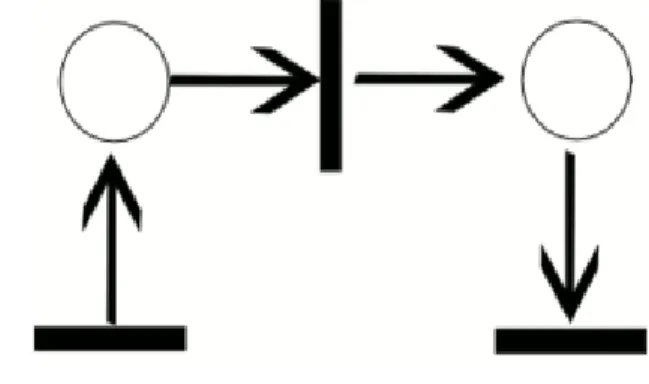
Fig 1:Petri net trajectory example
1.1. Petri net basics
A petri net is a collection of places and transitions and
arcs. Here , Arcs run from a place to a transition. Input places
consist of incoming arcs, the places to which arcs run from a transition are called the output places of the transition.
Graphically, places hold an isolated quantity of signs called tokens. Any allocation of tokens in excess of the places will represent a configuration of the net called a marking. In an abstract sense relating to a Petri net diagram, a transition of a Petri net may fire whenever there are sufficient tokens at the start of all input arcs; when it fires, it consume these tokens, and places tokens at the end of all output arcs. A firing is atomic, i.e., a single non-interruptible step.
Execution of Petri nets is nondeterministic: when multiple transitions are enabled at the same time, any one of them may fire. If a transition is enabled, it may fire, but it doesn't have to.
Since firing is nondeterministic, and multiple tokens may be present anywhere in the net , Petri nets are well suited for modeling the concurrent behavior of distributed systems.
2. DESIGNING
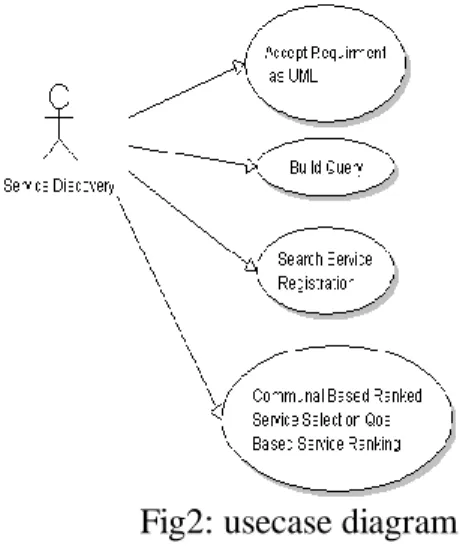
2.1.Use Case Diagram 1:
Here we are taking Service Discovery as an actor. By using Generalization relationship it is connected to several use cases. There are four use Cases like Accept Requirements as UML, Build Query, Search Service Registration and Communal based Ranked Service Section QOS based Service Ranking
PETRINET BASED PROCESS MODEL EVALUATION
CH.GURUNATHAM, B.PRATHIBHA, D.LAKSHMI HANISHA, G.LAVANYAFig2: usecase diagram1
2.2. Use Case Diagram 2:
Here we are considering ―Accept Requirements as UML‖ as an actor. It Collects input Constraints for Both Structural model and Behavioral model. By combining those two constraints it finds the Soft constraint.
Fig3:usecase diagram 2
2.3.Use Case Diagram 3:
Here Build Query is an actor. It Build Search Query based on Both Structural and Behavioral Constraints.
Fig4: usecase diagram3
2.4.Sequence Diagram :
Fig5: sequence diagram
3.IMPLEMENTATION:
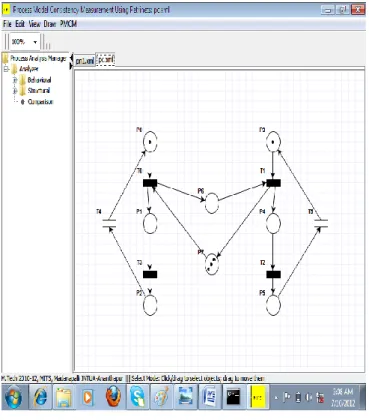
To implement our paper we need to take two different Process Models. These two process Models should be converted into Petrinets. These Petrinets must having Places and Transitions. We need to connect these places and transitions with Arcs.
Fig 5:Petrinet 1
The above Petrinet is 8 Places and 6 Transitions and having 4 Timed Transitions. Basically, it is a Process Model, By using EPC’s it is converted into a Petrinet. Tokens are present at p0, p3 and p7.These Places and Transitions are connected by arcs.
By using Structural analysis and Behavioral Profiles we are going to measure Process consistency. Behavioral Profiles consist of Model Status,General Stochastic Results and Relations. Structural analysis consist of Connection analysis and simulation. Final Phase Consists of Comparison Results.
3.1. Modules:
1. Model Status
By using this module we are going to know about Process model Status. It is used for checking whether the Petinet having the properties like State Machine, Marked Graph, Free Choice Net, Extended Free Choice Net and Simple Net.
2. General Stochastic Results
By using this module we are going know about the Marking values based on places and transitions. First we measure the marking based on places, after that we are using tangible transitions. Finally the marking values placed into to graph. We can calculate State Space Exploration time and Steady State Distribution Time. Total Time should be calculated by using those two calculated timed formats.
3. Relations
We are going to measure the relationships in the selected Petrinet. It should be covered by positive transition relations and positive Place relations. It automatically displays Place Transition relations. Finally we can get total analysis time.
4. Connection Analysis
In this module we are going measure Forward connection matrix, Backward Connection matrix, Bi-direction connection matrix and Inhibition matrix to evaluate process consistency. After that it should automatically displays marking values. It also displays enabled transitions.
5. Simulation
Simulation contains average number of tokens in the places and confidential intervals. These values are not negative. In this phase we may know the consistency of process models by using confidential intervals.
6. Comparison
Here we are comparing two process models by using their petrinet graphs.We are taking one more Petri net.
Fig6 :Petrinet 2
We are comparing Petriunet 1 and Petrinet 2 by using their Places, Transitions and Arcs.
4. Result analysis:
Here I have converted one process model into a petrinet . By using a graphical tool I have selected the below process model to know the status of each and every phase
Here the tool compares the process model by using the constraints like state machine, marked graph, free choice net, extended free choice net and simple net. After that we can see the results if any of those contraints match it shows true or else it became false
After that we can findout connection matrix for that process model by using marking methodology.
Here the net is converted to positive transition relations and positive place relations by this we get the result as bonded and constraint transitions.
Here we find the connections between processes and transitions by using connection analysis.
Here we get the average number of tokens and confidence intervals for above petrinets.
Here we get the another petrinets for comparing with previous one.
Here we get the results from the comparison of two petrinets.
5. CONCLUSION:
Finally in this paper we had compare two process models by using petrinets. It is a easy method to select predefined process model or own process models. It is low cost and high perforrmance method. We can implement this method in future by using UML diagrams, we are focusing on best process models to develop a project.
6.REFERENCES
[1] Matthias Weidlich, Jan Mendling,Mathias Weske ‖Efficient Consistency Measurement based on
Behavioral of Process Models ‖IEEE
Transactions.Software Engineering,2011.
[2] E. Yourdon, Modern Structured Analysis. Yourdon Press, 1989.
[3]J. Luftman, R. Papp, and T. Brier, ―Enablers and Inhibitors of Business-IT Alignment,‖ Comm. AIS, vol. 1, no. 3, 1999.
[4]E. Kindler, ―Model-Based Software Engineering and Process-Aware Information Systems,‖ Trans. Petri Nets and OtherModels of Concurrency, vol. 2, pp. 27-45, Springer-Verlag, 2009.
[5] M. Henkel, J. Zdravkovic, and P. Johannesson, ―Service-BasedProcesses: Design for Business and Technology,‖ Proc. Second Int’l Conf. Service Oriented Computing, M. Aiello, M. Aoyama,F. Curbera, and M.P. Papazoglou, eds., pp. 21-29, 2004.
[6] B. Andersson, M. Bergholtz, A. Edirisuriya, T. Ilayperuma, and P.Johannesson, ―A Declarative Foundation of Process Models,‖ Proc.17th Int’l Conf. Advanced Information Systems Eng., O. Pastor and J.F. e Cunha, eds., pp. 233-247, 2005.
[7] J. Koehler, R. Hauser, J.M. Ku¨ ster, K. Ryndina, J. Vanhatalo, and M. Wahler, ―The Role of Visual Modeling and Model Transformations in Business-Driven Development,‖ Electronic Notes inTheoretical Computer Science, vol. 211, pp. 5-15, 2008.
[8] OMG, Business Process Modeling Notation (BPMN) 1.2, Jan. 2009.
[9] A. Alves et al., ―Web Services Business Process Execution Language Version 2.0,‖ technical report, OASIS, Jan. 2007.
[10]V. Grover, K. Fiedler, and J. Teng, ―Exploring the Success of Information Technology Enabled Business Process Reengineering,‖ IEEE Trans. Eng. Management, vol. 41, no. 3, pp. 276-284, Aug.1994.
ABOUT AUTHORS:
CH.GURUNATHAM, M.TECH, Assistant professor, Department of computer science and engineering, Andhra engineering college, Atmakur, S.P.S.R.Nellore(dt), JNTUA, Andhra Pradesh, India.
B.PRATHIBHA, Student(final year),Department of
computer science and engineering, Andhra engineering college, Atmakur, S.P.S.R.Nellore(dt), JNTUA, Andhra Pradesh, India.
D.LAKSHMI HANISHA, Student(final year),Department
of Elecronics and communication engineering, Andhra engineering college, Atmakur, S.P.S.R.Nellore(dt), JNTUA, Andhra Pradesh, India.
Atmakur, S.P.S.R.Nellore(dt), JNTUA, Andhra Pradesh, India.