Effect of Knowledge Sharing and
Brokerage on the Sustainability of
Data Use
Tom Berendsen, S1797700
[email protected]
Master Thesis
November 2018
Key words: Data Team Intervention, Data Use, Sustainability, Knowledge Brokerage, Knowledge Sharing
Supervisors: dr. H.C. Prenger [email protected] dr. C.L. Poortman [email protected]
Table of content
... i
Summary ... iii
Foreword ... iv
1. Introduction ... 1
1.1. Rationale ... 1
2. Theoretical framework... 2
2.1. Data use ... 2
2.2. Data team intervention ... 3
2.3. Sustainability ... 5
2.4. Knowledge sharing and brokerage ... 7
2.4.1 Knowledge sharing ... 8
2.5 Research question and model ... 10
2.6 Scientific and practical relevance... 10
3. Method ... 11
3.1 Research design ... 11
3.2 Respondents ... 11
3.3 Instrumentation ... 12
3.3.1 Interview schemes ... 12
3.3.2 School Documents ... 14
3.3.3 Trainer’s Logs ... 15
3.4 Procedure ... 15
3.5 Data analysis ... 16
4. Results ... 17
4.1.1 School Board ... 18
4.1.2 Sustainability School A ... 19
4.2 Knowledge Sharing... 24
4.2.1 Knowledge sharing School Board ... 24
4.2.2 Knowledge Sharing School A ... 25
4.1.3 Knowledge Sharing School B ... 27
4.3.1 Knowledge Brokerage School Board ... 29
4.3.2 Knowledge Brokerage School A ... 30
4.1.3 Knowledge Brokerage School B ... 32
5. Conclusion and Discussion ... 34
5.1. Sustainability of data use ... 34
5.2. Knowledge Sharing... 36
5.3. Knowledge Brokerage ... 36
5.4. The relation between Knowledge Sharing and Brokerage, and with Sustainability ... 37
Relation Knowledge Sharing and Sustainability ... 37
Relation Knowledge Brokerage and Sustainability ... 37
5.5. Limitations and Recommendations ... 38
References List ... 40
Appendices ... 44
Appendix A. Interview scheme Schoolboard ... 44
Appendix B. Interview scheme school- and teamleader ... 45
Appendix C. Interview scheme Data team member ... 46
Appendix D. Interview scheme teacher ... 48
Appendix E. consent form ethics commission ... 50
Appendix F. Information letter Interview and Study ... 56
Appendix G. Informed consent form ... 57
Appendix H. form respondents information. ... 59
Summary
Data use plays an increasingly important role in decision making in education and can improve
educational results. The data team intervention is a professional development tool that uses an
eight-step iterative cycle to train educators in their skills and knowledge to use data in their
educational practice. To further improve and promote the data team intervention and data use in
education it is important to study what makes data use sustainable in secondary schools. Knowledge
sharing and brokerage are identified as key factors in influencing the sustainability of data use. There
is however, a lack of in-depth research on how knowledge sharing and brokerage influence
sustainability of data use. Therefore, this study attempts to find an answer on how knowledge
sharing and brokerage influence the sustainability of data use in secondary schools that participated
in the data team intervention. In terms of knowledge sharing, it is hypothesized that schools with
sustainable data use perceive more reciprocity, less centralization and effectively and inclusively
share knowledge within the data team. Furthermore, it is hypothesized that schools with sustainable
data use have more actively or effectively brokered knowledge on the educational problem and the
data team intervention.
This qualitative study is an instrumental multiple-case study, which compared the
perception of knowledge sharing and brokerage behavior between schools that have different
degrees of sustained data use. Semi-structured interviews were conducted with thirteen
respondents from two schools located in the eastern part of the Netherlands. The respondents were
selected out of five levels within the organizational structure of the school. The results present the
analysis of the interviews structured per construct and school.
It is concluded that a high degree of perceived reciprocity and a low centrality within the
data team, accompanied by knowledge sharing on both the data team intervention and the
educational problem related to the school with more clearly sustained data use. A higher degree of
centralization within the data team related to a lower degree of sustained data. Furthermore, it was
concluded more effective knowledge brokerage, mainly on the educational problem, to the involved
teacher team and management related to a higher degree of sustainability.
The findings will contribute to the sustainability of data use in education and the data team
Foreword
Writing my thesis has been a long, informative process during which I was able to focus on a topic
that interests me greatly, namely the improvement of education. I would like to thank my
supervisors dr. H.C. Prenger and dr. C.L. Poortman for their effort, support and constructive
feedback. I greatly appreciated their support and sincere interest. I would like to thank A.P.M.
Tappel for her effort, collaboration and support and wish her the best of luck in achieving her PhD.
In addition, I would like to thank dr. K. Schildkamp for her involvement and support at the start of
my thesis. Finally, I would like to thank my loving partner, family and friends who supported and
1. Introduction
1.1. Rationale
In today’s education, it is becoming more important for policy makers and educationalists to base decisions on data. Data use has been promoted globally in the last years and is often used to
account for actions and decision making (Datnow & Hubbard, 2015). Furthermore, data use has
been described as a key strategy to enhance improvement in education (Coburn & Turner, 2012;
Schildkamp & Poortman, 2015; McNaughton, Lai, & Hsiao, 2012). Data-based decision making, from
now on data use, can be defined as systematically gathering and using data that represents aspects
of the school to improve the quality of education (Lai & Schildkamp, 2013). Examples of data are
outcomes of teacher satisfaction questionnaires, learner outcomes, or findings from the
inspectorate. Data use has been found more effective than decision making without data
(Schildkamp & Poortman, 2015). And perhaps most important, data use in education can improve
student achievement (McNaughton, Lai, & Hsiao, 2012). In short, data use is an important factor for
improving education, guiding decision making, and a helpful tool in this era of accountability.
Decision making on policy and practice in Dutch secondary schools is often not based on
data, but rather on experience, anecdotal information, or intuition (Schildkamp & Kuiper, 2010). This
can be an ineffective and expensive way of adjusting policy, since unfounded reforms are often not
sustainable or do not produce the desired effects (Hargreaves, 2003). Lai and Schildkamp (2013)
found possible explanations for this lack of data use, such as scarcity of time, managerial pressure,
or lack of skills to properly use data. The inability of schools to base decisions on data, indicates that
there is still room for improving data use in Dutch education. This is emphasized by Coburn and
Turner (2012) by stating that, despite data use being a key strategy for the improvement of
educational results, little empirical research is available.
One possible intervention to support schools in their data use is the data team intervention
developed by Schildkamp, et al. (2015). This intervention has proven to increase knowledge and skill
for data use in education (Ebbeler, Poortman, Schildkamp, & Pieters, 2016) and help schools solve
educational problems (Poortman & Schildkamp, 2016). The intervention consists of an iterative,
systematic eight step program that trains data teams how to gather, interpret, and use data for
decision making and practice, with the goal of improving educational results.
To further promote and improve data use in education, it is necessary to investigate to what
extent data use is sustainable and which factors affect the sustainability. Sustainability is defined by
Fullan (2007) as the changes within schools that last. Sustainability is of importance because it is cost
need to find out what makes interventions sustainable is pointed out by Hargreaves (2003), by
stating that many reforms and professional development intervention fail to be sustained after
support is removed. This claim is supported by Coburn and Turner (2012) and Fullan (2007).
Sustainability of data use is influenced by many factors, of which one key factor is the way
how knowledge is shared within, and brokered by a team (e.g., Ebbeler, et al., 2016). There is a lack
of in-depth research on knowledge sharing and brokerage as influencing factors on sustainability
(Hubers, 2016). Furthermore, it is necessary to study data use on multiple levels in education, to
understand data use more deeply (Coburn, Touré, & Yamashita, 2009; Feldman & Tung, 2001; Honig
& Venkateswaran, 2012). Therefore, this study focusses on five levels within the school system,
namely: individual teacher level, teacher team level, team leader level, school management level
and schoolboard level. This research focusses on gaining in-depth insight on which aspects of
knowledge sharing and knowledge brokerage, in five levels of the organization, influence the
sustainability of data use in secondary schools, that participated in the data team intervention.
2. Theoretical framework
In this chapter the data team intervention, constructs and corresponding definitions are described.
The chapter is concluded with the main and sub research questions.
2.1. Data use
Data use is an interactive process that can improve educational results, helps with decision making
and is a helpful tool in the era of accountability. Coburn and Turner (2011) define the data use
process as that what happens when people interact with data. Data use is a complex process that
interacts with its surroundings and involves a high degree of interpretation from the users end,
because data on itself does not carry meaning (Coburn & Turner, 2012). The users need to notice
data, understand the data and its implications, and plan action based on the findings (Coburn &
Turner, 2012). Coburn and Turner (2011) state that data use is ‘fundamentally interactive, influenced
by characteristics of the individuals involved and the dynamics of the social interaction (p.175).’
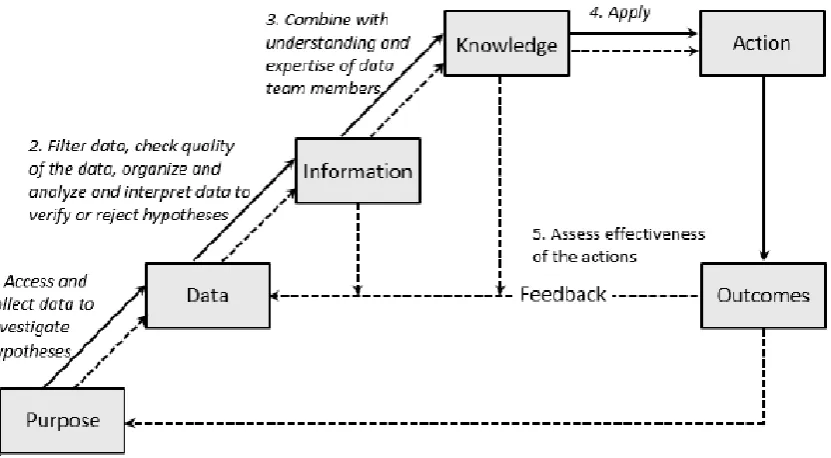
Figure 1 depicts an alteration of the data use theory of action developed by Schildkamp and
Poortman (2015). The data use theory of action represents the users’ activities during the process of
data use, which is the basis for the data team intervention. The first step of the data use theory of
action is the purpose. Subsequently users gather data and form hypotheses (step 1), filter, quality
check, organize, analyze, and interpret data, and confirm or discard the hypotheses (step 2). This
information is combined with the understanding and expertise of the data team members to form
knowledge (step 3), which will be transferred into action (step 4). During step two, three, and four,
insufficient) the users (partially) redo a step (step 5). The data use theory of action is an iterative
[image:8.595.79.495.134.363.2]cycle that starts with a purpose and leads to changes in educational practice.
Figure 1. Data Use Theory of Action (Derived from Schildkamp & Poortman, 2015, p.5.).
2.2. Data team intervention
The data team intervention educates colleagues on how to use data to solve problems the school
faces (e.g. low grades, high dropout rates). The data team creates knowledge and skills regarding the
use of data (Ebbeler, et al., 2016). The goal of the intervention is professional development, to
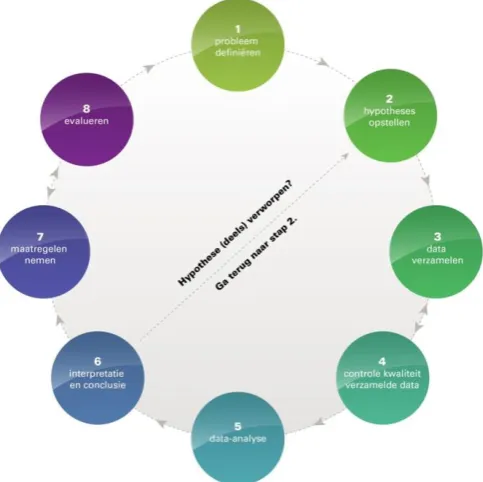
improve education and ultimately the learner results. The data team intervention is a model
designed as a systematic, iterative eight-step approach (see figure 2) for professional development
and educational improvement developed by Schildkamp, et al. (2015) based on Earl and Katz (2006)
and includes all steps of the data use theory of action (Schildkamp & Poortman, 2015) as explained
in the previous section. The data team intervention creates knowledge and skills for data use
(Ebbeler, et al., 2016). A data team is a team of six to eight people, consisting of one or two school
leaders (e.g. team or department head) and four to six colleagues.
Implementing the data team intervention in a school means that the data team is guided by
an external coach for two years and the school must meet certain prerequisites for the intervention
to be successful. Especially the two years of external guidance have proven to be crucial for success
(Schildkamp et al, 2015). The prerequisites consist of characteristics of the data (e.g. quality and
availability of data), the organization (e.g. able to facilitate and share leadership), individuals (e.g.
pedagogical and didactical knowledge), and the team (e.g. knowledge of the organizational
Figure 2: eight-step method of the data team intervention
The eight-step cycle (Schildkamp, et al., 2014) starts with the problem statement. During the first
step, the data team decides which of all the problems the school faces will be selected and the
desired situation will be formulated as a goal. This goal should be formulated in a specific and
measurable way.
Step two consists of formulating the hypotheses based on the problem statement. While
forming a hypothesis, the team should decide if they want to explore or clarify the problem. Where
an exploratory hypothesis tries to further establish the problem, a clarifying hypothesis aims to find
the cause. As well as the problem statement, the hypotheses should also be formulated specific and
measurable.
The third step, is the collection of data for the specific hypotheses that were formulated. The
teams can use numeral sources of data, divided into three groups; input (e.g. student
characteristics), process (e.g. pedagogics, or student/parent feedback) and output data (e.g. school
or exam results). In the data team intervention, it is encouraged that the team uses already gathered
data, since this is more time efficient. If the hypotheses cannot be examined with existing data, new
data must be gathered, preferably with already validated tools.
The fourth step is the quality check of the gathered data. The two most important factors for
the quality of the data are validity and reliability. Reliability concerns the extent to which the data is
free from chance. Validity concerns the accuracy of the measurements. Does the tool measure what
has been intended to be measured? If the quality of the data can be ensured, the team can move on
The fifth step entails the analysis of data and involves the preparation and organizing of the
data before interpretation. Data should be made insightful by visualizing and summarizing the
collected qualitative and/or quantitative data. For quantitative data, this can be done by, for
instance, the use of graphs. Qualitative data are more difficult to summarize, however organizing it
in tables and clustering data can make it easier to interpret.
The sixth step is forming a conclusion based on the interpretation of the gathered, verified,
and organized data. The data team should consider limitations of the data and include this while
interpreting the data and forming a conclusion. After forming a conclusion in step six, there are
multiple options to continue in the cycle. If the conclusion is that the hypothesis needs to be
rejected, the team should form a new hypothesis and continue the research. If the conclusion is that
the hypotheses can be accepted the team can take measures in solving the problem. A third option
is a combination of both, where measures can be taken to solve the problem partially and new
hypotheses can be formed to tackle the remaining part of the problem or newly arisen problems.
The seventh step is taking measures based on the with data established conclusion. Firstly,
the data team should gather possible improvement measures for solving the problem. The measure
most suitable to the problem statement and the conclusion should be chosen. Furthermore, the
measurement should address the cause of the problem. Based on the most suited measurement an
implementation plan, including timetable, possible pilot, and evaluation scheme, should be
constructed.
The last step in the cycle is the evaluation of the process and the effectiveness of the
measures. Depending on how specific the hypotheses were formulated, a concrete evaluation of the
effectiveness can be made. The evaluation should be made based on data, to prove the
effectiveness of the measurements and the process. This eight-step iterative process is a concrete
method to bring the data use theory of action in practice.
2.3. Sustainability
Since data use is an effective tool for educational improvement (Datnow & Hubbard, 2015; Coburn &
Turner, 2012; Lai & Schildkamp, 2013; Schildkamp & Poortman, 2015; McNaughton, Lai, & Hsiao,
2012; Stringfield, Reynolds, & Schaffer, 2012), it is highly preferable that data use will continue when
external support on the data team intervention is withdrawn (Hargreaves, 2003; Fullan, 2007;
Coburn & Turner, 2012). The intention of the data team intervention is to incorporate a sustained
practice of systematic data use for educational improvement within an organization or team.
Sustainability within education is defined in numeral ways. To form a more reliable
definition, an analysis of the literature regarding the sustainability of data use has been conducted,
share commonalities. These reoccurring factors are: sustainable data use takes place during regular
work without causing interruption, is an ongoing process and the intervention is visible through
routines within the organization. In which organizational routines are divided in the ostensive and
performative aspect (Feldman & Pentland, 2003). The ostensive aspect is defined as the perception
or structure of the routine, such as team or policy plans. The performative aspect is defined as the
specific actions that are undertaken that constitute the organizational routine. An example of the
performative aspect of routines is how data is used in the daily practice of teachers, such as using
test data to adjust the curriculum.
To summarize, when comparing the definitions of sustainability within organizational reform
and data use the following definition is formed: Sustainability is achieved when the intervention is
[image:11.595.69.517.372.646.2]evident through both ostensive and performative organizational routines, which are non-disruptive of ongoing work, with the goal of continuous improvement.
Table 1
Literature matrix definition sustainability
Author Definition Patterns in behavior During ongoing work
(without being disruptive)
Ongoing process (after removal of support) Coburn & Turner (2012) Routines for data use that are
recurrent and patterned interactions that guide engagement with data and people during their ongoing work.
Hagreaves & Fink (2008) Development of initiatives without compromising the development of others in the surrounding environment, now and in the future.
Fullan (2005) p. ix ‘The capacity of a system to
engage in the complexities of continuous improvement consistent with deep values of
human purpose’
Coburn, Russel, Kaufman, Stein, (2012)
The degree to which reform-related practices continue in high-quality ways after support for these practices has dissipated
Copland, 2003 Embedding reform work into the culture of the school
Sustainability of data use plays a role on multiple levels within schools through
organizational routines (Coburn, Touré, & Yamashita, 2009; Feldman & Tung, 2001; Honig &
Venkateswaran, 2012). This research distinguishes between five levels of the school organization
that will be examined. These are in ascending order of hierarchy, individual teacher, teacher team,
multitude of factors, of which knowledge dissemination, the current study’s topic, plays an
important role (Coburn, Touré, & Yamashita, 2009; Feldman & Tung, 2001). More recently and in
regard of the current intervention Ebbeler (2016) and Hubers (2016) state that the way the data
team members share their knowledge with other colleagues is a key challenge regarding the
sustainability of the data team intervention, and an important topic for future research.
This study makes a distinction between knowledge sharing and knowledge brokerage. Both
play a role in sustainable data use by building capacity within the data team but also within the
organization. Capacity building can be defined as being able, on all levels of the organization, to
sustain and act upon learning, with the collective goal of improving educational results (Stoll, 2010;
Stoll & Earl, 2003). Where knowledge sharing builds capacity within the data team by creating
knowledge and skills to use data, knowledge brokerage builds capacity by extending that know-how
to the rest of the school (Dobbins et al., 2009; Ward et al., 2009).
2.4. Knowledge sharing and brokerage
Knowledge sharing and knowledge brokerage are factors that can influence capacity building for
data use, which in turn affects the sustainability of the intervention. There is a commonality
between the types of knowledge that can be shared or brokered. The first type of knowledge is
knowledge on data use, in a general sense and specific for the current data team process (e.g. how
to form hypotheses). The second form is knowledge on the educational problem that the data team
is attending to (e.g. implications for educational practice). The distinction between knowledge
sharing and knowledge brokerage is of importance since both have different mechanisms and
characteristics. This distinction has also been made in former research regarding knowledge
dissemination behavior and the effectiveness of data use and the data team intervention (Hubers,
Poortman, Schildkamp, Pieters, & Handelzalts, 2016; Hubers, Moolenaar, Schildkamp, Daly,
Handelzalts, & Pieters, 2018).
There is still a lot unknown about how knowledge sharing and brokerage works, which contextual
factors are of influence, its effectiveness, how to evaluate the process and how it is of influence on
other aspects, such as sustainability (Conklin, Hallsworth, Hatziandrue, & Grant, 2008; Wang & Noe,
2010). Moreover, Conklin and others (2008) conclude that a large amount of the available evidence
base on knowledge brokerage is unreliable and inconclusive. Therefore, there is still a need for
research investigating how knowledge sharing and brokerage influence the sustainability of data
2.4.1 Knowledge sharing
Knowledge sharing can be defined as sharing of task information and skills, used to, form, implement
or cultivate ideas, processes or policies (Cummings, 2004). Knowledge sharing in the present study is
restricted to the sharing of knowledge within the boundaries of the data team. Knowledge sharing
within a team or organization is often measured and analyzed by the number of connections
between members. By doing so, knowledge sharing can be measured by three characteristics,
density, reciprocity, and centralization of the relationships within the network, which are likely to
represent the sharing of knowledge (Hubers, et al., 2018). A qualitative approach to research social
networks is growing in popularity and can provide benefits such as a more in-depth insight (Schepis,
2011). User perception of reciprocity and centralization can be approached with qualitative
measures, such as logfiles or interviews. Density represents the number of social ties within the
social network and can be measured by quantitative measures and not of interest for this study. The
current study defines knowledge sharing as: The process of sharing knowledge and skills within the
data team, in terms of reciprocity and centralization, with the goal of developing capacity for data use.
The present study will attempt to get a more in-depth view of the knowledge sharing
characteristics reciprocity and centralization and their effect on the sustainability of data use. By
using a qualitative approach more in-depth information on the sustainability of data use and its
influencing factors can be gained. Reciprocity reflects the strength of the connections within the
network. Reciprocity entails to which extent social ties are a joint and equal effort (Daly, 2012). For
instance, reciprocity in the data team intervention can be expressed by the mutual motivation of
team members to share knowledge regarding data use. Where a strong mutual tie to share
knowledge, and help colleagues is associated with a high degree of reciprocity. A team with a higher
degree of reciprocity is more likely to share knowledge over time (Keuning, Geel van, Visscher, Fox,
& Moolenaar, 2016). Centralization is the allocation of resources, i.e. knowledge and skills, within
the network (Hanneman & Riddle, 2005). For instance, centralization of knowledge in the data team
intervention can be expressed by the perception of equal contribution of team members during the
data team process. If one or two team members possess more knowledge and skills it is likely that
they will contribute more to the process during team meetings, this is associated with a higher
degree of centralization. In other words, the knowledge and skills regarding data use are centered
around key individuals. It is more likely that data team members will share knowledge if there is a
lower degree of centralization (Keuning, et al., 2016).
Knowledge brokerage is described in the literature in several ways, with different outcomes, broker
roles and types. Of importance is that knowledge brokerage can be viewed as a process to promote
data use for decision making (Ward, House, & Hamer, 2009; Dobbins et al., 2009; Magnuszewski, et
al, 2010). In the present study knowledge brokerage is regarded as the dissemination of knowledge
crossing the boundary of the data team. In other words, knowledge dissemination from within the
data team to the colleagues that do not participate in a data team and vice versa.
First, a distinction is made between the goals of knowledge brokerage. Knowledge
brokerage can function as a management system for knowledge, as a ‘link and exchange’ between
policy and research, and as a tool to build capacity (Ward, et al., 2009). The latter is of interest for
this study, knowledge brokerage can function as a bridge between evidence and practice, building
capacity for practitioners to base action on data, by making it more accessible and providing
knowledge and skill to use data (Dobbins et al., 2009; Ward et al., 2009).
Second, the distinction is made between three types of knowledge brokers; knowledge
broker as individual, group or organization (Currie, Star, White, & Watson, 2010). This research will
use knowledge brokerage as individual, where a person within the data team functions as the
intermediary between the data team and the other colleagues within the school. Subsequently, this
research defines knowledge brokerage as: the process and the activities of key individuals within the
data team that transfer and connect evidence to educational practice, in terms of inward, outward and forward brokerage, with the goal of building capacity within the organization for data use.
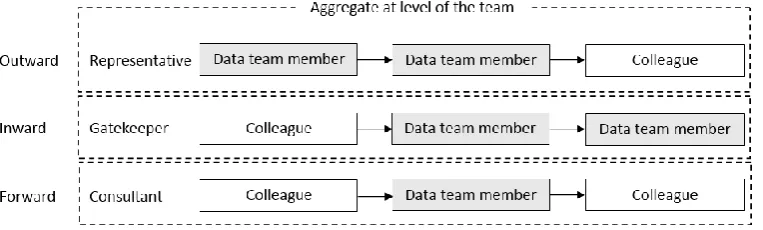
In this study and in data team intervention related research (Hubers, et al., 2018) three
broker roles are distinguished, namely outward, inward and forward brokerage (see figure 2). For
these three types of knowledge brokerage, the broker functions as a bridge between the data team
[image:14.595.73.455.535.650.2]and the colleagues, without contact between the colleagues, allowing the broker to fulfill his role.
Figure 2. Three types of knowledge brokerage in the data team intervention (Hubers, et al. 2018, p.6.)
To clarify the roles of figure 2. an example of each roll is given. During outward brokerage, the
students scores exceptionally high on a test and shares this with data team member 2. Data team
member 2, who assumes the role of broker, shares the findings with responsible colleague.
During inward brokerage, the broker assumes the role of gatekeeper. For instance, a colleague
shares their view on the educational problem the data team is addressing to a member of the data
team. That data team member assumes the role of broker when the input from the colleague is
shared with other data team members.
During forward brokerage, the broker assumes the role of consultant, transferring knowledge from
one colleague to another. For example, colleague 1 successfully adapts his teaching based on the use
of data, the broker shares the success and working method of colleague 1 with colleague 2.
2.5 Research question and model
Based on the theoretical framework (figure 2), this study attempts to find an answer on how
knowledge sharing and brokerage relate to the sustainability of data use. This leads to the following
research questions and sub questions:
Research question:
How do knowledge sharing and knowledge brokerage relate to the sustainability of data use in secondary schools that have worked with the data team intervention?
Sub questions:
a. How sustainable is data use in secondary schools that have worked with the data team intervention?
b. How is knowledge shared within the data teams in schools that have worked with the data team intervention?
c. How is knowledge brokered by the data team members in schools that have worked with the data team intervention?
2.6 Scientific and practical relevance
As discussed in the theoretical framework, there is still a need for research investigating how
knowledge sharing and brokerage are of influence on the sustainability of data use. This study aims
to give more in-depth knowledge on how knowledge sharing and brokerage influence sustainable
data use, thereby deepening the evidence base. In turn, this can lead to additional directions for
future research.
A more in-depth understanding on how knowledge sharing and brokerage influence
sustainable data use can lead to improvements to the data team intervention and perhaps other
knowledge sharing and brokerage practices are to sustain data use and thereby add to the data
team intervention and educational practice.
3. Method
This chapter describes the research design and methods used in the current study. Furthermore, the
selection process of respondents, the development of instrumentation, the gathering and analysis of
the data are reported.
3.1 Research design
To answer the main research questions and three sub questions, interviews were conducted on the
five determined levels in two secondary schools that used the data team intervention. The aim of
the cross-case study is to gain in-depth insight in how knowledge sharing and brokerage relate to the
sustainability of data use. The present study used semi-structured interviews to gather the data.
Semi-structured interviews have a fixed set of questions to structure the interview and promote
reliability through making the research repeatable, while allowing the interviewer with the
opportunity to gather more information through inquiry (Freebody, 2011). Semi-structured
interviews were the appropriate instrument, since these allow respondents to voice their own
opinion for more extensive information (Baarda, et al., 2015). Additionally, semi-structured
interviews offered the opportunity to compare the answers from respondents from different schools
to each other and to promote validity in terms of going into the questions that are relevant for the
research question.
Three interviewers related to the University of Twente conducted the interviews. This approach was
suitable because the study aimed to compare the knowledge sharing and brokerage between
schools that appeared to sustain data use after support was removed and schools that did not or to
a lesser extent sustain data use. Furthermore, these findings were triangulated with a document
study with documents of both schools such as policy plans and the school guide. In addition,
trainer’s logs from the data team intervention from both schools from the years 2013, 2014 and 2015 were used for the triangulation. Triangulation in social science is used to approach a topic
from different standpoints and support the reliability of the study’s findings (Bryman, 2016; Olsen,
2004).
3.2 Respondents
The researchers selected two schools that were presumed to have different rates of sustained data
use after the data team intervention. The schools were selected from all the schools in the eastern
the experiences the researchers had during previous data team related follow-up studies. This
resulted in two schools, where one school was expected to have sustained data use to a high extent
when support was removed and the other schools sustained data use to a lesser extent when
support was removed. This is deemed to be an appropriate approach, since this study aims to
compare the knowledge dissemination behavior on schools with different levels of data use
sustainability.
To get a more complete understanding on the sustained data use it was necessary to study
data use on multiple levels in education (Honig & Venkateswaran, 2012). The current study
distinguishes five levels within the organization, namely: schoolboard level, school leader level, team
leader level, data team member level and teacher level. From the schoolboard level one respondent
was selected to represent both schools. From the schoolboard level only one respondent was
selected because both schools were represented by the same schoolboard. One respondent was
selected on each school on the school leader level. On the team leader level one respondent was
chosen on both schools. On the data team level two colleagues on both schools were interviewed,
on school A the employee responsible for the quality of education joined the interview. Lastly, on
the teacher level, two colleagues on each school were selected that did not participate in the data
team intervention. In total there were thirteen respondents participating. These respondents were
selected, including the educational quality assurance manager (kwaliteitsmedewerker in Dutch),
because they are deemed to be a good representation of the five different layers within the
organization. On both the data team and teacher level multiple respondents were selected to enable
a more complete recollection of the data team intervention and the process.
3.3 Instrumentation
3.3.1 Interview schemes
The study made use of semi-structured interviews to gain in-depth view in the knowledge sharing
and brokerage behavior in the schools. The interview questions were based on the
operationalization of the constructs sustainability (see table 2), knowledge sharing (see table 3),
knowledge brokerage (see table 4) and existing interviews and questionnaires focused on data use
were consulted for example questions (Hubers, et al., 2018; Schildkamp, Poortman, Ebbeler, &
Luyten, 2017; Prenger & Schildkamp, 2018). The operationalization of constructs was based on the
method in Baarda, et al. (2015). Furthermore, the guidelines in Bryman (2016) on preparing an
interview guide were considered when constructing and conducting the interview. The interview
was written and conducted in Dutch because the study took place on two Dutch secondary schools.
different school. After the pilot study some adjustments in phrasing, formulation and the order of
questions were made to the interview. The interview schemes were differentiated for each level
within the organization to ensure the interviews fitted the respondents. This resulted in four
interview schemes (see appendix A, B, C, and D). The interview schemes are part of a larger
interview scheme used for a PhD study on sustainable data use. The interview schemes for this study
focused on knowledge sharing and knowledge brokerage. In addition to the prepared questions the
interviewer will attempt to gain more information by enquiry.
Table 2
Operationalization of Sustainability
Construct and definition Dimensions Indicators
Sustainability
Sustainability is achieved when the intervention is evident through both ostensive and performative organizational routines, which are adapted to the needs of the organization, while there is strive for the continuation of improvement.
1. Organizational routines
1.1. Ostensive 1.2. Performative
2. Data use adapted to the needs of the organization
2.1. Adapted to needs school
3. Continuation of improvement
3.1 Improvement of educational practice
[image:18.595.77.515.274.631.2]3.2. Improvement of data use
Table 3
Operationalization of Knowledge Sharing
Construct and definition Dimensions Indicators
Knowledge Sharing The process of sharing
knowledge and skills within the data team, in terms of
reciprocity and centralization, with the goal of developing capacity for data use.
2. Centralization 2.1. Equal contribution
3. Knowledge sharing
3.1. Knowledge sharing regarding data use.
[image:19.595.74.524.303.676.2]3.2. Knowledge sharing regarding educational problem.
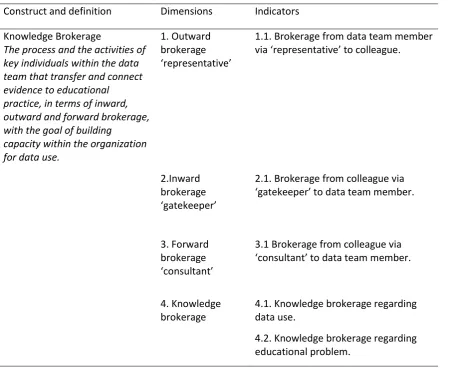
Table 4
Operationalization of Knowledge Brokerage
Construct and definition Dimensions Indicators
Knowledge Brokerage
The process and the activities of key individuals within the data team that transfer and connect evidence to educational practice, in terms of inward, outward and forward brokerage, with the goal of building
capacity within the organization for data use.
1. Outward brokerage ‘representative’
1.1. Brokerage from data team member via ‘representative’ to colleague.
2.Inward brokerage ‘gatekeeper’
2.1. Brokerage from colleague via ‘gatekeeper’ to data team member.
3. Forward brokerage ‘consultant’
3.1 Brokerage from colleague via ‘consultant’ to data team member.
4. Knowledge brokerage
4.1. Knowledge brokerage regarding data use.
4.2. Knowledge brokerage regarding educational problem.
3.3.2 School Documents
In addition to the interview fragments, school documents and trainer’s logs of the support sessions
year policy plan (meerjarenbeleidsplan in Dutch) and a school guide 2017-2018 (schoolgids in Dutch)
for both locations. Additionally, the strategic policy plan of the organization describes the goals of
the umbrella organization that both schools are a part of. These documents are fitting for
triangulation because documentation of data use is determined as the indicator ‘ostensive’ in the
construct ‘sustainability. The school guide is the document the schools distribute to parents and pupils to present information about the school’s policies, vocal points, goals and regulations. In the
multiple year policy plan the policies and goals for the upcoming years for the specific school are
described. And lastly, in the strategic policy plan of the organization the vocal points, direction for
the future and goals for the umbrella organization are described.
3.3.3 Trainer’s Logs
The third source of data for the triangulation were trainer’s logs from the training sessions the
original data team members had when they started with the first data teams. The trainer’s logs were written by the instructors of the data team intervention affiliated with the University of Twente. The
logs of School A span the period of 09/22/2014 till 06/29/2015. The logs of School B span the period
of 09/04/2013 till 06/11/2015. The logs describe the following: ‘school/organization’, ‘Data and data
systems’, ‘Skills data use team members’, ‘how did the team perform during the current step of the
data team cycle’, ‘Which interventions from the trainer helped the team’, ‘What stood out in the interaction within the team’, and ‘Suggestions for improvement and additions’. The trainer’s logs were analyzed based on the coding scheme (see appendix I). The trainer’s logs were used to reach a more reliable conclusion on all three constructs, because these were included in the observations of
the trainer.
3.4 Procedure
Preceding the gathering of data, the ethics commission of the University of Twente was asked for
approval for this study (see appendix E). All respondents were informed on the purpose of the
interview and the study with a briefing preceding the interview and a letter (see appendix F). In
addition, the respondents were asked for consent (see appendix G), before conducting and
recording the semi-structured interviews. Respondents were asked for their function in the school
and their role in the data team intervention (see appendix H) prior to the interview, providing an
approach for categorizing the interviews by the corresponding levels within the organization. All
documents (appendix E, F, G, and H) were written in Dutch.
The interviews were conducted at the locations of the schools, during or after school hours.
The interviews had a maximum duration of 45 minutes and were voice recorded. The setting of the
two interviewer(s) and one, two or three respondent(s) present during the interviews. The three
interviewers were all affiliated with the University of Twente. One of the interviewers was also
affiliated with school B. To avoid interviewer bias that interview did not conduct any of the
interviews at school B. In addition, the interviewers tried to maintain a neutral role during the
interviews to negate the asymmetrical power relationship between interviewer and interviewee
(Kvale, 2002). Abdicating the roll of knowledgeable researcher and trying to act as an attentive
observer. Furthermore, the interviewee had the opportunity to ask questions about the interview
and the research, was thanked for their participation, and offered the possibility for further contact
and to receive the final report of the study.
Lastly, the interview with the school leader of school A was not used for this research. The audio file
was not useable for processing due to technical issues.
3.5 Data analysis
Data analysis of the qualitative data was carried out using the qualitative analyses tool Atlas.ti. The
audio recordings of the interviews first were transcribed, exactly and entirely. The transcripts then
were coded based on a coding scheme (see appendix I) and structured accordingly.
The coding scheme was based on the operationalization of the constructs Sustainability, Knowledge
Brokerage, and Knowledge Sharing. It was decided to add the construct ‘forms of continuation of the data team intervention’ to be able to capture the current form of the data team intervention. The
decision to add this construct was based on the perceived need to separate the data that loaded on
the dimension data use adapted to needs of the organization in more specific categories. This
resulted in a coding scheme (See appendix I) where examples of phrases were added to each
indicator and code of the three constructs. The coding scheme was used to code the transcripts in
the program Atlas.ti. To be more confident in the reliability of the coding scheme and the findings,
the interrater reliability was calculated with the assistance of a second coder. The interrater
reliability measures the amount of the consensus between coders is based on chance. Hodson
(1999) advises to use ten percent of the total data for measuring the interrater reliability. For this
measurement ten percent of the total fragments were selected for the second coder to re-code. To
ensure a good representation of all data, fragments were randomly selected out of all the
documents in proportion to the number of fragments of each indicator. For instance, the code A.3.1
‘improvement education’ was used 61 times, so six fragments A.3.1. were randomly selected from the different documents.
However, during coding it was found that the construct ‘forms of continuation of the data
variance in the reliability check of the coding. Thus, after consultation with the second coder and a
following appointment with the supervisors the consensus was reached to delete construct ‘forms of
continuation of the data team intervention’. Additionally, some small changes were made in the formulation of examples to make them clearer and fitting to the transcripts. This resulted in a Kappa
score of 0.79, which can be considered substantial Cohen (1960). Differences were discussed with
the second coder, after which consensus on the coding scheme was reached.
4. Results
The results of the interviews, document study and trainer’s logs are structured by school and per
constructs sustainability, knowledge sharing and knowledge brokerage and presented in a
summarized manner.
Data teams school A and B
The data team of school A consisted of six members. The members are one team leader, one
educational quality assurance manager and four colleagues that teach the first-year groups of
secondary education. The data team stayed in this configuration for the duration of the intervention.
The goal of the data team was improving educational results in the first-year groups. More
specifically, the results of the core subjects’ courses like mathematics and the Dutch language.
The team started with eight members, consisting of a team leader, educational quality assurance
manager and six colleagues from the two sectors HAVO and VMBO-GT. Due to illness in the team
and the school several adjustments to the team have been made. The team ended with seven of the
original eight members. The goal of the data team was to increase the percentage of students that
follow educational track HAVO after two years of the educational track HAVO-GT. For clarity, the
term data team members refers to the educators that participated in the data team intervention, in
practice the data team members also function as teachers at the schools.
4.1 Sustainability
The ostensive and performative routines are the leading headers in the results of sustainability. The
constructs intervention adapted to needs school, improvement education, and improvement data
use, have some overlap with the performative aspect. For instance, how the data team intervention
is currently present in the school can be considered an adaptation to the needs of the school in
addition to the performative aspect of a routine. These results are presented under the more
4.1.1 School Board
Ostensive
The member of the school board stated that data use for improvement of educational quality is
included in the strategic policy plan of the organization. Confirming this, in the strategic policy plan it
was specifically stated that the organization uses data teams to systematically evaluate, improve and
innovate their education. Furthermore, content related feedback on the process is needed for the
organization to progress in a more general sense; the document stated for instance that: ‘We
systematically evaluate our educational results and improve our education continuously with the goal of increasing the educational results of each student.’
The organization continues to develop their educational quality assurance system, which informs
them on the quality of education and organization and that enables continuous and adequate
evaluation. In addition, the document stated that employees can reliably improve and innovate,
implying that employees have some knowledge and skills in data use.
Performative
The member of the school board stated that they give account on the educational quality. They do
that with an educational quality assurance system for the entire school system. At least once a year
the management concluded the management conversation cycle based on data of all school
generated by a central point. They made sure this is a validated data package and is the basis for
evaluation with all the highest involved stakeholders. In addition to this meeting other conversations
based on data occur, for instance with the inspectorate of education.
Intervention adapted to needs school
The board member made no mention of the intervention adapting to the needs of the schools.
Improvement education
The board member stated that he thinks that data use for educational improvement is becoming
more regular during daily practice on schools, but at this moment is underdeveloped and
overlooked. Confirming the claim that data use for educational improvement is increasing in daily
practice, the logs of both schools extensively mentioned that the goal of the data teams was to
improve educational performance.
Improvement data use
courses were a necessity. The school board member did not suspect that the starting data team
members hardly possessed the knowledge needed for data use and research. Methodology,
statistics and the data team intervention methodology were the focus of these courses and were
tested. Furthermore, he stated that he thinks that people learned a lot from the data team
intervention. In particularly, validated data use for improving educational quality and school
practice.
4.1.2 Sustainability School A
Ostensive
Data team members stated that data use is not included in the course curriculum (vakleerplan in
Dutch) and their domain’s team strategy document (teamleerplan in Dutch). Contradicting, both the
teachers stated that data use is mentioned in the course and the team strategy document. The team
leader, whom was also a member of the data team supported this with the statement: ‘Working with data does get mentioned in the sense of, it comes back in a team’s and location’s strategy document.’ The multiple year policy plan stated that school leaders carry out domain meetings via a fixed format at least one time a year, which include data such as satisfaction studies and exam
results.
Both documents, strategic policy plan of the organization, the multiple year policy plan
stated that multiple sources of data are used to improve education. For instance: ‘Evidently, the educational goals, personalized BYOD-education, examination and RTTI, the pedagogical- and didactical approach, satisfaction studies, and the exam results are conversational topics.’ The school guide only mentions educational improvement as a goal.
The multiple year policy plan stated that the school likes to continue to focus on teacher’s
competences and shift towards a more personalized educational program. Furthermore, it stated
that colleagues learn from and with each other. Additionally, they would like to continue improving
competences of all colleagues. For instance, they stimulate learning from each other by appointing
expert-colleagues to share their expertise.
Performative
The teachers stated that data use certainly is a returning topic in team and section meetings. The
team leader said that the topic data use returns once or twice per year in team meetings. In a
section meeting it was a topic of interest in addition to the discussing of the results of the school.
Furthermore, she stated that data use was a main topic in school board meetings during the start of
Intervention adapted to needs school
The team leader stated that the data team intervention was not directly used in the school.
However, she confirmed that the educational quality assurance manager and her still monitor the
implemented measures and that in a broader sense the data team intervention was still part of the
school. She mentioned that if it is needed that she would use the intervention again. She mentioned
that she finds all eight steps equally important and help to focus, but in future use might dwell
longer on certain steps.
The data team members stated that there is no data team active on a problem, but there are
still data team members that monitor the progress of the implemented measures, which does not
happen in the spirit of the eight steps of the intervention. Additionally, one member, the educational
quality assurance manager stated that if she gets called in for help with a problem, she keeps the
intervention in the back of her mind and tries to base the meetings on data. Furthermore, she has
not seen colleagues using the data team intervention, nor linking the data team intervention to
practice. In the interview with the teachers no mention of adaptation to the needs of the school was
made.
Improvement education
The educational quality assurance manager stated that every year and every quartile exam and
educational results are analyzed, and a prognosis is made, which all are input for improving
education. The teachers stated that data use, such as test exams and observations, are important for
the education they give. They specifically mentioned RTTI as a tool they use for the improvement of
education, which is stimulated by the board and school leaders. They use this data to personalize
education for pupils and decision making for the educational paths of pupils. They thought that the
data team intervention could have led to a better ability to differentiate in education.
The team leader stated that data is used quite a lot, for example exam results, grades of
multiple years, and data on pupils when starting, finishing and switching educational tracks. She
explicitly stated: ‘We work on a structural basis with data to ensure the quality of our education. Not
as a means of a penalization culture, but for the improvement of education.’ The data team intervention helped them to direct efforts to improve education to their organization instead of
looking for the cause or a solution outside. She thought the board stimulates and facilitates data use
for educational improvement and points out that what can be of importance for the quality of
education. Furthermore, she stated that team meetings are centered around improving education in
both a concrete and theoretical manner. A data team member stated that not a lot of data is used as
the exam and test results are used during team and section meetings and IPB-meetings.
In the trainer’s logs of school A there was extensively mentioned that the goal of data team was to improve educational performance, more specifically how to improve the somewhat disappointing
yields of the lower classes (OB-yields).
Improvement data use
The data team members and team leader stated that they tended to go too fast through the eight
steps of the data team intervention cycle. This was caused by the temptation to solve the problem
too soon. The team leader stated that the pace improved towards the end.
The teachers claimed that they talk about how to test. In a section meeting with the school
leaders they discussed about RTTI and gathering data. An important aspect for them is that it needs
to be efficient and balanced. It may cost time, but then it must produce results for their education.
The team leader experienced that colleagues are consciously working with data. ‘How do you work with data, and what does it yield.’ She stated that a shift has taken place towards an evidence-based decision-making mindset within the organization. Problems are no longer dismissed as the inability
of the pupil, but the teacher teams search for the underlying cause and try to correct it.
The trainers’ logs showed clear learning moments in data use in the data team and the school, such as: ‘The team gathers more knowledge on how to use the intervention and data use.’ And ‘Discussing the data team was a real eye-opener for some people.’
4.1.3 Sustainability School B
Ostensive
The data team members stated that data use is mentioned in domain learning plans, and the
multiple year policy plan. However, they stated that the teachers did not receive hours to work with
data, nor is it mentioned on their task list.
The strategic policy plan of the organization stated that data teams are used to evaluate,
improve and innovate education. Furthermore, systematically gathering data for taking
responsibility, adjusting education and planning their marketing position is mentioned multiple
times in the multiple year policy plan. The school guide stated a broad spectrum of data the school
collects for educational quality assurance. The multiple year policy plan stated that the school
systematically gathers data to evaluate, analyze and improve education. Furthermore, it stated that
the gathered data is input for teams, sectors, and domains to construct improvement plans.
Additionally, evaluation, feedback and reflection help to improve the organization and that they
All documents stated that multiple sources of data are used to improve education. For
instance: ‘Means for educational quality assurance that are used are among others: Evaluating and discussing data on starting, finishing and switching educational tracks with those involved, teams, colleagues and domain groups.’ The multiple year policy plan of school B and the school guide both stated that active collaboration and communication in teams, sections, domains and professional
learning community is self-evident within their school.
Performative
The school leader stated that they organized training days for the teaching domains where data use
was a subject. Furthermore, he stated that management is mainly focused on the most basic data
and data use is not or sparsely a returning topic with management.
The team leader stated that data use is hardly a topic of discussion during team meetings.
Mainly, this consists of looking at and comparing their educational results within and between
domain groups, on a yearly basis.
The data team members stated that the school is currently still working with the data team
intervention, that is in the last phase of the eight-step cycle. In that sense the data team
intervention has been a part of the school. Furthermore, the domains mathematics and ICT use the
intervention to research specific topics approximately three times a year. The consensus is that
overall it is not structured in daily practice. The teachers stated that their team leader does use data
during meetings and that data is used for educational improvement during team meetings. In the
trainer’s logs of school B was mentioned that the colleagues in the school viewed data use as self-evident.
intervention adapted to needs school
The school leader stated that the school will continue with data team intervention for the domains
in VMBO. They intend to use data to make improvements to their education. The team leader did
not confirm this entirely. He stated that there are currently no more data teams active, also because
facilitation has stopped, and the intervention is considered time intensive. Furthermore, the original
data team did not evaluate their endeavor as they had agreed upon. If he would use the data team
intervention again he would compromise and shorten it.
The data team members stated that the intervention they used has been compromised in some
degree. Mainly, the technical part of research, the verifying of data and the hypotheses was partially
The logs confirmed that data team members tend to skip steps to get to suitable measures
for their educational problem, including the team leader. Furthermore, they mentioned the start of
two new data teams in the upcoming year.
Improvement education
The school leader and the team leader stated that in their opinion the school does not use data
enough for improving educational practice. There are initiatives, and they do talk about it, but it is
not a ‘way of life’. More importantly, they stated that the results of the data team were hardly used to implement measures. But they do think that the data team intervention caused a shift towards
data use in the discussion inside the school.
The team leader stated that the school did use their educational quality assurance manager
in multiple areas for yearly data, like the prognoses and results of the educational tracks as input for
improvement. Additionally, the intervention led to the school trying to improve their own activities,
instead of looking for a cause outside the school.
The data team members stated that data use for educational improvement is part of daily
practice as it was before the data team intervention. Teachers look at the grades, attendance, and
homework of their pupils and act upon it. In addition, the school did use study days to look at results
per domain with a more concise variant of the data team intervention. One of the data team
members stated that he does notice that colleagues of the domain mathematics do look at data
more often and that he still looks at the former goal of the data team intervention at the end of the
year. Furthermore, both data team members stated that the implementations that followed the
data team intervention are still in place. However, after a year and a half of researching how to
improve the new HAVO GT management stopped the initiative. The presented findings were
dismissed completely by management.
The teachers stated that they are more aware of the way they differentiate in their classes
because of the data team intervention. Furthermore, they thought that data use for improving
educational practice is present through team meetings where they look at data such as yearly
grades, but not frequently present. In addition, the colleagues stated that the school is always trying
to improve educational practice, but that it is often unclear for them why the initiative started.
In the trainer’s logs of school B there was extensively mentioned that the goal of data team was to improve educational performance, more specifically how to improve the yield of the HAVO-GT class
Improvement data use
The school leader thought that people in education feel personally attacked by findings and that this
is a reason for management to refute the findings of the data team. Furthermore, the school leader
stated the sector VMBO still believes in the data team intervention, but not every sector leader is
equally enthusiastic about this. He stated that upper management still want to transform towards a
more data use oriented education away from the penalization culture. The school leader concludes
that they are on the right path and improve data use step by step towards ‘data use as a way of life’. The team leader stated that he noticed that data use is not imbedded in education.
Colleagues often come to them with an idea, but without the support of data. He did notice a
difference between colleagues and former data team members in this regard and thus some
learning effect took place.
The data team members stated that one added value of the data team intervention is that
they and the team where the measures were implemented now search for the cause of a problem
and a foundation for their opinion. However, they think that teachers’ opinions on data use still
differ a lot from each other, some are not convinced of the value. One big advantage that they
mentioned is that there is now more discussion on the processes and the assumptions.
The logs of school B showed multiple times that learning how to use data and the
intervention is a goal of this data team, this was emphasized by their team leader: ‘We will work very structured to learn how we need to conduct research within our school.’ In addition, learning
moments of the data team were mentioned, such as: ‘They do state that they have less knowledge
on qualitative research but would like to learn this.’
4.2 Knowledge Sharing
4.2.1 Knowledge sharing School Board Reciprocity
No mention of reciprocity was made by the respondent.
Centralization
The board member stated that he thinks that the knowledge from the data team intervention will
leave the school with the former data team members. He stated that it is very difficult to secure
Knowledge sharing data use
The board member stated that he thinks that knowledge sharing on the data team intervention did
happen during conferences and scheduled return days for data team members.
Knowledge sharing educational problem
No mention of forward knowledge sharing of the educational problem was made by the respondent.
4.2.2 Knowledge Sharing School A Reciprocity
The team leader stated that she thinks that the school board did take intrinsic involvement as a
factor when selecting the data team members. She stated that she thinks that she was most
involved as a school leader and that the school board was little involved during the process, except
for the educational quality assurance manager, who was almost always present.
The data team members stated that reciprocity in general is high in their school. All
colleagues are involved in each other’s problems and help each other. The educational quality assurance manager present confirmed this when comparing this school to others she works for.
Furthermore, everyone in the data team was involved in the process and every member put in the
same amount of work, but the team leader in the data team had the final responsibility that the
lessons.
The teachers stated that they would typify their school as a ‘cooperation school’, just as the
data team members and the educational quality assurance manager. The teachers form a close team
and the majority is enthusiastic and works for the goals of the school. The teachers within the
concerning team whom where the most involved are the data team members and the colleagues
who need to carry out the measures. They do note that there are other colleagues that showed
interest and wanted to be informed on what the data team does.
The trainers’ logs showed that the cooperation and atmosphere at the start were low,
members did not show a lot of enthusiasm or initiative. After the first few meetings the data team
members were all really involved, except for one member, who regularly turned up late and
responded nonchalant. All members contributed during the meetings, participating actively in
discussions, and in the preparation with the gathering and processing of data. Towards the end,
when constructing measures, the team leader and another member somewhat carried the team
with their due diligence.
Centralization