http://go.warwick.ac.uk/lib-publications
Original citation:
Edwards, R. S. (Rachel S.), Clough, A. R., Rosli, M. H., Hernandez-Valle, Francisco and
Dutton, B. (2011) Detection and characterisation of surface cracking using scanning
laser techniques. In: International Congress on Ultrasonics (ICU 2011), University of
Gdańsk, 5-8 September 2011
Permanent WRAP url:
http://wrap.warwick.ac.uk/40107
Copyright and reuse:
The Warwick Research Archive Portal (WRAP) makes the work of researchers of the
University of Warwick available open access under the following conditions. Copyright ©
and all moral rights to the version of the paper presented here belong to the individual
author(s) and/or other copyright owners. To the extent reasonable and practicable the
material made available in WRAP has been checked for eligibility before being made
available.
Copies of full items can be used for personal research or study, educational, or
not-for-profit purposes without prior permission or charge. Provided that the authors, title and
full bibliographic details are credited, a hyperlink and/or URL is given for the original
metadata page and the content is not changed in any way.
Publisher’s statement:
Copyright (2011) American Institute of Physics. This article may be downloaded
for personal use only. Any other use requires prior permission of the author and
the American Institute of Physics.
http://proceedings.aip.org/resource/2/apcpcs/1433/1?isAuthorized=no
A note on versions:
The version presented here may differ from the published version or, version of record, if
you wish to cite this item you are advised to consult the publisher’s version. Please see
the ‘permanent WRAP url’ above for details on accessing the published version and note
that access may require a subscription.
Detection and Characterisation of Surface Cracking using
Scanning Laser Techniques
R.S. Edwards, A.R. Clough, M.H. Rosli, J.F. Hernandez-Valle and B. Dutton
Department of Physics, University of Warwick, Coventry CV4 7AL, UK
Abstract. The use of lasers for generating and detecting ultrasound is becoming more established in non-destructive
testing. However, there is still scope in developing the techniques to fully realise the benefits of non-contact measurements. One application is the detection of surface defects in metals; for example, rolling contact fatigue in rails, and surface cracking on billets or plates. We present measurements using a pulsed Nd:YAG laser to generate surface ultrasonic waves and an interferometer to detect the surface displacement on the sample, and investigate the interaction of Rayleigh or Lamb waves with surface defects. Signal enhancement in the near-field is observed for Rayleigh waves when either the generator or detector is close to a defect. For a scanned detector measurement, enhancement is observed due to constructive interference of the incident and reflected waves. For a scanned generator measurement, the change in generation conditions when the laser is over the defect also lead to an enhancement. In measurements of plate samples we observe similar enhancement effects whereby higher order modes are observed when the laser is above a defect. We discuss the implications of signal enhancements for detecting and characterising surface cracking.
Keywords: laser ultrasound, surface waves, non-destructive testing, defect characterisation.
PACS: 43.35.Yb, 43.38.Dv, 43.60.+d, 43.20.Gp, 81.70.Cv
INTRODUCTION
One important aspect of non-destructive testing (NDT) is the detection and characterisation of defects, and in particular surface breaking defects in metals, for example rolling contact fatigue (RCF) in rails [1] and stress corrosion cracking (SCC) in e.g. pipework [2]. If left untreated such cracking could be disastrous. In recent years, research has shown that surface ultrasonic waves are a good probe of the properties of surface cracking [3-8]. Much of this work has considered simple calibration defects, which are typically machined slots into the surface of the metal. We have shown that it is important to consider the geometry of the defects; for example, RCF initially propagates at an angle of around 25° to the rail surface, whereas SCC grows in a branched manner [4,5].
The type of surface wave one can use to probe the properties of surface defects depends on the sample geometry. In railway track samples, the surface is curved and hence a type of guided wave propagates. However, when considering propagation over short distances this guided wave can be approximated as a Rayleigh wave [9]. On plate samples, where the thickness is less than the wavelength of the ultrasonic surface wave, Lamb waves will propagate with the modes present dependent on the frequency · thickness product [10].
EXPERIMENTAL DETAILS
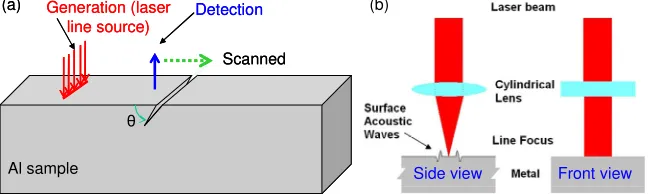
Laser generation and detection of ultrasound is detailed elsewhere [5,11], hence we present here only brief details of these experiments. Laser generation typically uses a pulsed laser, which generates high frequency broadband waves. We use a Nd:YAG laser at 1064 nm wavelength, with a 10 ns pulse duration. The laser can be used in two regimes; at high energy density, the laser will create a plasma at the surface consisting of the vaporised sample and/or air breakdown which will hit the sample, creating an ultrasonic pulse [11]. This method is not generally non-destructive. At lower energy densities there is no damage and the laser pulse heats rapidly a small volume of the sample. The resulting expansion / contraction generates the ultrasound pulse. We work in the thermoelastic regime, with the laser focussed into a line source of approximate dimensions 6 mm by 300 µ m, as shown in figure 1(b).
Generation (laser line source)
Detection
Al sample
θ
Side view Front view
Scanned
(a) Generation (laser (b)
line source)
Detection
Al sample
θ
Side view Front view
Scanned
[image:3.595.140.466.226.323.2](a) (b)
FIGURE 1. (a) Scanning set-up for laser generation and detection of Rayleigh waves on a thick sample. (b) focussing the
generation laser into a line source.
Laser detection typically uses interferometric techniques. Here, we report measurements using an IOS two-wave mixer interferometer [12]. This has a 125 MHz bandwidth, allowing measurements over a wide frequency range. The out-of-plane displacement of the sample surface as the wave passes underneath the detection point is measured. The interferometer works on rough surfaces without the need for surface preparation, which brings many benefits to NDT on industrial samples. Figure 1(a) shows the full experimental set-up. The optics for the laser generation and detection are sat on a scanning stage and scanned over the sample. In these measurements, the laser generator or detector are scanned in turn over a surface-breaking defect. Measurements of a defect where the generation laser is in the region of a defect are known as scanning laser line source (SLLS) [7], whereas measurements with the detector in the region of a defect are scanning laser detector (SLD) [4].
LASER SCANNING FOR NDT
We now highlight two applications of this laser scanning system. Firstly we look at the comparison of SLLS and SLD when scanning on thick samples, and consider the interaction of Rayleigh waves with cracks of different orientations relative to the sample surface. Secondly, we consider the near-field interaction of Lamb waves with surface defects and the implications to measurements of detecting out-of-plane signals only.
Rayleigh Waves Incident on Surface Defects
The transmission of Rayleigh waves underneath surface-breaking defects has been shown to be useful for characterisation of surface cracking [3]. Laser generated waves are ideal for this application, due to their broadband nature; an A-scan is shown in figure 2(a), with the frequency content shown in figure 2(b). It is known that a surface crack will act as a filter, allowing the waves with longer wavelengths to pass underneath the defect, while blocking much of the high-frequency waves. One can study changes in transmission as a function of defect depth, or changes in the transmitted frequency content, and use this to characterise the depth of a defect [3]. However, the transmission shows some angle dependence, and hence it is important to know the defect angle before applying a depth calibration [5].
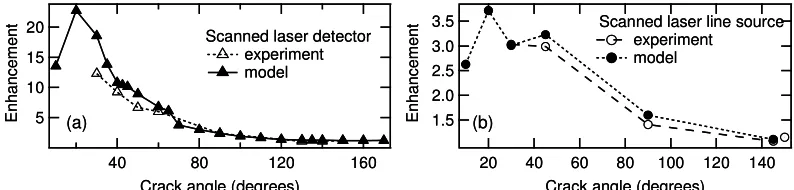
defect (SLD) it will be sensitive to the constructive interference of the incident and reflected Rayleigh waves, plus the mode converted surface-skimming longitudinal wave. As the crack angle changes there is still constructive interference of incident and reflected / mode-converted waves, however, the exact modes present vary depending on crack angle [4]. This leads to an angle dependence of the signal enhancement, as shown in figure 3(a), with enhancements of over 20 times the incident signal observed for shallow crack angles.
Frequency (MHz) Time (µs) S ig n a l (a rb . U n it s ) F F T m a g n it u d e (a rb . U n it s )
0 2 4 6 8 0 1 2 3 4
Frequency (MHz) Time (µs) S ig n a l (a rb . U n it s ) F F T m a g n it u d e (a rb . U n it s )
[image:4.595.134.461.160.251.2]0 2 4 6 8 0 1 2 3 4
FIGURE 2. (a) Laser generated signal on an aluminium sample. The large feature is the Rayleigh wave. (b) A fast Fourier
transform (FFT) of the Rayleigh wave, showing its frequency content.
When the laser generator is close to a defect (SLLS) the generation conditions change; the area over which the laser generates signals will become smaller, altering the generated wave [11]. The boundary conditions also change, which again can lead to a larger signal amplitude. There is also constructive interference of the incident and reflected Rayleigh waves; in this case, the surface-skimming longitudinal wave will be attenuated by the time it reaches the detector and have little effect. For angled defects we observe a small change in the overall enhancement (figure 3(b)) due to the small changes in the reflection coefficient for the Rayleigh wave plus concentration of the laser generation energy into a smaller thickness of sample.
3.5 3.0 2.5 2.0 1.5 E n h a n c e m e n t 140 120 100 80 60 40 20
Crack angle (degrees)
Scanned laser line source experiment model 20 15 10 5 E n h a n c e m e n t 160 120 80 40
Crack angle (degrees)
Scanned laser detector experiment model (a) (b) 3.5 3.0 2.5 2.0 1.5 E n h a n c e m e n t 140 120 100 80 60 40 20
Crack angle (degrees)
Scanned laser line source experiment model 20 15 10 5 E n h a n c e m e n t 160 120 80 40
Crack angle (degrees)
Scanned laser detector experiment model
(a) (b)
FIGURE 3. Signal enhancements for (a) scanned laser detector, (b) scanned laser generator, as a function of angle.
The scanning detector arrangement shows great promise for detection of angled surface defects, with the large signal enhancements giving an excellent fingerprint of the presence of a defect. The enhancement for shallow angles is due to the mode-conversion of the Rayleigh wave to a Lamb-wave like mode as the local frequency-thickness changes due to the geometry of the defect [4,10].
Lamb Waves and Surface Defects on Plates
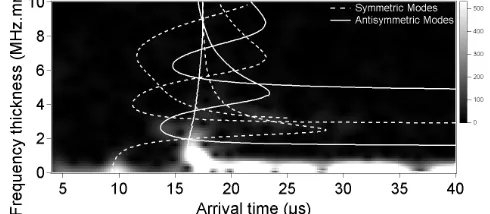
In plate samples the propagating surface wavemode is a Lamb wave. It has been shown that when the laser generation is over a defect it will generate higher order modes than are present away from the defect [14]. This, again, is a good indication that a surface defect is present. Here we present SLD measurements, investigating the implications of mode-conversion and interference when the detector is close to a defect. Figure 4(a) shows a typical A-scan generated and detected using laser techniques, while (b) shows the calculated dispersion curve for aluminium [10]. The A-scan shows a very small S0 mode, followed by a distinct dispersive A0 mode. While both modes are generated the IOS interferometer is sensitive to out-of-plane displacements, and for small frequency · thickness the S0 is predominantly in-plane, while the A0 is predominantly out-of-plane. We can see this more clearly in figure 5, showing the time-frequency representation of an A-scan with the calculated arrival times overlaid.
[image:4.595.101.498.378.473.2]near-field we have a mode conversion from S0 to A0, hence this A0 mode will occur at the arrival time of the S0 mode and will be detected by the interferometer in the near-field only.
O
u
t-o
f-p
la
n
e
d
is
p
l.
(
n
m
)
G
ro
u
p
v
e
lo
c
it
y
(k
m
/s
)
Time (µs) Frequency thickness (MHz.mm)
20 40 60 80
-0.4 0.4
0
0 2 4 6 8
0 2 4 6
(a) (b)
O
u
t-o
f-p
la
n
e
d
is
p
l.
(
n
m
)
G
ro
u
p
v
e
lo
c
it
y
(k
m
/s
)
Time (µs) Frequency thickness (MHz.mm)
20 40 60 80
-0.4 0.4
0
0 2 4 6 8
0 2 4 6
[image:5.595.88.492.126.225.2](a) (b)
FIGURE 4. (a) A typical laser-generated A-scan. (b) Group velocity as a function of frequency · thickness.
FIGURE 5. Time-frequency analysis of an A-scan measured on an aluminium sample, with calculated arrival times overlaid.
CONCLUSIONS
Scanning laser generation and detection of ultrasonic surface waves can bring many benefits to NDT. For Rayleigh waves on thick samples, the transmitted amplitude and frequency content can be used to characterise the defect depth, which the signal enhancement can be used to position the defect and to gain some idea of its inclination relative to the surface. A similar enhancement effect is observed for Lamb waves incident on defects on plates, and again signal enhancement has been shown to be a suitable fingerprint of the presence of a defect.
ACKNOWLEDGMENTS
This work was funded by the ERC under grant 202735, NonContactUltrasonics. The authors would like to thank Bob Day and Professor Steve Dixon for their assistance.
REFERENCES
1. Armitage P.R., Insight 44 (6) 369 (2002)
2. The National Physical Laboratory, Report on Stress Corrosion Cracking (2000) 3. Edwards R.S., Dixon S., and Jian X., Ultrasonics44 (1) 93 (2006)
4. Edwards R.S., Dutton B., Clough A.R and Rosli M.H., Applied Physics Letters (in press, 2011) 5. Dutton B., Clough A.R., Rosli M.H. and Edwards R.S., NDT&E International44 (4) 353-360 (2011) 6. Kinra V.K. and Vu B.Q., Journal of the Acoustical Society of America79 (6) 1688 (1986)
7. Kromine A.K., Fomitchov P.A., Krishnaswamy S. and Achenbach J.D., Materials Evaluation58 (2) 173 (2000) 8. Blackshire J.L. and Sathish S., Applied Phys. Letters80 (18) 3442-3444 (2002)
9. Fan Y., Dixon S., Edwards R.S. and Jian X., NDT&E International40 (6) 471-477 (2007) 10. Rose, J.L., Ultrasonic waves in Solid Media, Cambridge University Press (1999)
11. C.B. Scruby, L.E. Drain. “Laser ultrasonics: techniques and applications.” Adam Hilger, 1990
12. Klien M., Bacher G., Grunnet-Jepson A., Wright D. and Moerner W., Optics communications 162 79 – 84 (1999) 13. Edwards, R.S., Jian X. and Dixon S.., Applied Physics Letters87 (19) 3 (2005)
14. Dixon S., Burrows S.E., Dutton B. and Fan Y., Ultrasonics51 (1) 7-16 (2011)
[image:5.595.173.418.253.360.2]