s
ANALYTICAL METHOD VALIDATION FOR QUANTITATIVE ESTIMATION OF
ACIFLUORFEN BY USING RP
*Swathi, R., Ramachandra, B. and
1
Department of Chemistry, S.V.University
2
Department of Chemistry Annamacharya Institute of Technology and Sciences,
ARTICLE INFO ABSTRACT
A simple, selective, precise and accurate High Performance Liquid Chromatographic method for the analysis of
mobile phase consists of mixture of 0.05% phosphoric acid and acetonitrile in the proportion 20: 80 (v/v). This was found to give sharp peak of
Acifluorfen
regression analysis data for the calibration curve showed a good linear relationship with a regression coefficient 0.998 in the concentration
=1907x + 270.4. The developed method was employed with a high degree of precision and accuracy for the analysis of
rugged
of the mobile phase indicated that this method is useful for the quantification of
Copyright©2017, Swathi et al.This is an open access article
distribution, and reproduction in any medium, provided the original work is properly cited.
INTRODUCTION
There are more than 5800 kinds of weeds, which significantly do harm to the agricultural production and hence weed control has always been an important issue in agrochemical practice. Herbicides are used widely in the world in protecting crops from undue competition from weeds. The intensive application and abuse of herbicides has resulted in the contamination of the atmosphere, soil, water, and agricultural products such as wheat, corn, fruits, vegetables, beans etc., and, consequently, herbicides or its metabolites enters the foo
([email protected], http://www.intechopen. com/books/herbicides-theory-and-applications
(5-[2-chloro-4-(trifluoromethyl)
phenoxy]-2-is a selective contact diphenolic ether herbicide used to control broadleaf weeds and grasses by inhibition of protoporphyrinogen oxidase enzyme (Tomlin, 1994 soybeans, peanuts, mung beans, peas, strawberries, and rice. It can be applied before or after crop emergence (http://tacomaag.com/wpcproduct/acifluorfen
is especially effective against cocklebur, velvetleaf, common lambsquarters, morning glory, and jimsonweed.
*Corresponding author: Swathi, R.,
Department of Chemistry, S.V.University, Tirupati India.
ISSN: 0975-833X
Article History:
Received 10th November, 2016
Received in revised form 24th December, 2016
Accepted 18th January, 2017
Published online 28th February,2017
Key words:
Acifluorfen, HPLC, Method Development and Validation.
Citation: Swathi, R., Ramachandra, B. and Venkatasubba Naidu, N.
using rp-hplc”, International Journal of Current Research
RESEARCH ARTICLE
ANALYTICAL METHOD VALIDATION FOR QUANTITATIVE ESTIMATION OF
ACIFLUORFEN BY USING RP-HPLC
Swathi, R., Ramachandra, B. and Venkatasubba Naidu, N.
Department of Chemistry, S.V.University, Tirupati -517502, A.P., India
Department of Chemistry Annamacharya Institute of Technology and Sciences,
Tirupati-517520.A.P., India
ABSTRACT
A simple, selective, precise and accurate High Performance Liquid Chromatographic method for the analysis of Acifluorfen in its formulations was developed and validated in the present study. The mobile phase consists of mixture of 0.05% phosphoric acid and acetonitrile in the proportion 20: 80 (v/v). This was found to give sharp peak of Acifluorfen at a run time of 10 min.
Acifluorfen was carried out at a wave length of 225 nm with a flow rate of 1.0mL/ min. The linear regression analysis data for the calibration curve showed a good linear relationship with a regression coefficient 0.998 in the concentration range of 50% to 150%. The linear regression equation was y =1907x + 270.4. The developed method was employed with a high degree of precision and accuracy for the analysis of Acifluorfen. The method was validated for accuracy, precision, robustness, ruggedness and specificity. The precision, accuracy, sensitivity, short retention time and composition of the mobile phase indicated that this method is useful for the quantification of
is an open access article distributed under the Creative Commons Attribution License, which distribution, and reproduction in any medium, provided the original work is properly cited.
kinds of weeds, which significantly do harm to the agricultural production and hence weed control has always been an important issue in agrochemical practice. erbicides are used widely in the world in protecting crops e intensive application and abuse of herbicides has resulted in the contamination of the atmosphere, soil, water, and agricultural products such as wheat, corn, fruits, vegetables, beans etc., and, consequently, herbicides or its metabolites enters the food chain http://www.intechopen. applications). Acifluorfen
-nitrobenzoic acid) is a selective contact diphenolic ether herbicide used to control adleaf weeds and grasses by inhibition Tomlin, 1994), in soybeans, peanuts, mung beans, peas, strawberries, and rice. It or after crop emergence (http://tacomaag.com/wpcproduct/acifluorfen-2e-herbicide). It is especially effective against cocklebur, velvetleaf, common lambsquarters, morning glory, and jimsonweed.
Department of Chemistry, S.V.University, Tirupati -517502, A.P.,
Acifluorfen selectively controls broadleaf weeds when applied after soybeans have emerged (Wills, 1981
compound is enhanced by sunlight. Acifluorfen
to some crops plant such as soybeans if mixed with fertilizers. (http://pmep.cce.cornell.edu/profiles/extoxnet/24d
acifluorfen-ext.html). Acifluorfen
expected to adsorb to some suspended solids and sediment (Swann, 1983; USEPACaseNo.2605
oppsrrd1/REDs/acifluorfen_red.pdf;
2000; Tomlin, 2004 and Nandihalli, 1999 Acifluorfen forms complexes
cations (Gaston, 2000 and USEPA
solid-phase microextraction (SPME) and capillary electrophoresis/mass spectrometry (CE/MS)
Rodríguez, 2003), capillary gas chromatographic (GC) method, Electron capture and microcoulometric gas chromatography (Goerlitz
microextraction, derivatization, and fast gas chromatography with electron capture detection
techniques (Catalina, 2000; Cessna 2008; Ding, 2000; Hodgeson,
the determination of Acifluorfen in various matrices.
these methods require a great deal of trouble and most of these methods are expensive, complicated, and tedious, uses large amounts of solvent and time-consuming. Therefore, there is a need for better methods of analysis and this article describes the novel application of a modified QuEChERS method for
Available online at http://www.journalcra.com
International Journal of Current Research
Vol. 9, Issue, 02, pp.46118-46124, February, 2017
INTERNATIONAL
Swathi, R., Ramachandra, B. and Venkatasubba Naidu, N. 2017. “Analytical method validation for quantitative estimation of acifluorfen by
International Journal of Current Research, 09, (02), 46118-46124.
z
ANALYTICAL METHOD VALIDATION FOR QUANTITATIVE ESTIMATION OF
Naidu, N.
517502, A.P., India
Department of Chemistry Annamacharya Institute of Technology and Sciences,
A simple, selective, precise and accurate High Performance Liquid Chromatographic method for the in its formulations was developed and validated in the present study. The mobile phase consists of mixture of 0.05% phosphoric acid and acetonitrile in the proportion 20: 80 at a run time of 10 min. HPLC analysis of was carried out at a wave length of 225 nm with a flow rate of 1.0mL/ min. The linear regression analysis data for the calibration curve showed a good linear relationship with a regression range of 50% to 150%. The linear regression equation was y =1907x + 270.4. The developed method was employed with a high degree of precision and accuracy . The method was validated for accuracy, precision, robustness, ness and specificity. The precision, accuracy, sensitivity, short retention time and composition of the mobile phase indicated that this method is useful for the quantification of Acifluorfen.
ribution License, which permits unrestricted use,
Acifluorfen selectively controls broadleaf weeds when applied Wills, 1981). The activity of this by sunlight. Acifluorfen may be toxic to some crops plant such as soybeans if mixed with fertilizers.
http://pmep.cce.cornell.edu/profiles/extoxnet/24d-captan/ Acifluorfen in its anionic form is expected to adsorb to some suspended solids and sediment USEPACaseNo.2605; http://www.epa.gov/ oppsrrd1/REDs/acifluorfen_red.pdf; Hornsby, 1996; Doucette, 2000; Tomlin, 2004 and Nandihalli, 1999), and with divalent and trivalent USEPA, 2007). A method based on phase microextraction (SPME) and capillary electrophoresis/mass spectrometry (CE/MS) (Rafael capillary gas chromatographic (GC) method, Electron capture and microcoulometric gas Goerlitz, 1967), liquid-liquid microextraction, derivatization, and fast gas chromatography with electron capture detection[18] and several chromatography Cessna, 1992; Butz, 1993; Chu,
Hodgeson, 1994) are developed for the determination of Acifluorfen in various matrices. However,
these methods require a great deal of trouble and most of these methods are expensive, complicated, and tedious, uses large consuming. Therefore, there is a need for better methods of analysis and this article describes the novel application of a modified QuEChERS method for
INTERNATIONAL JOURNAL OF CURRENT RESEARCH
Acifluorfen determination in its formulations. The HPLC method described here is simple, sensitive, and reproducible for determination in formulations with low background interference. An attempt has been made to develop and validate to ensure their accuracy, precision and other analytical method validation parameters as mentioned in various gradients. For pesticide formulation the proposed method is suitable for their analysis with virtually no interference of the usual additives presented in pesticide formulations.
Structure
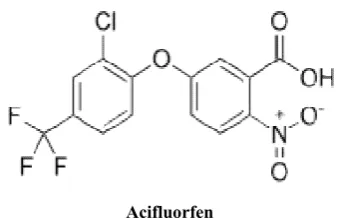
Acifluorfen
Chemical name: 5-[2-Chloro-4-(trifluoromethyl)phenoxy]
nitrobenzoic acid
Molecular formula: C14H7ClF3NO5
Molecular Weight: 361.66 g·mol−1
Instruments Required
High performance liquid chromatography, with UV / PDA detector, HPLC Analytical column of RP
4.6mm x 5µ , Analytical weighing balance B204S
Millipore Nylon 0.2µm
Chemicals Required
Acifluorfen working standard, Blazer®, Acetonitrile Phosphoric Acid – AR, Millipore Water.
determination is carried out by HPLC system equipped with UV/VIS detector.
Chromatographic conditions:
Column : RP - C18, 25mm x 4.6mm x 5µ
Mobile Phase : For isocratic system, prepare a
mixture of 0.05% Phosphoric acid and Acetonitrile in the proportion 20: 80 respectively. Mix well. Filter through 0.2 µ Nylon membrane filter paper and degas prior to use.
Wavelength : 225 nm
Flow Rate : 1.0 ml / minute Injection volume : 20 μl
Run time : 10 minutes Blank solution : Acetonitrile Diluent : Acetonitrile
Preparation of Acifluorfen Standard Solution
Weigh accurately about 25 mg of Acifluorfen
standard and transfer to a 50 ml volumetric flask. Add 10 ml of diluent and sonicate to dissolve. Dilute to volume with diluent and mix. Transfer 1.0 ml of solution into a 10 ml of volumetric flask and dilute to volume with the diluent and mix.
ermination in its formulations. The HPLC method described here is simple, sensitive, and reproducible for determination in formulations with low background interference. An attempt has been made to develop and nd other analytical method validation parameters as mentioned in various gradients. For pesticide formulation the proposed method is suitable for their analysis with virtually no interference of the usual additives presented in pesticide formulations.
(trifluoromethyl)phenoxy]-2-High performance liquid chromatography, with UV / PDA cal column of RP - C18, 25mm x , Analytical weighing balance - Mettler Toledo
Acetonitrile – AR,
The quantitative determination is carried out by HPLC system equipped with
C18, 25mm x 4.6mm x 5µ For isocratic system, prepare a mixture of 0.05% Phosphoric acid in the proportion 20: 80 respectively. Mix well. Filter through 0.2 µ Nylon membrane filter paper and degas prior to use.
Preparation of Acifluorfen Standard Solution
Acifluorfen working standard and transfer to a 50 ml volumetric flask. Add 10 ml of to dissolve. Dilute to volume with diluent and mix. Transfer 1.0 ml of solution into a 10 ml of volumetric flask and dilute to volume with the diluent and mix.
Preparation of Test Solution
Weigh accurately about 110 mg of
ml volumetric flask. Add 10 ml of diluent and sonicate to dissolve. Dilute to volume with diluent and mix. Transfer 1.0 ml of solution into a 10 ml of volumetric flask and dilute to volume with the diluent and mix.
System Suitability Solution
Use Acifluorfen Standard working solution as system suitability solution.
Procedure
Separately inject equal volumes of blank injections of system suitability solution (
working solution). Then inject two injections of test solution and record the chromatograms. Disregard any peak due to blank in the test solution. Calculate % RSD of five replicate injections of system suitability solution (
[image:2.595.77.246.181.290.2]working solution).
Table 1. System suitability
S. No. 1 2 3 4 5 Mean
Standard Deviation (±) (%) Relative Standard Deviation
Tailing factor and theoretical plates of the peak in the chromatogram obtained with 5
solution (AcifluorfenStandard working solution The limits are as below,
1) Theoretical plates should be not less than 3000. 2) Tailing factor should be less than 2.0.
3) % RSD should be not more than 2.0%.
Validation Parameters
Specificity / Selectivity: Selectivity was performed by
injecting the diluent blank solution, excipient blend, system suitability solution, test solution and results are recorded in Table 2.
Table 2. Results of System
S. No. 1 (Blank) 2 (Standard 1) 3 (Standard 2)
4 (Standard 3)
5 (Standard 4)
6 (Standard 5)
7 (Sample 1) 8 (Sample 2)
Mean
Standard Deviation (±)
(%) Relative Standard Deviation
Weigh accurately about 110 mg of sample and transfer to a 50 volumetric flask. Add 10 ml of diluent and sonicate to dissolve. Dilute to volume with diluent and mix. Transfer 1.0 ml of solution into a 10 ml of volumetric flask and dilute to volume with the diluent and mix.
Standard working solution as system
[image:2.595.328.538.634.798.2]Separately inject equal volumes of blank, five replicate injections of system suitability solution (Acifluorfen standard working solution). Then inject two injections of test solution the chromatograms. Disregard any peak due to blank in the test solution. Calculate % RSD of five replicate injections of system suitability solution (Acifluorfen standard
Table 1. System suitability - Selectivity
Area of Acifluorfen 1993.47 1989.38 1977.76 1957.98 1968.48 1977.41 14.65
(%) Relative Standard Deviation 0.74
Tailing factor and theoretical plates of the peak in the 5th injection of system suitability Standard working solution).
1) Theoretical plates should be not less than 3000. 2) Tailing factor should be less than 2.0.
3) % RSD should be not more than 2.0%.
Selectivity was performed by injecting the diluent blank solution, excipient blend, system suitability solution, test solution and results are recorded in
Table 2. Results of System - Selectivity
Area of Acifluorfen Blank
1993.47 1989.38
1977.76
1957.98
1968.48
1985.26 1988.83
1980.17
12.89
All the injections were processed at the wavelength provided in the method. There was no interference observed from diluent blank solution, excipient blend solution with Acifluorfen peak.
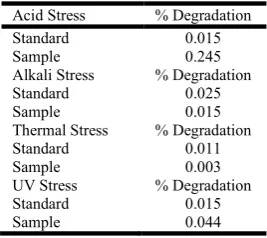
Forced Degradation
[image:3.595.323.539.145.236.2]The forced degradation studies are performed to establish the stability indicating nature of the assay method and to observe any degraded compounds. Acifluorfen WS and Sample (Blazer 224g/L) are subjected to stress with 5N HCl, 5N NaOH, Thermal degradation and UV degradation. The following stress conditions are followed for degradation and tabulated in Table 3.
Table 3. Conditions – Forced Degradation
Sample stress condition Description of stress condition
Acid degradation 5N HCl heated at about 60°C for 10 min on a water bath.
Alkali degradation 5N NaOH heated at about 60°C for 10 min on a water bath.
Thermal degradation 105ºC for 12 hours in Hot-Air oven UV degradation expose to UV-radiation for 7 days
[image:3.595.38.288.242.314.2]All the above solutions are chromatographed and recorded the chromatograms and results recorded in Tables 4 & 5.
Table 4. System suitability – Forced Degradation
S. No. Area of Acifluorfen
1 1982.56
2 1985.81
3 1979.83
4 1987.94
5 1988.83
Mean 1984.99
Standard Deviation (±) 3.76
[image:3.595.308.556.263.505.2](%) Relative Standard Deviation 0.19
Table 5. Results - Forced Degradation
Acid Stress % Degradation
Standard 0.015
Sample 0.245
Alkali Stress % Degradation
Standard 0.025
Sample 0.015
Thermal Stress % Degradation
Standard 0.011
Sample 0.003
UV Stress % Degradation
Standard 0.015
Sample 0.044
Linearity
Linearity and Range for standard
For the linearity study five standard solutions of Acifluorfen were prepared from the range starting from 50% to 150% of the theoretical concentration of assay preparation. The system suitability solution and the linearity solutions were injected. The linearity graph of concentration against peak response was plotted and the correlation coefficient was determined. The system suitability linearity standard solutions were injected and results are mentioned in Table 6. The average peak area of Acifluorfen peak at each concentration level was determined and the linearity graph was plotted against the sample concentration in percentage. The results of linearity study are
as given in Table 7. The linearity plot of peak area of Acifluorfen Vs. standard concentration in percentage is presented in Figure-1 and the correlation coefficient was determined here correlation coefficient should be greater than or equal to 0.998.
Table 6. System suitability - Linearity of standard
S. No. Area of Acifluorfen
1 2045.55
2 2016.67
3 2085.62
4 2035.45
5 2038.78
Mean 2044.41
Standard Deviation (±) 25.40
(%) Relative Standard Deviation 1.24
Table 7. Results of linearity of standard
Linearity Level
Sample Concentration
(in %)
Sample Concentration
(in ppm)
Peak Area
Correlation Coefficient
Level – 1 50 25.0 1221.11 0.998
Level – 2 75 37.5 1732.64
Level – 3 100 50.0 2138.54
Level – 4 125 62.5 2648.60
Level – 5 150 75.0 3147.06
Figure 1. Linearity graph of Acifluorfen standard
Precision
System Precision
Procedure
[image:3.595.58.269.378.469.2]The system precision was performed by injecting 10 replicate injections of system suitability solution and the chromatograms are reviewed for the system suitability criteria.
Table 8. System precision
S. No. Area of Acifluorfen
1 1993.00
2 1994.53
3 1992.24
4 1990.79
5 1990.04
6 1981.26
7 1983.40
8 1969.00
9 1962.83
10 1968.55
Mean 1982.56
Standard Deviation (±) 11.74
(%) Relative Standard Deviation 0.59
[image:3.595.95.229.499.618.2] [image:3.595.334.532.659.796.2]Method Precision
Six test solutions of Acifluorfen in Blazer® and were prepared as per the analytical method. The % RSD of % assay of six test solutions was calculated. The % RSD of % assay of six test solutions was calculated. The results of assay obtained from six test solutions preparations are presented in Table -9 & 10.
Table 9. System suitability - Method precision
Analyst – 1 HPLC No.: EH/R&D/HPLC-024
S. No. Area of Acifluorfen
1 2057.94
2 2054.75
3 2058.40
4 2065.54
5 2065.96
Mean 2060.52
Standard Deviation (±) 4.98
[image:4.595.310.551.85.294.2](%) Relative Standard Deviation 0.24
Table 10. Results of Method precision
Test Solution % Assay of Acifluorfen
1 100.46
2 99.82
3 100.08
4 101.14
5 100.32
6 100.34
Mean 100.36
Standard Deviation () 0.45
(%) Relative Standard Deviation 0.44
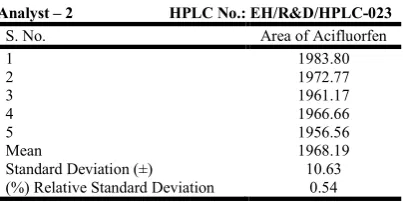
Intermediate Precision
[image:4.595.58.269.295.395.2]Six test solutions of Blazer® 224 g/L Acifluorfen were prepared as per the analytical Method on different day. These test solutions were analyzed by a different analyst using different HPLC column of same make but having different serial number and different HPLC system. The % RSD of assay results of twelve test solutions (six samples from Method precision and six samples from intermediate precision) was calculated. Results are noted in Table - 11, 12 & 13.
Table 11. System suitability - Intermediate precision
Analyst – 2 HPLC No.: EH/R&D/HPLC-023
S. No. Area of Acifluorfen
1 1983.80
2 1972.77
3 1961.17
4 1966.66
5 1956.56
Mean 1968.19
Standard Deviation (±) 10.63
(%) Relative Standard Deviation 0.54
Table 12. Results of Intermediate precision
Test Solution % Assay of Acifluorfen
1 101.88
2 100.96
3 101.27
4 102.42
5 100.12
6 102.04
Mean 101.40
Standard Deviation () 0.81
[image:4.595.63.265.548.649.2](%) Relative Standard Deviation 0.80
Table 13. Results of twelve test solutions of Acifluorfen in Blazer® (six of Method precision & six of intermediate precision)
Analysis performed during Method precision study By Analyst 1 on system 1 and on column 1 on day 1
Same column % Assay of Acifluorfen
1 100.46
2 99.82
3 100.08
4 101.14
5 100.32
6 100.34
Analysis performed during intermediate precision study By Analyst 2 on system 2 and on column 2 on day 2
Column sr. no. 015337030136 01
Test Solution % Assay of Acifluorfen
7 101.88
8 100.96
9 101.27
10 102.42
11 100.12
12 102.04
Mean of twelve samples 100.90
Standard Deviation () 0.86
(%) Relative Standard Deviation 0.85
Robustness
Prepare two test solutions of the same lot of Acifluorfen in Blazer® 224 g/L Acifluorfen as per analytical method. Inject this solution along with diluent blank solution and system suitability solution along different chromatographic conditions as shown below:
Change in column lot (same make, different serial no.) Change in flow rate ( 0.2 ml/minute)
Change in wavelength (± 2 nm)
Change in composition of mobile phase (± 20ml)
Change in Column Lot
[image:4.595.312.552.563.635.2]Normal Experimental Condition:RP - C18, 25mm x 4.6mm x 5µ. The system suitability criteria were found to meet the pre-established acceptance criteria as per the analytical method. Results recorded in Table - 14 for system suitability.
Table 14. System suitability - Robustness with Change in Column Lot
S. No. Area of Acifluorfen
Same column Diff column
1 2040.27 1952.41
2 2028.24 1959.84
Mean 2034.25 1956.13
Standard Deviation (±) 8.51 5.25
(%) Relative Standard Deviation 0.42 0.27
[image:4.595.56.270.680.779.2]The assay results obtained with different flow rate conditions are as given in Table - 15.
Table 15. Results for Change in Column Lot
Flow rate Same column Diff column
Sample % Assay
Test solution 100.46 101.05
Average assay result from Method precision
100.36 100.36
Mean 100.41 100.71
Standard Deviation () 0.07 0.49
[image:4.595.314.554.698.780.2]Change in Flow Rate ( 0.2 mL/minute)
[image:5.595.309.555.85.166.2]Normal experimental condition: 1.0ml/minute. The system suitability criteria were found to meet the pre-established acceptance criteria as per the analytical method. Results are recorded in table - 16 for system suitability.
Table 16. System suitability - Robustness with change in flow rate
S. No. Area of Acifluorfen
0.8mL/minute 1.2 mL/minute
1 2005.76 2009.66
2 2003.39 2012.98
Mean 2004.58 2011.32
Standard Deviation (±) 1.68 2.35
(%) Relative Standard Deviation 0.08 0.12
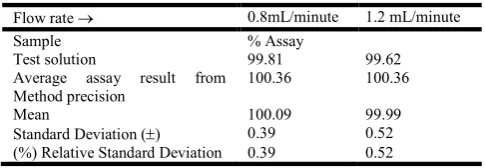
[image:5.595.36.287.156.227.2]The assay results obtained with different flow rate conditions are as given in Table 17.
Table 17. Results for change in flow rate
Flow rate 0.8mL/minute 1.2 mL/minute
Sample % Assay
Test solution 99.81 99.62
Average assay result from Method precision
100.36 100.36
Mean 100.09 99.99
Standard Deviation () 0.39 0.52
(%) Relative Standard Deviation 0.39 0.52
Change in Wavelength (± 2 nm):
[Normal Experimental Condition: 225nm]
The system suitability criteria were found to meet the pre-established acceptance criteria as per the analytical method. Results are recorded in table - 18 for system suitability.
Table 18. System suitability - Robustness with change in wavelength
S. No. Area of Acifluorfen
223 nm 227 nm
1 2083.49 2069.05
2 2080.27 2064.61
Mean 2081.88 2066.83
Standard Deviation () 2.28 3.14
(%) Relative Standard Deviation 0.11 0.15
The assay results obtained with different wavelength conditions are as given in Table - 19.
Table 19. Results for change in wavelength
Wavelength 223 nm 227 nm
Sample % Assay
Test solution 100.81 98.86
Average assay result from Method precision 100.36 100.36
Mean 100.59 99.61
Standard Deviation () 0.32 1.06
(%) Relative Standard Deviation 0.32 1.06
Change in composition of Mobile Phase (± 20ml):
[Normal Experimental Condition: Buffer: Acetonitrile = 200ml: 800ml
[image:5.595.311.555.234.332.2]The system suitability criteria were found to meet the pre-established acceptance criteria as per the analytical method. Results are recorded in table - 20 for system suitability.
Table 20. System suitability - Robustness with change in composition of mobile phase
S. No. Area of Acifluorfen
B220ml:ACN780ml B180ml:ACN820ml
1 2079.80 1956.10
2 2085.62 1959.84
Mean 2082.71 1957.97
Standard Deviation () 4.12 2.64
(%) Relative Standard Deviation
0.20 0.13
[image:5.595.41.284.291.375.2]The assay results obtained with change in composition of mobile phase are as given in Table 21.
Table 21. Results for change in composition of mobile phase
Composition of Buffer
& Acetonitrile B220ml:ACN780ml B180ml:ACN820ml
Sample % Assay
Test solution 99.55 100.31
Average assay result from Method precision
100.36 100.36
Mean 99.96 100.34
Standard Deviation () 0.57 0.04
(%) Relative Standard Deviation
0.57 0.04
Stability of Analytical Solution
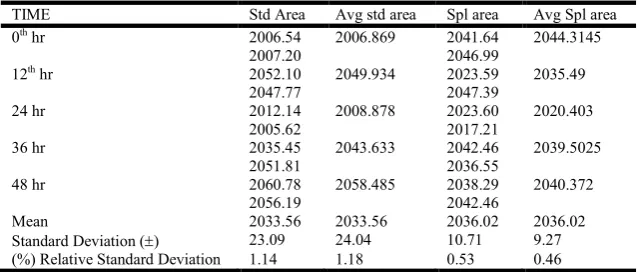
System suitability solution and test solution of Blazer® 224 g/L Acifluorfen were prepared on 0th, 12th, 24th, 36th and 48th hour of experiment and stored these solutions at room temperature for every time interval up to 48 hrs and analyzed these solutions on 48 hrs with freshly prepared test solution. The system suitability solution was prepared freshly at the time of analysis. The assay of Blazer® 224 g/L Acifluorfen in the sample was calculated. The assay results obtained during solution stability experiment are as given in Table-22 & 23
RESULTS AND DISCUSSION
System selectivity: All the injections were processed at the
wavelength provided in the method. There was no interference observed from diluents blank solution, excipients blend solution with Acifluorfen peak. The system suitability criteria were found to meet the pre-established acceptance criteria as per the analytical method. Hence this method is selective.
Forced degradation: There is no interference between the
peaks obtained for the chromatograms of degradation preparations. The degradation peaks under forced degradation are well separated from each other. The peak purity for Acifluorfen peak is passing. Hence, the method is very precise, selective and specific to the estimation of assay of Acifluorfen in Blazer® 224 g/L by HPLC and the same method is stability indicating, as the degraded products are well separated from Acifluorfen and as well from each adjacent peak.
Linearity: Linearity graph of the average area at each level
against the concentration in v/v% is plotted and is found to be a straight line graph. The correlation coefficient is found to be more than 0.998. Hence it is concluded that the method is found to be linear in the range of 50% to 150% of the working concentration.
Precision: The analysis was carried out on six test solutions of
the same lot of the pesticide by two different analysts using
[image:5.595.59.266.494.567.2] [image:5.595.42.281.634.705.2]two different equipments within the same laboratory using two different columns of the same make but having different serial numbers on two different days. The % RSD of the twelve assay results which six of method precision and six from intermediate precision is found to be less than 2.0%. Thus, the method is found to be rugged and precise.
System precision= % RSD= 0.59
Method precision= % RSD= 0.44
Intermediate precision= % RSD= 0.80
Robustness
The analysis of the same lot of Blazer® 224 g/L Acifluorfen was carried out at different conditions of column lot, flow rate, wavelength, and change in composition of mobile phase. The % RSD between results obtained with changed condition and average result of method precision is not more than 2.0%.The analytical method meets the pre-established acceptance criteria for robustness study. Thus, the method is robust.
Stability of Analytical solution
The % RSD between assay results obtained for freshly prepared test solution and the stored test solutions is less than 2.0%.
There is no significant change in assay level observed up to 48 hours for test solution at room temperature. The system suitability was found to meet the pre-established criteria and it can be concluded that the solution is stable up to 48 hours at room temperature.
Summary and Conclusion
The above summary and the validation data summarized in this paper shows that the analytical method of assay of Acifluorfen in Blazer® 224 g/L by HPLC is found to be suitable, selective, specific, precise, linear, accurate and robust. The analytical solution is found to be stable up to 48 hours at room temperature. Hence, it is concluded that the analytical method is validated and can be used for routine analysis and for stability study.
Acknowledgements
The author thanks Analog labs Hyderabad, India and Department of Chemistry, Sri Venkateswara University, Tirupati, India for providing laboratory facilities.
REFERENCES
[image:6.595.137.457.80.216.2]Table 22. Results of Analytical solution Stability
TIME Std Area Avg std area Spl area Avg Spl area
0th hr 2006.54 2006.869 2041.64 2044.3145
2007.20 2046.99
12th hr 2052.10 2049.934 2023.59 2035.49
2047.77 2047.39
24 hr 2012.14 2008.878 2023.60 2020.403
2005.62 2017.21
36 hr 2035.45 2043.633 2042.46 2039.5025
2051.81 2036.55
48 hr 2060.78 2058.485 2038.29 2040.372
2056.19 2042.46
Mean 2033.56 2033.56 2036.02 2036.02
Standard Deviation () 23.09 24.04 10.71 9.27
(%) Relative Standard Deviation 1.14 1.18 0.53 0.46
Table 23. Results for solution stability
% Assay results calculated against the freshly prepared system suitability standard
Sample % Assay of Acifluorfen
0th hr 101.28
12th hr 98.72
24 hr 99.99
36 hr 99.22
48 hr 98.55
Mean 99.55
Standard Deviation (±) 1.12
[image:6.595.193.401.376.494.2](%) Relative Standard Deviation 1.12
Table 24. Performance calculations, detection characteristics, system precision and method precision of the proposed method for Acifluorfen
Parameter HPLC method
Wavelength(nm) 225
Retention time (t)min 7.146
Linearity range (in %) 50-150
LOD (µg/mL) 1.305
LOQ (µg/mL) 3.95
Regression equation y =1907 x +270.4
Slope (b) 1907 x
Intercept (a) 270.4
Correlation coefficient (r2) 0.998
Standard deviation 25.40
Butz, S. & Stan, H.J. (1993). Determination of chlorophenoxy and other acidic herbicide residues in ground water by capillary gas chromatography of their alkyl esters formed by rapid derivatization using various chloroformates. Journal of Chromatography A 643(1-2), 227-238.
Catalina, M.I., Dall ge, J., Vreuls, R.J.J. & Brinkman, U.A.T. (2000). Determination of chlorophenoxy acid herbicides in water by in situ esterification followed by in-vial liquid-liquid extraction combined with large-volume on-column injection and gas chromatography-mass spectrometry. Journal of Chromatography A 877(1-2), 153-166.
Cessna, A.J. (1992). Comparison of extraction/hydrolysis procedures for the determination of acidic herbicides in plants: residues of mecoprop in barley following postemergence application. Journal of Agricultural and
Food Chemistry 40(7), 1154-1157.
Chu, X.G., Yong, W., Ling, Y., Qiu, W.L., Yao, H.Y. (2008). Herbicides in soybean by ultra performance liquid chromatography tandem mass spectrometry. Chinese Journal of Analytical Chemistry 36(3), 325-329.
Ding, W.H., Liu, C.H. & Yeh, S.P. (2000). Analysis of chlorophenoxy acid herbicides in water by large-volume on-line derivatization and gas chromatography-mass spectrometry. Journal of Chromatography A 896(1-2), 111-116.
Doucette WJ; pp. 141-188 in Handbook of Property Estimation Methods for Chemicals. Boethling RS, Mackay D, eds. Boca Raton, FL: Lewis Publ (2000)
Gaston LA, Locke MA; Soil Sci Soc Amer J 64: 112-21 (2000) USEPA; Reregistration Eligibility Decisions (REDs) Database on Sodium acifluorfen (62476-59-9). Goerlitz, D.G., Lamar, W.L., "Determination of Phenoxy Acid
Herbicides in Water by Electron Capture and Microcoulometric Gas Chromatography", U.S. Geol. Survey Water Supply Paper 1967, 1817-C
Hodgeson, J., Collins, J. & Bashe, W. (1994). Determination of acid herbicides in aqueous samples by liquid--solid disk extraction and capillary gas chromatography. Journal of
Chromatography A 659(2), 395-401.
Hornsby AG et al, eds; Pesticide Properties in the Environment, Spring-Verlag: New York, NY p. 42-43 (1996).
http://pmep.cce.cornell.edu/profiles/extoxnet/24d-captan/ acifluorfen-ext.html 63. Swann RL et al; Res Rev 85: 17-28 (1983)
http://tacomaag.com/wpcproduct/acifluorfen-2e-herbicide http://www.epa.gov/oppsrrd1/REDs/acifluorfen_red.pdf as of
Mar 20, 2007.
http://www.intechopen.com/books/herbicides-theory-and-applications
ICH Guideline number: Q2A & Q2B of CPMP / ICH / 281 / 95.
Kuang, H., Hou, Y.X., Chu, X.G., Xu, C.L. (2006b). Simultaneous Determination of Phenoxyacid Herbicides in Soybean by Gas Chromatography-Mass Spectrometry. Chinese Journal of Analytical Chemistry 34(12), 1733-1736.
Nandihalli UB et al; Pestic Biochem Physiol 43: 193-211 (1992) (8) Meylan WM et al; Environ Toxicol Chem 18: 664-72 (1999)]
Rafael Rodríguez , Jordi Mañes , and Yolanda Picó * Off-Line Solid-Phase Microextraction and Capillary Electrophoresis Mass Spectrometry to Determine Acidic Pesticides in Fruits, Anal. Chem., 2003, 75 (3), pp 452–459.
Tomlin CDS, ed; Acifluorfen-sodium (62476-59-9). In: The e-Pesticide Manual, 13th Edition Version 3.1 (2004-05). Surrey UK, British Crop Protection Council.
Tomlin, C.D.S. (ed.). The Pesticide Manual - World Compendium. 10th ed. Surrey, UK: The British Crop Protection Council, 1994., p. 13
USEPA Case No. 2605. Available at http://www.epa.gov/ oppsrrd1/REDs/acifluorfen_red.pdf as of Mar 20, 2007. USEPA; Reregistration Eligibility Decisions (REDs) Database
on Sodium acifluorfen (62476-59-9). USEPA Case No. 2605.
Wendelken, S.C., M.V. Bassett, T.A. Dattilio, and B.V. Pepich, D.J. Munch, determination of chlorinated acids in drinking water by liquid-liquid microextraction, derivatization, and fast gas chromatography with electron capture detection, (US EPA, Office of Ground Water and Drinking Water) - Method 515.4, Revision 1.0 (2000) Wills, G.D. and McWhorter, C.G. 1981. Effect of environment
on the translocation and toxicity of acifluorfen to showy crotalaria. Weed Science. 29: 397-408.