ORIGINAL RESEARCH
MR Imaging: Influence of Imaging Technique and
Postprocessing on Measurement of Internal
Carotid Artery Stenosis
F. Runck R.P. Steiner W.A. Bautz M.M. Lell
BACKGROUND AND PURPOSE: MR angiography (MRA) is increasingly used as an alternative to digital subtraction angiography (DSA) to evaluate internal carotid artery (ICA) stenosis. Because MRA is not standardized in data acquisition and postprocessing, we sought to evaluate the effects of different acquisition techniques (time-of-flight MRA [TOF-MRA]) and contrast-enhanced MRA [CE-MRA]) and postprocessing methods (maximum intensity projection [MIP], multiplanar reformation [MPR], and volume-rendering on stenosis grading.
MATERIALS AND METHODS: Fifty patients (33 men, 17 women) with symptomatic ICA stenosis were examined at 1.5T. Two imaging techniques and 3 postprocessing methods resulted in 6 image datasets per patient. Two readers independently evaluated ICA stenosis according to the North American Symptomatic Carotid Endarterectomy Trial criteria. Interobserver variability was calculated with the Pearson correlation coefficient and simultaneous confidence intervals (CI). The relationship of the values of ICA stenosis between the techniques was assessed by means of simultaneous 95% Tukey CI.
RESULTS: Interobserver agreement was high. Higher concordance was found for postprocessing techniques with TOF- than with CE-MRA; the mean difference between TOF-MPR and TOF-MIP was 0.4% (95% CI,⫺2.9%–3.8%). Stenosis values for CE-MPR differed significantly from those of CE volume-rendering (7.2%; 95% CI, 3.9%–10.6%).
CONCLUSION:Stenosis grading was found to be independent of the postprocessing technique except for comparison of CE-MPR with CE volume-rendering, with the volume-rendering technique resulting in higher stenosis values. MPR seems to be best-suited for measurement of ICA stenosis. Parameter setting is critical with volume-rendering, in which stenosis values were consistently higher compared with the other methods.
I
n large clinical trials like the North American Symptomatic Carotid Endarterectomy Trial, the European Carotid Sur-gery Trial, or the Asymptomatic Carotid Atherosclerosis Study, therapeutic decisions were based on the degree of in-ternal carotid artery (ICA) stenosis determined with digital subtraction angiography (DSA).1-4DSA is still regarded as the gold standard because it provides the highest spatial resolution and dynamic information. On the other hand, the proce-dure is expensive5,6 and associated with neurologic complications.7-9MR angiography (MRA) offers multiple projections, 3D depiction of vessels, and cross-sectional images for the exact measurement of the stenotic lumen and might replace intra-arterial carotid angiography for the measurement of ICA stenosis.10
MRA is increasingly used as a confirmatory examination in patients presenting with either symptomatic or asymptomatic atherosclerotic disease of the ICA after undergoing Doppler sonography. Frequently patients scheduled for intervention (surgery or stent placement) present with MRA examinations performed at other institutions or imaging centers, bringing
along either CD-ROMs including source images as well as maximum intensity projection (MIP), multiplanar reforma-tion (MPR), or volume-rendering studies or only hard copies (film or paper) with postprocessed MRA studies. Contrast en-hanced MRA (CE-MRA) is the predominant technique due to larger volume coverage and shorter examination time. On the other hand, non-CE techniques like 3D time-of-flight MRA (3D-TOF-MRA) are having a renaissance because of an in-creasing number of reports about the adverse effects of gado-linium, especially nephrogenic systemic fibrosis in patients with renal impairment.11
The aim of our study was to compare different imaging techniques (CE-MRA, TOF-MRA) and postprocessing meth-ods (MPR, MIP, volume-rendering) to detect significant dif-ferences in stenosis measurement between the imaging tech-niques or postprocessing methods.
Materials and Methods
Patients
Fifty patients with symptoms related to atherosclerotic disease of the ICA (transient ischemic attack, amaurosis fugax, or stroke) were pro-spectively included in this study. The symptoms were assessed by analysis of patients’ records. Informed consent was obtained from each patient. The study was performed under an institutional review board–approved protocol. Patients’ mean age was 67.5⫾10.8 years (range, 37– 85 years): 17 were women (mean age, 66.2⫾12.2 years; range, 37– 80 years) and 33 were men (mean age, 68.2⫾10.1 years; range, 40 – 85 years).
Received October 20, 2007; accepted after revision April 23, 2008.
From the Department of Radiology and Neuroradiology (F.R.), Klinikum Augsburg, Augsburg, Germany; Department of Sports and Rehabilitation Medicine (R.P.S.), University of Ulm, Ulm, Germany; and Institute of Radiology (F.R., W.A.B., M.M.L.), University Erlangen-Nuremberg, Erlangen, Germany.
Please address correspondence to Frank Runck, MD, Klinikum Augsburg/Department of Radiology and Neuroradiology, Stenglinstr 2, 86156 Augsburg, Germany; e-mail: [email protected]
Imaging Protocol
Examinations were performed on a 1.5T MR imaging system (Sym-phony equipped with a Quantum Gradient System; Siemens Medical Solutions, Erlangen, Germany) by using a head and neck coil array. Sagittal 2D phase-contrast images were obtained as a vessel scout to plan the 3D-TOF-MRA and 3D-CE-MRA sequences. Details of the imaging parameters are given in Table 1.
After acquisition of 3D-TOF-MRA, CE-MRA was performed by acquiring a precontrast scan (mask scan), followed by arterial phase imaging with individually adapted start delays determined by a test-bolus method. Twenty milliliters of contrast agent (gadopentetate dimeglumine, Magnevist; Schering, Berlin, Germany) was injected with a power injector at a rate of 2 mL/s followed by 20 mL of saline. To suppress anatomic background and to enhance vascular visualiza-tion, we subtracted mask images from the CE images.
Image Postprocessing and Analysis:
All datasets were sent to a 3D workstation (Leonardo VD10B, Sie-mens). Patient identification tags were removed. Data were evaluated by using MPR, MIP, and 3D volume-rendering. Two image-acquisi-tion techniques (TOF-MRA, CE-MRA) and 3 postprocessing meth-ods (MPR, MIP, volume-rendering) resulted in 6 different techniques for each carotid artery. A resident and a senior radiologist evaluated the patients. Readers were blinded to clinical data and each other’s results. The different techniques were evaluated in random order with an interval of at least 2 weeks between the sessions to reduce bias introduced by recall of cases.
Measurements on MPRs were performed on image planes ori-ented perpendicular to the vessel. MIP images were generated for each carotid artery separately, and overlaying structures (ie, vertebral ar-teries, external carotid artery) were eliminated if necessary for stenosis measurement. Volume-rendering models were created by using pre-defined settings (opacity 100% for TOF and 90% for CE images) to optimize delineation of the vessel lumen. Parameter settings were predefined by direct comparison of MRA and DSA in a subset of 5 patients who were not included in the study. To compensate for dif-ferences in signal intensity between individual examinations, observ-ers were allowed to perform minor adjustments to optimize vessel visualization. Volume-rendering and MIP datasets could be rotated freely to improve depiction of the maximal lumen narrowing.
Measurements were taken at the site of maximal lumen narrowing and the distal reference well beyond the carotid bulb, where the vessel walls were parallel again,12by using an electronic ruler with a
resolu-tion of 0.1 mm. The degree of the stenosis was calculated by using the following equation: stenosis⫽(1⫺minimal residual lumen/distal ICA diameter)⫻100%.
Because we did not categorize stenosis, we had to assign discrete
stenosis values when no measurements could be taken: 100% for total occlusion, 95% for near occlusion, and 90% in cases of local signal-intensity loss not fulfilling the criteria of near occlusion.12,13“Near
occlusion” was defined as high-grade stenosis with a significant lu-men reduction of the poststenotic arterial lulu-men compared with the contralateral artery.14,15
Statistical Analysis
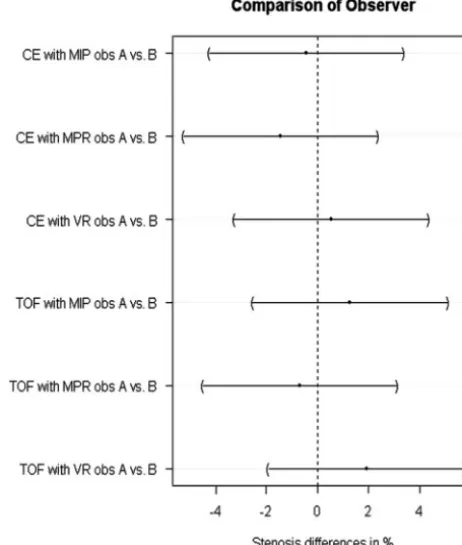
[image:2.594.302.533.46.318.2]Only the symptomatic side was used for statistical analysis. For each of the 6 techniques (TOF-MPR, TOF-MIP, TOF volume-rendering, CE-MPR, CE-MIP, CE volume-rendering), interobserver agreement was determined by means of scatterplots with the Pearson correlation coefficient and calculation of simultaneous 95% confidence intervals (CIs). The null hypothesis postulated the equivalence of the 6 tech-niques. Deflections from the null hypothesis were assessed by means Fig 1.Comparison of differences in stenosis values between the observers. All lines indicating the 95% CI cross the zero line. This shows that observers do not differ significantly in the measurement of ICA stenosis. obs indicates observer; VR, volume-rendering.
Table 2: Mean difference in stenosis values and 95% CI of all symptomatic stenoses for the different techniques
Technique
All Examinations
Exclusion of 90% and 95% Stenoses*
Difference
(%) 95% CI
Difference
(%) 95% CI
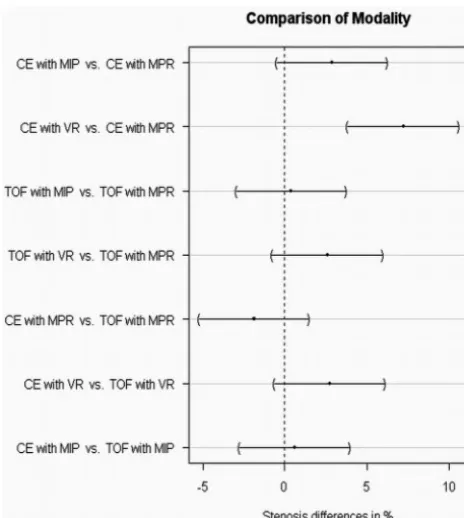
CE-MIP vs CE-MPR 2.9 ⫺0.5–6.2 2.4 ⫺1.1–5.8
CE-VR vs CE-MPR 7.2 3.9–10.6 7.1 3.6–10.5
TOF-MIP vs TOF-MPR 0.4 ⫺2.9–3.8 ⫺0.2 ⫺3.6–3.3
TOF-VR vs TOF-MPR 2.6 ⫺0.8–6.0 2.4 ⫺1.0–5.9
CE-MPR vs TOF-MPR ⫺1.9 ⫺5.2–1.5 ⫺1.5 ⫺5.0–1.9
CE-MIP vs TOF-MIP 0.6 ⫺2.7–4.0 1.0 ⫺2.4–4.5
CE-VR vs TOF-VR 2.8 ⫺0.6–6.1 3.1 ⫺0.3–6.6
Note:—VR indicates volume-rendering; CE, contrast enhanced; MIP, maximum intensity projection; MPR, multiplanar reformation; TOF, time of flight.
[image:2.594.53.286.57.163.2]* Cases of local signal loss were assigned as 90% stenosis; cases of near-occlusion, as 95% stenosis. Exclusion of these cases had no relevant influence on the results.
Table 1: Imaging parameters for 3D-TOF and 3D-CE-MRA
Parameter TOF CE
TR (ms) 35 3.78
TE (ms) 6.95 1.54
Flip angle 25° 35°
rFOV (mm) 150⫻200 188⫻300
Matrix 192⫻512 160⫻512
Slab thickness (mm) 57.6 64
Partitions 72 80
Voxel size (mm) 0.8⫻0.4⫻0.8 1.2⫻0.6⫻0.8
Scanning time (second) 242 21
Note:—rFOV indicates rectangular field of view; TOF, time of flight; CE, contrast enhanced; MRA, MR angiography.
HEAD
&
NECK
ORIGINAL
[image:2.594.301.533.581.699.2]of simultaneous 95% Tukey CI for the mean difference in stenosis in a 1-way layout for the aligned stenosis values. APvalue of less than .05 was regarded as statistically significant.
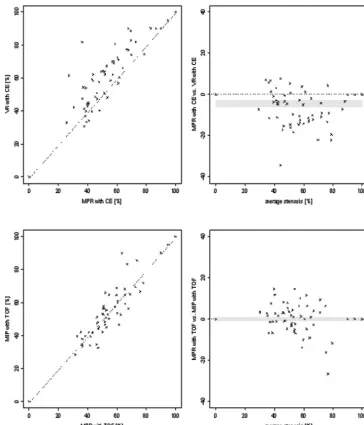
The relationship of the stenosis values between techniques or readers is demonstrated by scatter- and Bland-Altman plots with slightly jittered values.16,17In these plots, the x-coordinate represents
the mean value for each individual patient between observers, tech-niques, or postprocessing methods, and the y-coordinate represents the difference in the percentage of stenosis for the individual mea-surement. Alignment of stenosis values by centering them for each patient around their mean allows comparison of stenosis differences between patients at a common measurement scale.18
The data for comparison between techniques or postprocessing methods were averaged between the observers for each individual patient. All computations were performed in R19; simultaneous 95%
CIs were computed by using the “multicomp” add-on package.20
Results
CE- and TOF-MRA provided good image quality without sig-nificant venous enhancement. The average degree of stenosis
in our patient population was as follows: 57.2% (TOF-MPR), 57.7% (TOF-MIP), 59.8% (TOF volume-rendering), 55.4% (CE-MPR), 58.3% (CE-MIP), and 62.6% (CE volume-render-ing). Correlations between the observers were high, with cor-relation coefficients ranging from 0.97 (CE-MIP) to 0.99 (TOF-MPR). No statistically significant differences between the ICA stenosis values for both readers were found (Fig 1).
[image:3.594.110.474.41.466.2]higher stenosis values if CE-MRA was evaluated with MIP and volume-rendering compared with MPR. MIP and TOF-MPR revealed almost identical results on average. TOF vol-ume-rendering resulted in higher stenosis values, but the dif-ferences were not statistically significant.
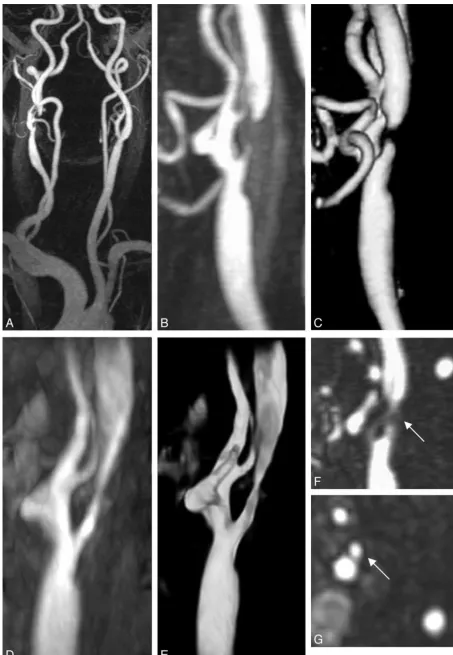
Local signal loss was found in 7 patients, 5 with TOF-MRA and 6 with CE-MRA (Table 3 and Fig 4). In 22 readings, both readers diagnosed local signal loss; in 7 cases, only 1 reader diagnosed a flow void, whereas the other measured a residual lumen. In all patients, the residual lumen corresponded to high-grade stenosis (⬎70%) in the other reader’s results. Near occlusion was diagnosed in 1 patient by both readers. At least with 1 imaging technique, total occlusion was diagnosed in 5 patients.
In 1 of these patients, only TOF images suggested total occlusion, whereas CE images only showed local signal-inten-sity loss with a patent distal lumen, most likely due to smaller volume coverage in TOF-MRA. One observer reported signal-intensity loss for CE-MPR and CE-MIP, whereas the other measured high-grade stenosis. Both reported flow voids for CE volume-rendering, whereas TOF-MRA showed residual lumen in 1 patient. In another case, both observers reported
local signal loss in TOF-MRA and residual lumen with CE-MRA independent of the postprocessing technique used.
To avoid possible bias introduced by assigning a stenosis value in case of local signal loss or near occlusion, we recalcu-lated CIs after exclusion of cases in which at least 1 reader diagnosed 1 of these conditions (Table 2). This did not influ-ence the significance of the results.
Discussion
MRA is increasingly used for detection and grading of carotid artery stenosis. Many studies have been published comparing different imaging techniques,10but only a few have focused on the effect of postprocessing on stenosis measurement in ca-rotid artery stenosis.21-23CE-MRA of the carotid arteries may
be equivalent to 3D-TOF-MRA24,25 and perhaps even
DSA26-28in detecting severe ICA stenosis (⬎70%). Sensitivi-ties between 88% and 97% (CE-MRA) and 82% and 92% (TOF-MRA) and specificities between 89% and 96% (CE-MRA) and 76% and 97% (TOF-(CE-MRA) have been reported for detection of severe ICA stenosis in a recent meta-analysis.10
CE-MRA has been favored over 3D-TOF because of larger volume coverage and faster acquisition time resulting in fewer motion artifacts. Recent reports suggesting a link between nephrogenic systemic fibrosis and exposure to gadolinium-based contrast agents used at high doses11favor angiographic techniques that do not require gadolinium-based contrast agents, like 3D-TOF.
We compared 3 different postprocessing methods to assess their influence on stenosis measurement in vivo. Measure-ments were performed with a digital ruler on a 3D workstation instead of subjective visual impression as proposed by U-King-Im et al.29Excellent correlation between the readers supports this approach. Interpretation of targeted MIP images combined with source images may be considered the classic approach to evaluate MRA data. Because CE-MRA is usually performed in the coronal plane, stenosis evaluation may be more difficult on CE-MRA source images than on transverse TOF-MRA source images. Multiplanar reformation of MRA data can solve this problem by aligning the image plane per-pendicular to the ICA to optimize measurement of eccentric stenosis.30The disadvantages of MPR evaluation are the infe-rior 3D visualization of the vessels and higher time demand to adjust the image planes. Volume-rendering techniques opti-mally visualize vessels in 3 dimensions, but the parameter set-ting of the transfer function is critical for morphologic mea-surements.31If TOF-MRA and CE-MRA were postprocessed with the same method, no significant differences in stenosis values were found, though there was a trend toward lower stenosis values with TOF-MRA compared with CE-MRA when they were postprocessed with MPR and MIP. The high-est concordance was found for the comparison of TOF-MIP and TOF-MPR followed by TOF-MIP and CE-MIP. MRA postprocessed with volume-rendering resulted consistently in higher stenosis values compared with MIP or MPR postpro-cessing, though only the differences between CE volume-ren-dering and CE-MPR were statistically significant.
The phenomenon of local signal loss is related to a variety of effects (eg, spin-dephasing or partial volume effects, or choice of imaging parameters).12,32-34The smaller voxel size of 0.26 mm3in TOF-MRA versus 0.55 mm3in CE-MRA might
[image:4.594.53.285.41.300.2]Fig 3.Comparison of techniques by differences between stenosis values. Pairs of techniques that cross the zero line are not considered significantly different. ICA stenosis values differ significantly between CE-MPR and CE volume-rendering (VR).
Table 3: Number of cases with signal loss diagnosed by at least 1 reader
Technique Stenosis
TOF CE
MPR MIP VR MPR MIP VR
Signal loss 3 5 5 4 6 6
Near occlusion* 1 1 1 1 1 1
Occlusion* 5 5 5 4 4 4
Note:—VR indicates volume-rendering; TOF, time of flight; CE, contrast enhanced; MPR, multiplanar reformation; MIP, maximum intensity projection.
[image:4.594.56.288.371.430.2]account for the lower incidence of signal losses in TOF-MRA compared with CE-MRA. Image postprocessing and window-level setting may be critical factors that influence the frequency of local signal loss. We found conflicting results in 7 cases, in which 1 reader diagnosed local signal loss and the other reader still detected a measurable lumen. In each case, a high-grade stenosis (⬎70%) was diagnosed by the second observer.
Intravascular signal intensity may be better perceived with MPR than MIP in case of severe stenosis.35,36This difference could explain the higher incidence of flow voids in MIP studies compared with MPR studies. Volume-rendering studies were generated by using predefined settings as described previously. Sliding the trapezoid toward lower intensity values on the voxel histogram leads to visualization of structures with lower signal-intensity values and, thereby, increases the diameter of vessels. The definition of the trapezoid (its width, height, and position) strongly affects vascular lumen measurements.31To make individual results comparable, we used a preset for vol-ume-rendering but allowed readers slight adjustments to compensate for differences in signal-intensity between indi-vidual examinations. The higher number of flow voids com-pared with MPR studies in both acquisition techniques sug-gests that volume-rendering may be less sensitive to subtle vascular signals, at least with our parameter settings.
Better perceptibility of residual lumen has been reported for a combination of source and MIP images.37,38Comparison between MPR and MIP of 3D-TOF-MRA showed slightly higher stenosis values for MIP23but not at a significant level. De Marco et al21found no significant difference between MPR of 3D-TOF-MRA and DSA, whereas MIP overestimated the degree of stenosis. The tendency to overestimate the degree of stenosis can be reduced by the use of source images or MPRs.36 These results are concordant with our finding that MPR shows a trend toward lower degrees of stenosis for both 3D-TOF-MRA and CE-3D-TOF-MRA compared with MIP or volume-render-ing, with significantly lower stenosis values for comparison of CE-MPR and CE volume-rendering.
To our knowledge, only a small amount of data has been published examining volume-rendering in the measurement of extracranial ICA stenosis.31,39Mallouhi et al40reported that volume-rendering is superior in the detection of intracranial artery stenosis compared with MIP because MIP images exag-gerate the degree of stenosis. Our data do not support this finding, probably due to different volume-rendering presets.
The value of CE-MRA has been discussed controversially. CE-MRA provides a shorter examination time, leading to a reduction of motion artifacts, and has a larger volume cover-age. On the other hand, it has lower spatial resolution. With advances in MRA techniques, recent reports suggest that the diagnostic performance24and accuracy25,26of 3D-TOF-MRA and CE-MRA are comparable. This conclusion is in line with our findings that stenosis values between identical postproces-sing methods in different techniques did not differ significantly.
The absence of DSA as the standard of reference might be regarded as a limitation of our study. Our aim was to evaluate the concordance of different MRA techniques and the influ-ence of postprocessing. Therefore, we did not include other imaging techniques such as x-ray angiography to avoid bias introduced by the imaging technique itself.
In conclusion, our results indicate that the interobserver
agreement for stenosis measurement is very high regardless of the postprocessing method and acquisition technique used. Multiple comparisons between postprocessing methods and techniques show no significant differences except for CE-MPR versus CE-volume-rendering (P⬍.05), with CE volume-ren-dering resulting in higher stenosis values. Although not statis-tically significant, MPR shows the fewest cases of local signal-intensity loss and, therefore, seems to depict vessel lumen more exactly than calculated projections.
References
1. Rothwell PM, Eliasziw M, Gutnikov SA, et al.Analysis of pooled data from the randomised controlled trials of endarterectomy for symptomatic carotid ste-nosis.Lancet2003;361:107–16
2.Endarterectomy for asymptomatic carotid artery stenosis: Executive Com-mittee for the Asymptomatic Carotid Atherosclerosis Study. JAMA
1995;273:1421–28
3.Randomised trial of endarterectomy for recently symptomatic carotid stenosis: final results of the MRC European Carotid Surgery Trial (ECST).
Lancet1998;351:1379 – 87
4. Barnett HJ, Taylor DW, Eliasziw M, et al.Benefit of carotid endarterectomy in patients with symptomatic moderate or severe stenosis: North American Symptomatic Carotid Endarterectomy Trial Collaborators.N Engl J Med
1998;339:1415–25
5. Buskens E, Nederkoorn PJ, Buijs-Van Der Woude T, et al.Imaging of carotid arteries in symptomatic patients: cost-effectiveness of diagnostic strategies.
Radiology2004;233:101–12
6. Kent KC, Kuntz KM, Patel MR, et al.Perioperative imaging strategies for ca-rotid endarterectomy: an analysis of morbidity and cost-effectiveness in symptomatic patients.JAMA1995;274:888 –93
7. Willinsky RA, Taylor SM, TerBrugge K, et al.Neurologic complications of cerebral angiography: prospective analysis of 2,899 procedures and review of the literature.Radiology2003;227:522–28
8. Grzyska U, Freitag J, Zeumer H.Selective cerebral intraarterial DSA: compli-cation rate and control of risk factors.Neuroradiology1990;32:296 –99 9. Citron SJ, Wallace RC, Lewis CA, et al.Quality improvement guidelines for
adult diagnostic neuroangiography: cooperative study between ASITN, ASNR, and SIR.J Vasc Interv Radiol2003;14(9 pt 2):257– 62
10. Wardlaw JM, Chappell FM, Best JJ, et al.Non-invasive imaging compared with intra-arterial angiography in the diagnosis of symptomatic carotid stenosis: a meta-analysis.Lancet2006;367:1503–12
11. FDA.Gadolinium-based contrast agents for magnetic resonance imaging scans.Available at: http://www.ismrm.org/special/FDA%20gadolinium1206. pdf. Accessed September 13, 2007
12. Fellner C, Lang W, Janka R, et al.Magnetic resonance angiography of the carotid arteries using three different techniques: accuracy compared with in-traarterial x-ray angiography and endarterectomy specimens.J Magn Reson Imaging2005;21:424 –31
13. Patel SG, Collie DA, Wardlaw JM, et al.Outcome, observer reliability, and patient preferences if CTA, MRA, or Doppler ultrasound were used, individ-ually or together, instead of digital subtraction angiography before carotid endarterectomy.J Neurol Neurosurg Psychiatry2002;73:21–28
14. Fox AJ.How to measure carotid stenosis.Radiology1993;186:316 –18 15.North American Symptomatic Carotid Endarterectomy Trial: methods,
pa-tient characteristics, and progress.Stroke1991;22:711–20
16. Rothwell PM, Pendlebury ST, Wardlaw J, et al.Critical appraisal of the design and reporting of studies of imaging and measurement of carotid stenosis.
Stroke2000;31:1444 –50
17. Rothwell PM.Analysis of agreement between measurements of continuous variables: general principles and lessons from studies of imaging of carotid stenosis.J Neurol2000;247:825–34
18. Ha´jek J, Ida´k ZB, Sen PK.Theory of Rank Tests.London, UK: Academic Press; 1999 19. Ihaka R, Gentleman RR.A language for data analysis and graphics.Journal of
Computational and Graphical Statistics1996;5:299 –314
20. Bretz F, Hothorn T, Westfall P.On multiple comparisons in R.R News
2002;2:14 –17
21. De Marco JK, Nesbit GM, Wesbey GE, et al.Prospective evaluation of extracra-nial carotid stenosis: MR angiography with maximum-intensity projections and multiplanar reformation compared with conventional angiography.AJR Am J Roentgenol1994;163:1205–12
22. Lell M, Fellner C, Baum U, et al.Evaluation of carotid artery stenosis with multisection CT and MR imaging: influence of imaging modality and post-processing.AJNR Am J Neuroradiol2007;28:104 –10
23. Vanninen RL, Manninen HI, Partanen PK, et al.How should we estimate ca-rotid stenosis using magnetic resonance angiography? Neuroradiology
24. Anzalone N, Scomazzoni F, Castellano R, et al.Carotid artery stenosis: intra-individual correlations of 3D time-of-flight MR angiography, contrast-en-hanced MR angiography, conventional DSA, and rotational angiography for detection and grading.Radiology2005;236:204 –13
25. Muhs BE, Gagne P, Wagener J, et al.Gadolinium-enhanced versus time-of-flight magnetic resonance angiography: what is the benefit of contrast en-hancement in evaluating carotid stenosis?Ann Vasc Surg2005;19:823–28 26. Nederkoorn PJ, Elgersma OE, van der Graaf Y, et al.Carotid artery stenosis:
accuracy of contrast-enhanced MR angiography for diagnosis.Radiology
2003;228:677– 82
27. Alvarez-Linera J, Benito-Leon J, Escribano J, et al.Prospective evaluation of carotid artery stenosis: elliptic centric contrast-enhanced MR angiography and spiral CT angiography compared with digital subtraction angiography.
AJNR Am J Neuroradiol2003;24:1012–19
28. Patel MR, Kuntz KM, Klufas RA, et al.Preoperative assessment of the carotid bifurcation: can magnetic resonance angiography and duplex ultrasonogra-phy replace contrast arteriograultrasonogra-phy?Stroke1995;26:1753–58
29. U-King-Im JM, Graves MJ, Cross JJ, et al.Internal carotid artery stenosis: accuracy of subjective visual impression for evaluation with digital subtrac-tion angiography and contrast-enhanced MR angiography.Radiology2007; 244:213–22. Epub 2007 May 16
30. Bartlett ES, Walters TD, Symons SP, et al.Carotid stenosis index revisited with direct CT angiography measurement of carotid arteries to quantify carotid stenosis.Stroke2007;38:286 –91
31. Lell MM, Anders K, Uder M, et al.New techniques in CT angiography. Radio-graphics2006;26(suppl 1):45– 62
32. Lev MH, Romero JM, Gonzalez RG.Flow voids in time-of-flight MR angiog-raphy of carotid artery stenosis? It depends on the TE!AJNR Am J Neuroradiol
2003;24:2120
33. Heiserman JE.Flow voids and carotid MR angiography.AJNR Am J Neurora-diol2003;24:1727, author reply 1727
34. Nederkoorn PJ, van der Graaf Y, Eikelboom BC, et al.Time-of-flight MR an-giography of carotid artery stenosis: does a flow void represent severe steno-sis?AJNR Am J Neuroradiol2002;23:1779 – 84
35. Anderson CM, Saloner D, Tsuruda JS, et al.Artifacts in maximum-intensity-projection display of MR angiograms.AJR Am J Roentgenol1990;154:623–29 36. Yucel EK, Anderson CM, Edelman RR, et al.AHA scientific statement:
mag-netic resonance angiography— update on applications for extracranial arter-ies.Circulation1999;100:2284 –301
37. Anderson CM, Lee RE, Levin DL, et al.Measurement of internal carotid artery stenosis from source MR angiograms.Radiology1994;193:219 –26 38. Korogi Y, Takahashi M, Nakagawa T, et al.Intracranial vascular stenosis and
occlusion: MR angiographic findings.AJNR Am J Neuroradiol1997;18:135– 43 39. Saba L, Caddeo G, Sanfilippo R, et al.Efficacy and sensitivity of axial scans and different reconstruction methods in the study of the ulcerated carotid plaque using multidetector-row CT angiography: comparison with surgical results.
AJNR Am J Neuroradiol2007;28:716 –23
40. Mallouhi A, Chemelli A, Judmaier W, et al.Investigation of cerebrovascular disease with MR angiography: comparison of volume rendering and maxi-mum intensity projection algorithms—initial assessment.Neuroradiology