METHOD DEVELOPMENT AND VALIDATION FOR THE
DETERMINATION OF RELATED SUBSTANCES IN
TERIFLUNOMIDE BY RP-HPLC METHOD
Sushma G., Sridevi Pingali*, Bhagavan Raju M. and Vinutha K. Shaik Ashfaque
Sri Venkateshwara College of Pharmacy, Madhapur, Osmania University,
Hyderabad-500081, Telangana, India.
ABSTRACT
A Reverse Phase High Performance Liquid Chromatographic Method
(RP-HPLC) was developed and validated for the determination of
related substances in Teriflunomide. The method was carried out using
Zorbax SB Phenyl, 150 x 4.6 mm, 3.5µmwith mobile phase-A and
mobile phase-B, where mobile phase-A consisted of potassium
dihydrogen phosphate buffer and mobile phase-B consisted of
Acetonitrile in the ratio 60:40 (v/v) under gradient mode with an
injection volume of 10µL at flow rate of 1mL/min and the detection
was carried out at 209 nm. The retention time of Teriflunomide and its
related substance (RS) method were found to be 11.797min and
23.588min. This method produced linear responses for Teriflunomide
and its related substances in the concentration range of 0.012-0.304% with a correlation
coefficient of 0.999 and 0.999. The proposed method was validated as per ICH guidelines.
The method was found to be linear, specific, precise and accurate. Therefore, the proposed
method can be used for the routine analysis of drug in the process control of bulk and
pharmaceutical formulation.
KEYWORDS: RP-HPLC, Teriflunomide, Validation, related substances, pharmaceutical formulation.
INTRODUCTION
Immuno modulatory drugs modify the response of the immune system by increasing
(immunostimulators) or decreasing (immunosuppressives) the production of serum
antibodies.
Volume 8, Issue 12, 882-891. Research Article ISSN 2277– 7105
Article Received on 05 Sept. 2019,
Revised on 26 Sept. 2019, Accepted on 16 Oct. 2019
DOI: 10.20959/wjpr201912-16009
*Corresponding Author
Dr. Sridevi Pingali
Sri Venkateshwara College
of Pharmacy, Madhapur,
Osmania University,
Hyderabad-500081,
Teriflunomide: Teriflunomide is the active metabolite of Leflunomide, and it acts as an immunomodulatory agent/ immunosuppressive agent by inhibiting pyrimidine synthesis.
Figure. 1: Chemical Structure of Teriflunomide.
Mechanism of action: The exact mechanism by which Teriflunomide acts in MS is not known. What is known is that Teriflunomide prevents pyrimidine synthesis by inhibiting the
itochondrial enzyme dihydroorotate dehydrogenase, and this may be involved in its
immunomodulatory effect in MS.
Adverse Effects: Most common adverse reactions (≥10% and ≥2% greater than placebo): ALT increased, alopecia, diarrhoea, influenza, nausea, paresthesia and warning for
Hepatotoxicity, risk of Teratogenicity and Hepatotoxicity severe liver injury including fatal
liver failure has been reported in patients treated with Leflunomide, which is indicated for
rheumatoid arthritis.
MATERIALS AND METHODS
Chemicals: Teriflunomide API, Potassium Dihydrogen Phosphate, Tri Ethyl Amine, Ortho
Phosphoric Acid, Acetonitrile, Water.
Instruments
UV-Vis Spectrophotometer, HPLC, Analytical balance, Ultrasonic bath, Vacuum Filter, pH
meter, Milli-Q Water System.
Preparation of reference stock solution: Weigh accurately 3.0 mg of H-TFMRC01 and 2.0 mg
of TFM reference standards into a 100 mL volumetric flask, dissolve and dilute to the volume
with diluent and mix.
EXPERIMENTAL
Determination of Wavelength: The sensitivity of the HPLC method which uses UV detection depends upon the proper selection of wavelength. An ideal wavelength is one that
gives good response for all the drugs to be detected.
Procedure: 10mg of Teriflunomide working standard was weighed accurately and transfered to a clean dry 100ml volumetric flask. Sufficient volume of diluent is added, sonicated to
dissolve and volume is made up with diluent to get concentration (100µg/ml). From this 1mL
is pipetted out and make up to 10mL to get concentration (10µg/ml).
UV spectrum of Teriflunomide (10µg/ml) in diluents was recorded by scanning in the range
of 200nm to 400nm. From the UV spectrum wavelength selected as 209nm. At this
wavelength the Teriflunomide and related impurities shows good absorbance.
Selection of Chromatographic Methods: The proper selection of method depends upon the nature of the sample (ionic or ionisable or neutral molecule), its molecular weight and
stability. The drugs which were selected are polar and ionic in nature. Hence HPLC was
selected for separation because of its simplicity and suitability.
Selection of Mobile Phase: Initially the mobile phase tried was potassium dihydrogen phosphate buffer: methanol and Sodium perchlorate monohydrate buffer: acetonitrile+buffer
with various proportions. Finally, the mobile phase was optimized to potassium dihydrogen
phosphate buffer: acetonitrile+buffer with various proportions in gradient mode.
Selection of Column: The method was performed with various columns like Zorbax SB Phenyl, 150 x 4.6 mm, 3.5µm was found to be ideal as it gave good peak shape and
resolution at 1mL/min flow.
Method development
The RP-HPLC method for determination of related substances in Teriflunomide has been
developed and evaluated. The RP-HPLC method was tested for linearity, specificity,
accuracy, precision finally optimized RP-HPLC conditions used for the present studies are:
detection wavelength-209 nm, mobile phase Potassium dihydrogen phosphate:
acetonitrile+buffer, flow rate 1ml/min, run time 55 minutes, column temperature 45°C,
RESULTS AND DISCUSSION
Fig 1: Teriflunomide UV-vis spectrum.
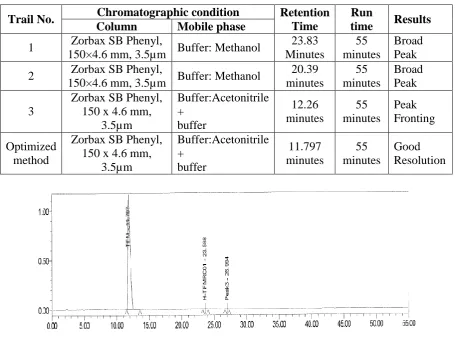
Table 1: Chromatogram Data for Method Development.
Trail No. Chromatographic condition Retention Time
Run
time Results Column Mobile phase
1 Zorbax SB Phenyl,
150×4.6 mm, 3.5µm Buffer: Methanol
23.83 Minutes 55 minutes Broad Peak
2 Zorbax SB Phenyl,
150×4.6 mm, 3.5µm Buffer: Methanol
20.39 minutes 55 minutes Broad Peak 3
Zorbax SB Phenyl, 150 x 4.6 mm,
3.5µm Buffer:Acetonitrile + buffer 12.26 minutes 55 minutes Peak Fronting Optimized method
Zorbax SB Phenyl, 150 x 4.6 mm,
3.5µm Buffer:Acetonitrile + buffer 11.797 minutes 55 minutes Good Resolution
Fig. 2: Chromatogram of Optimized Method.
Method validation
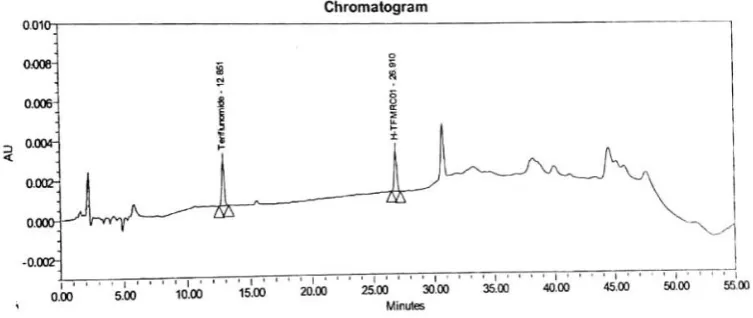
Specificity: H-TFMRC01 solution and Teriflunomide standard solutions were prepared individually at target concentration of the test sample. A solution of all known impurities
[image:4.595.71.527.320.658.2]solutions were analyzed using the PDA detector as per the HPLC method. No interference is
observed due to blank at the retention time of HTFMRC01 and Teriflunomide. So this
[image:5.595.116.481.154.306.2]method was found to be specific.
Fig. 3: Chromatogram of Sample Teriflunomide.
PRECISION
System Precision: System precision was performed by injecting six replicates of 10µL reference solution of Teriflunomide, H-TFMRC01 and measured the area for all six injections
in HPLC. The %RSD for the peak area of each component from six replicate injections of
reference solution was within the limit.
Fig. 4: Chromatogram of system precision.
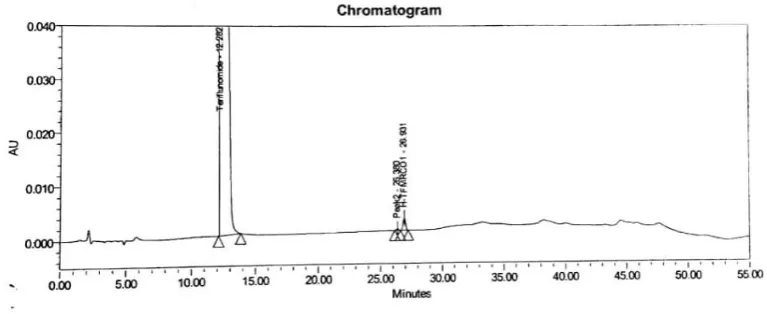
Method Precision: Teriflunomide test sample spiked with H-TFMRC01 at specification level with respect to the test sample concentration for six times and analyzed for the precision
study as per the procedure. The %RSD from the content of Teriflunomide of six replicate
[image:5.595.108.485.480.639.2]obtained from method precision study were in the range of 1.40 to 3.57. So this method was
[image:6.595.108.488.134.286.2]found to be precised.
Fig 5: Chromatogram of Method Precision.
Accuracy: Accuracy of the method was proved by checking the % recovery of H-TFMRC01 in test solution spiked with H-TFMRC01 at 50%, 100%, and 150% level. Each level solution was
prepared in triplicate and % recoveries of H-TFMRC01 were reported. The % recovery obtained
from 50% to 150% level was in the range of 106.7 to 113.3 for H-TFMRC01.
Fig 6: Chromatogram of accuracy.
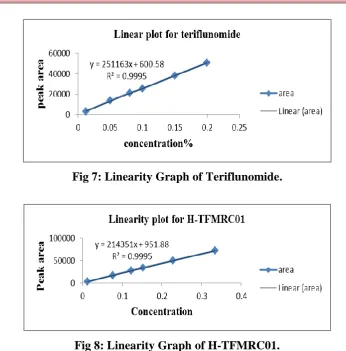
Linearity: The linearity study was conducted for H-TFMRC01and Teriflunomide standard in the range of QL level to 200% level. Correlation coefficient values for H-TFMRC01 and
TFM standard were derived from respective linearity graph. Teriflunomide and H-TFMRC01
was found to be linear over the concentration range of 0.012-0.200µg/ml. Correlation
coefficient value for calibration plot of Teriflunomide and H-TFMRC01 was found to be
[image:6.595.105.489.432.589.2]Fig 7: Linearity Graph of Teriflunomide.
Fig 8: Linearity Graph of H-TFMRC01.
Range: Established range for each component and proved that the method was precise and linear over the range. The % RSD obtained for all the components were in the range of 1.63
to 5.61 for lower and upper levels.
Limit of Detection: The detection limit (DL) is defined as the lowest concentration of an analyte in sample that can be detected, but not necessarily quantitated. The detection limit
was determined as the lowest concentration for which the response is approximately three
times greater than the baseline noise. The signal to noise ratio of each component was within
the limit. 0.004% for H-TFMRC01 and 0.004% for Teriflunomide.
Limit of Quantification: Quantification Limit of each component was established as per the procedure mentioned in the protocol. The QL solution was prepared based on the DL solution
and obtained the signal to noise ratio about 10:1 for each component. The signal to noise ratio
of each component was within the limit. 0.012% for H-TFMRC01 and 0.012% for
CONCLUSION
Reversed Phase High Performance Liquid Chromatographic method has been optimized and
developed for the determination of Teriflunomide and quantification of related substances in
API. The optimized chromatographic conditions for the determination of Teriflunomide using
waters HPLC 2695 system and schimadzu HPLC LC2010 CHT auto sampler, Zorbax SB
Phenyl, 150 x 4.6 mm, 3.5µm,in gradient mode using mobile phase containing Potassium
dihydrogen phosphate: acetonitrile and buffer. The flow rate maintained was 1ml/min at
column temperature of 45°C with PDA detection at 209nm and run time of 55min. The
retention time of Teriflunomide and its related substances was found to be 11.797 min &
23.588. The linearity for Teriflunomide and its related substances was obtained in the
concentration range of 0.012-0.304 with correlation coefficient 0.999 & 0.999. The methods
were validated for various parameters as per ICH guidelines and all the results obtained were
within the limits. Impurities (RS) present in the formulation were well separated, reported
and quantified. The developed method was found to be linear, specific and precise and
therefore, the proposed method can be used for routine analysis of drug in the process control
of bulk and pharmaceutical formulations.
ACKNOWLEDGEMENT
In the first place I would like to express my profound gratitude and deep regards to my
esteemed guide, Dr. P. SRIDEVI, Associate professor, SVCP, Madhapur, Hyderabad. We are very much thankful to the principal, management of Sri Venkateshwara College of Pharmacy,
Hyderabad, for giving permission to carry out my work.
REFERENCES
1. Ahuja S, Alsante K. Handbook of isolation and characterization of impurities in
pharmaceuticals‘ Separation Science and Technology, 2003; 3: 346.
2. Ahuja S, Scypinski S. Handbook of modern pharmaceutical analysis‘, Separation Science
and Technology, 2001; 2: 568.
3. Ahuja S, Impurities Evaluation of Pharmaceuticals, Marcel Dekker, New York, 1998;
142.
4. Analytical procedure and method validation: Highlights of the FDA Draft Guidance,
5. ANDAs: Impurities in Drug Products, Guidance for Industry, US Food and Drug
Administration, Center for Drug Evaluation and Research, Department of Health and
Human Services, 2008.
6. Aziz-Filali-Ansary-Original Article Dried Blood Spot Methodology In Combination With
Liquid Chromatography/Tandem Mass Spectrometry Facilitates The Monitoring Of
Teriflunomide. Ther Drug Monit, August 2016; 38(4)38: 457-482.
7. Bhavya Mehta, PravinPrajapat and Yatin Gohil. Development and validation of stability
indicating RP-HPLC method for estimation of Teriflunomide in active pharmaceutical
ingredients. The Pharma Innovation Journal, 2017; 6(9): 440-449.
8. CDER Reviewer Guidance, Validation of Chromatographic methods, November, 1994.
9. Cunnif P, Official Methods of Analysis of AOAC International, 16th edition Vol. 1.
AOAC International, Arlington, 1995.
10.European pharmacopoeia, 2014; 2: 1596-1598.
11.European Pharmacopoeia, 7th edition, 2010 and Supplements 2011, Council of Europe,
Strasbourg, 2011.
12.Gilpin, R.K, Pharmaceutical and drugs. Encyclopedia of Analytical Chemistry 8, Wiley,
Chichester, 2000.
13.Center for Drugs and Biologics, Department of Health and Human Services, 1987.
14.ICH Q2A, Validation of Analytical Procedures: Definitions and Terminology, Geneva,
1995, in 2005 incorporated in Q2 (R1).
15.ICH Q2B, Validation of Analytical Procedures: Methodology, adopted in 1996, Geneva
Q2B, in 2005 incorporated in Q2 (R1).
16.ICH Triplicate Guideline Q3 (R2), Validation of analytical procedures: Text and
Methodology, November 2005.
17.International Conference on Harmonization Impurities Guidelines for Residual Solvents,
Federal Register Q3C, 1997; 62(247): 67377.
18.International Conference on Harmonization, Draft Guideline on Validation of Analytical
Procedures, Definitions and Terminology, Federal Register, 1995; 26: 11260.
19.Lloyd R, Snyder, Joseph J, Kirkland, Joseph L, Glajesh. Practical HPLC method
development.2nd edition, 1997; 1-14.
20.Nukendra Prasad Nadella- Quality –by-design based on development and validation of a
stability-indicating UPLC method for quantification of Teriflunamide in the presence of
degradation products and its application to in-vitro dissolution, journal of liquid
21.Sharma, B.K. Instrumutal Methods of Chemicals Analysis. 13th edition., Goel Publisher
House, Meerut, 1994; 7.
22.Suneetha. A and raja rajeshwari, Estimation of Teriflunomide along with concomitant
drugs in different biological matrices using Lc-ms/ms. International journal