IBBERSON, Richard M., PARSONS, Simon, ALLAN, David R. and BELL,
Anthony M. T.
Available from Sheffield Hallam University Research Archive (SHURA) at:
http://shura.shu.ac.uk/12775/
This document is the author deposited version. You are advised to consult the
publisher's version if you wish to cite from it.
Published version
IBBERSON, Richard M., PARSONS, Simon, ALLAN, David R. and BELL, Anthony M.
T. (2008). Polymorphism in cyclohexanol. Acta Crystallographica Section B, 64 (5),
573-582.
Copyright and re-use policy
See
http://shura.shu.ac.uk/information.html
Acta Crystallographica Section B
Structural Science
ISSN 0108-7681
Editor:Carolyn P. Brock
Polymorphism in cyclohexanol
Richard M. Ibberson, Simon Parsons, David R. Allan and Anthony M. T.
Bell
Acta Cryst.
(2008). B
64
, 573–582
Copyright cInternational Union of Crystallography
Author(s) of this paper may load this reprint on their own web site or institutional repository provided that this cover page is retained. Republication of this article or its storage in electronic databases other than as specified above is not permitted without prior permission in writing from the IUCr.
For further information seehttp://journals.iucr.org/services/authorrights.html
Acta Crystallographica Section B: Structural Science publishes papers in structural chem-istry and solid-state physics in which structure is the primary focus of the work reported. The central themes are the acquisition of structural knowledge from novel experimental observations or from existing data, the correlation of structural knowledge with physico-chemical and other properties, and the application of this knowledge to solve problems in the structural domain. The journal covers metals and alloys, inorganics and minerals, metal-organics and purely organic compounds.
Acta Cryst.(2008). B64, 573–582 doi:10.1107/S0108768108025093
573
Acta Crystallographica Section B
Structural Science
ISSN 0108-7681
Polymorphism in cyclohexanol
Richard M. Ibberson,a* Simon Parsons,bDavid R. Allanb‡ and Anthony M. T. Bellc
aISIS Facility, STFC Rutherford Appleton
Laboratory, Harwell Science and Innovation Campus, Didcot OX11 0QX, England,bSchool of Chemistry, The University of Edinburgh, King’s Buildings, West Mains Road, Edinburgh EH9 3JJ, Scotland, andcSynchrotron Radiation Source, STFC Daresbury Laboratory, Daresbury Science and Innovation Campus, Warrington WA4 4AD, England
‡ Current address: Diamond Light Source, Harwell Science and Innovation Campus, Didcot OX11 0QX, England.
Correspondence e-mail: [email protected]
#2008 International Union of Crystallography Printed in Singapore – all rights reserved
The crystal structures and phase behaviour of phase II and the metastable phases III0 and III of cyclohexanol, C6H11OH,
have been determined using high-resolution neutron powder, synchrotron X-ray powder and single-crystal X-ray diffraction techniques. Cyclohexanol-II is formed by a transition from the plastic phase I cubic structure at 265 K and crystallizes in a tetragonal structure, space groupP442 1c(Z0= 1), in which the
molecules are arranged in a hydrogen-bonded tetrameric ring motif. The structures of phases III0 and III are monoclinic, space groupsP21/c(Z0= 3) andPc(Z0= 2), respectively, and
are characterized by the formation of hydrogen-bonded molecular chains with a threefold-helical and wave-like nature, respectively. Phase III crystallizes at 195 K from a sample of phase I that is supercooled to ca 100 K. Alternatively, phase III may be grown via phase III0, the latter transforming from supercooled phase I at ca 200 K. Phase III0 is particularly unstable and is metastable with respect to both I and II. Its growth is realised only under very restricted conditions, thus making its characterization espe-cially challenging. The cyclohexanol molecules adopt a chair conformation in all three phases with the hydroxyl groups in an equatorial orientation. No evidence was found indicating hydroxyl groups adopting an axial orientation, contrary to the majority of spectroscopic literature on solid-state cyclohex-anol; however, the H atom of the equatorial OH groups is found to adopt both in-plane and out-of-plane orientations.
Received 30 January 2008 Accepted 4 August 2008
1. Introduction
The phase behaviour of cyclohexanol, C6H11OH, has been
There is an extensive literature on the polymorphism of cyclohexanol, dating back to the work of Kelley (1929) and the early development of the methodology of calorimetry. Kelley’s initial observation of two crystalline phases (I and II) in cyclohexanol was developed further by the pioneering work of Adachiet al.(1968) who demonstrated a surprisingly complex polymorphic behaviour for such a simple cyclic molecule. Cyclohexanol has a melting point of 298 K and crystallizes in a plastic, orientationally disordered phase I. This phase can be readily supercooled and Adachi et al. (1968) inferred from their calorimetric data, through exceptionally detailed studies, that phase I retains a significant amount, 4.72 J mol1K1, of residual entropy at 0 K. At around 148 K there is an anom-alous increase in the heat capacity as the temperature rises. This observation of relaxation phenomena associated with the onset of molecular re-orientation that is frozen-in at low temperature led Adachi and co-workers to characterize cyclohexanol as a model ‘glassy crystal’ (Ig). There are now
numerous examples in the literature of this behaviour, espe-cially in the case of molecules that exhibit pseudo-spherical cage or monocyclic ring structures. Adachiet al.also reported on the low-temperature phase II of cyclohexanol and found a metastable phase III which, like phase II, possesses zero residual entropy at 0 K.
The phase diagram of cyclohexanol is now well established following experiments using the techniques of calorimetry and DTA (Kelley, 1929; Adachiet al., 1968; Hartmannet al., 1992; Mayer et al., 1990; Oˆ tsubo & Sugawara, 1955), Raman spec-troscopy (James et al., 1976; S´ciesin´ska & S´ciesin´ski, 1979; Wasiutyn´skiet al., 2001), thermal conductivity (Anderssonet al., 1989), inelastic neutron spectroscopy (S´ciesin´ska et al., 1989), dielectric permittivity (Adachi et al., 1972; Green & Griffith, 1965, 1969b), and observations of crystal growth rate and morphology (Green & Griffith, 1969a). Phase I is stable between 265 K and the melting point and, as noted earlier, is readily supercooled through a glass transition around 148 K. Phase II is the thermodynamically stable phase below 265 K. Metastable phase III is formed by quenching phase I down to a temperature of 100 K and then heating to around 195 K. Depending on its thermal treatment, phase III shows the III–I transition at 245 K or transforms irreversibly to phase II after
heating to between 220 and 240 K. Phase III can also be grown
via an intermediate fourth phase, which is metastable with respect to both I and II, from the supercooled phase I at around 200 K. This fourth phase has been designated variously as MS (Mayer et al., 1990; S´ciesin´ska & S´ciesin´ski, 1979), pre-II (Green & Griffith, 1969b) – in this case the authors designated the stable form as III – pre-III (Oˆ tsubo & Sugawara, 1955) and III0 (Adachi et al., 1972). Here, this second metastable phase is referred to as III0to conform to the scheme of Adachiet al.(1968, 1972). The kinetics of the I–III0 and III0–III transition are found to be highly dependent on both the cooling rate and the temperature at which the cooling of phase I is stopped (Mayer et al., 1990; Wasiutyn´ski et al., 2001). Growth of phase III0 is realised only under very restricted conditions and is reported to be invariably contaminated by an accompanying growth of phase III (S´ciesin´ska & S´ciesin´ski, 1979).
Crystal structure information on the various phases of cyclohexanol is extremely limited and this is the motivation for the present studies. Single-crystal X-ray diffraction data have been collected for the plastic phase I and glassy phase Ig, and a face-centred cubic structure for phase I, space groupFm33m, with a lattice parameter of 8.809 A˚ at 275 K is reported (Andre´et al., 1984; Ceccaldi, 1985). The structure is modelled using molecules disordered over 48 equi-probable orientations at each site and adopting both equatorial and axial conformers in equal proportion. More recently, neutron powder diffrac-tion measurements (S´ciesin´skaet al., 1989) indicate a primitive space group,Pa33, for cyclohexanol-I and suggest a monoclinic unit cell for phase II and an orthorhombic cell for phase III. The lattice parameters at 80 K for phase II were reported to be:a= 12.64 (2),b= 17.87 (5),c= 8.51 (2) A˚ ,= 138.90 (4), andV= 1265 (9) A˚3. The lattice parameters at 5 K for phase III are: a = 8.41 (1), b= 18.48 (7), c = 7.56 (1) A˚ , and V = 1176 (6) A˚3. No atomic coordinates were determined in these most recent studies (S´ciesin´skaet al., 1989).
In this article, full crystal structure determinations of phases II, III and III0 are reported, which have been obtained using powder neutron and powder X-ray techniques in combination with synchrotron X-ray single-crystal techniques, and reveal a variety of both hydrogen-bonded structural motifs and isomers in the cyclohexanol phase diagram at ambient pres-sure.
2. Experimental
Cyclohexanol, C6H11OH, is a colourless viscous liquid at
ambient temperature with a melting point of 298 K. Samples of normal (99+%) and perdeuterocyclohexanol, C6D11OD
(99+%), were obtained from Sigma–Aldrich for the X-ray and neutron diffraction studies, respectively.
2.1. Neutron powder diffraction measurements
sample of perdeuterocyclohexanol was frozen and ground by hand using a stainless steel mortar and pestle cooled using liquid nitrogen. The resulting fine powder was sealed in an 11 mm diameter vanadium sample can and loaded in a vana-dium-tailed ‘orange’ cryostat at 100 K and cooled to 2 K. The highest-resolution data were recorded at backscattering,
h2i = 168, over a time-of-flight range of between 30 and 130 ms, corresponding to ad-spacing range of between 0.6 and 2.6 A˚ . Under these experimental settings the instrumental resolution,d/d, is approximately constant and equal to 8 104. Low-order reflections were measured using a time-of-flight range of between 100 and 200 ms, corresponding to ad -spacing range of between 2.0 and 4.0 A˚ at backscattering. Detector banks at 90 and 30 enable reflections to be measured out to some 5.7 and 15 A˚ , respectively, albeit at a lower resolution, for the purposes of unit-cell indexing. A standard data reduction procedure was followed: the data were normalized to the incident beam monitor profile and corrected for detector efficiency effects using a previously recorded vanadium spectrum.
Data recorded initially at 2 K were not readily indexed, suggesting the sample was multiphase. Accordingly, the sample was heated in a stepwise manner up to 250 K and at around 210 K a series of diffraction peaks (corresponding to phase III) disappeared yielding a sample that comprised phase II only. Data were recorded on this sample as a function of temperature down to 2 K and subsequently between 250 and 268 K in phase I. Attempts to produce a predominantly phase III sample through quenching/annealing phase I material in the cryostat were unsuccessful. A single-phase sample in phase III was finally produced by quenching a liquid sample in liquid nitrogen before loading in the cryostat atca100 K and then annealing at 195 K.
2.1.1. Structure solution and refinement. Indexing of the powder diffraction profiles, structure solution, and Pawley and Rietveld refinements were carried out using TOPAS-Academic(Coehlo, 2008).
The structure of phase II at 2 K was indexed (Coelho, 2003) on a tetragonal unit cell, a= 10.5351 (2),c= 10.5372 (1) and
V = 1169.49 (1) A˚3, in the space group P442 1c.
[image:5.610.50.565.95.476.2]Variable-Acta Cryst.(2008). B64, 573–582 Richard M. Ibbersonet al. Polymorphism in cyclohexanol
575
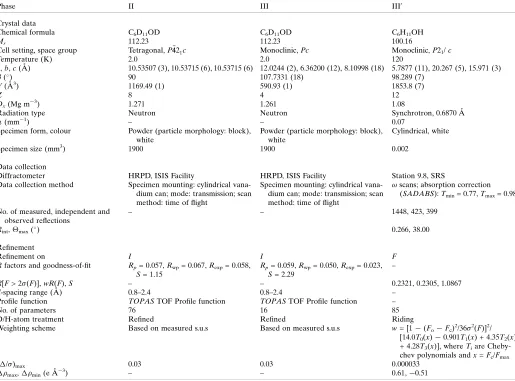
Table 1
Experimental details.
Phase II III III0
Crystal data
Chemical formula C6D11OD C6D11OD C6H11OH
Mr 112.23 112.23 100.16
Cell setting, space group Tetragonal,P4421c Monoclinic,Pc Monoclinic,P21/c
Temperature (K) 2.0 2.0 120
a,b,c(A˚ ) 10.53507 (3), 10.53715 (6), 10.53715 (6) 12.0244 (2), 6.36200 (12), 8.10998 (18) 5.7877 (11), 20.267 (5), 15.971 (3)
() 90 107.7331 (18) 98.289 (7)
V(A˚3) 1169.49 (1) 590.93 (1) 1853.8 (7)
Z 8 4 12
Dx(Mg m3) 1.271 1.261 1.08
Radiation type Neutron Neutron Synchrotron, 0.6870 A˚
(mm1) – – 0.07
Specimen form, colour Powder (particle morphology: block), white
Powder (particle morphology: block), white
Cylindrical, white
Specimen size (mm3) 1900 1900 0.002
Data collection
Diffractometer HRPD, ISIS Facility HRPD, ISIS Facility Station 9.8, SRS
Data collection method Specimen mounting: cylindrical vana-dium can; mode: transmission; scan method: time of flight
Specimen mounting: cylindrical vana-dium can; mode: transmission; scan method: time of flight
!scans; absorption correction (SADABS):Tmin= 0.77,Tmax= 0.98
No. of measured, independent and observed reflections
– – 1448, 423, 399
Rint,max() 0.266, 38.00
Refinement
Refinement on I I F
Rfactors and goodness-of-fit Rp= 0.057,Rwp= 0.067,Rexp= 0.058,
S= 1.15
Rp= 0.059,Rwp= 0.050,Rexp= 0.023,
S= 2.29
–
R[F> 2(F)],wR(F),S – – 0.2321, 0.2305, 1.0867
d-spacing range (A˚ ) 0.8–2.4 0.8–2.4 –
Profile function TOPASTOF Profile function TOPASTOF Profile function –
No. of parameters 76 16 85
D/H-atom treatment Refined Refined Riding
Weighting scheme Based on measured s.u.s Based on measured s.u.s w= [1(FoFc)2/362(F)]2/
[14.0T0(x)0.901T1(x) + 4.35T2(x)
+ 4.28T3(x)], whereTiare Cheby-chev polynomials andx=Fc/Fmax
(/)max 0.03 0.03 0.000033
temperature measurements on the phase-II structure show that the pseudo-cubic metric symmetry at 2 K is accidental. The unit-cell volume impliesZ0= 1. The structure was solved by simulated annealing, with the cyclohexanol molecule described in the equatorial-in eq(60) conformation (I) and defined as a rigid group using theZ-matrix formalism imple-mented in TOPAS. The structure was then refined freely without the use of bond length or angle constraints, but with common isotropic displacement parameters for C atoms and
non-hydroxyl group D atoms. Refinement details are given in Table 11and the final Rietveld fit is shown in Fig. 1.
The powder diffraction patterns recorded in phase III were substantially line-broadened in comparison with the phase-II data, most likely due to the develop-ment of strain in the sample which is inherent in the preparation route required to produce this phase. At 2 K the structure was indexed on a monoclinic cell a = 12.0244 (2), b = 6.3620 (1), c = 8.1100 (1) A˚ ,= 107.733 (2)and
V= 590.93 (1) A˚3, implyingZ0= 1 orZ0= 2 for centrosymmetric and non-centrosymmetric space groups, respectively. Structure solution was attempted in the space groupsP21/c, P2/c, P21and Pc, the latter resulting in a struc-ture containing plausible inter-molecular hydrogen bonds. For each molecule comprising the asymmetric unit, the cyclohexane ring geometry was defined using theZ-matrix formalism. The C—C and C—D distances were constrained to 1.525 and 1.09 A˚ , respectively, but the torsion angles were allowed to refine. Atomic coordinates associated with each hydroxyl group were freely refined. Common isotropic displacement parameters were refined for C atoms, the non-hydroxyl group D atoms and the hydroxyl-group O and D atoms on each molecule. Refinement details are given in Table 1 and the final Rietveld fit is shown in Fig. 2. The final structure has molecules of conformational forms (I) and (II) in the asymmetric unit. The space-group symmetry of this structure was checked using ADDSYM
(Spek, 2004) confirming the choice of space group.
[image:6.610.50.405.73.295.2]Neutron powder diffraction data recorded from cyclohex-anol-I at temperatures around 250 K yielded no peaks at backscattering and only the (200) and (111) reflections, at d -spacings of 4.388 and 5.067 A˚ , respectively, were observed in
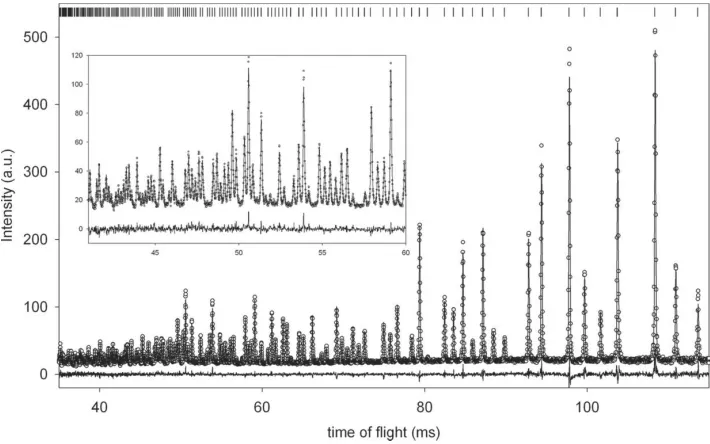
Figure 2
The final NPD Rietveld plot of cyclohexanol phase III at 2 K.
Figure 1
The final NPD Rietveld plot of cyclohexanol phase II at 2 K, showing observed (o), calculated (line) and difference (lower) profiles. Vertical bar markers indicate calculated Bragg peak positions. The equivalent
d-spacing range corresponds to 0.7–2.4 A˚ (inset 0.8–1.42 A˚).
1Supplementary data for this paper are available from the IUCr electronic
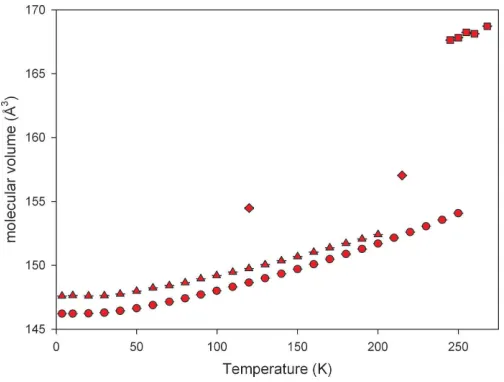
[image:6.610.49.407.358.584.2]the low-angle (30) detector array. These observations are consistent with the known face-centred cubic structure, a= 8.776 A˚ , in which the molecules are orientationally disor-dered. Molecular volumes as a function of temperature for cyclohexanol-I, -II and -III are shown in Fig. 3.
2.2. X-ray single-crystal measurements
The sample was prepared by loading liquid into a 0.2 mm sealed glass capillary under vacuum. The capillary was then attached to a goniometer head which was subsequently mounted onto the Bruker APEX CCD diffractometer of Station 9.8 at SRS, Daresbury Laboratory ( = 0.6870 A˚ ). The sample was then initially cooled to 270 K, just below the freezing point, using an open-flow cryostream device from Oxford Cryosystems, until a number of crystallites could be observed. A sample crystal of phase I was eventually obtained by cycling the temperature, with the use of a hand-held hot-air gun, and selectively re-melting the mass of crystallites until only a single crystal remained, which eventually filled the region of the capillary cooled by the cold nitrogen gas flow. An initial short data collection confirmed that reflections from the crystal could be indexed on the known cubic phase I unit cell [a= 8.76 (7) A˚ ].
The crystal was then cooled slowly, while recording diffraction images at regular intervals, until an obvious change in the appearance of the diffraction pattern had occurred. A marked transition was found at 120 K where the recorded diffraction images indicated that the crystal had transformed into a coarse powder. The presence of high-angle, and isolated, reflections suggested that a small number of rela-tively large crystallites were present in the sample and a data collection was initiated anticipating that the unit cell of one of these larger crystals could be obtained at the very least. The diffractometer was set up to perform!scans in steps of 0.3 from!= 0to90, with’= 0, 2= 0and a detector distance
of 55 mm (on this three-circle diffractometer is fixed at 54.736). Only this first run of the planned data collection could be completed as the sample progressively transformed,
viaa pulverizing first-order transition, into a second ordered phase with no residual large crystallites.
All of the image frames from the limited set of data that had been obtained were used for indexing. Reflections (spots) were harvested from the sequence of image frames and their locations within reciprocal space were placed within a three-dimensional map. This map was interrogated graphically using the RLATT reciprocal lattice display program (Bruker, 2006a). It was apparent that one large crystallite dominated and its reciprocal lattice could be isolated readily. Indexing from this subset of reflections produced a monoclinic unit cell. The data were integrated using the programSAINT(Bruker, 2006b) and absorption corrections were carried out with the programs SADABS (Sheldrick, 2001), while merging was carried out inSORTAV(Blessing, 1997) with robust-resistant weights. The optimized unit-cell parameters obtained from the integration are shown in Table 1. The unit-cell volume and space group implyZ0= 3. The structure was solved by direct methods using the programSIR92 (Altomareet al., 1994); the structure was then completed in iterative cycles of least-squares refinement [against |F| forF > 2(F)] and difference syntheses with the programCRYSTALS(Betteridge, 2003).
Although the C and O atoms could be located and refined freely, all C—C and C—O bond distances and angles needed to be restrained to values obtained fromInternational Tables for Crystallography, Vol. C, for organicsp3—sp3andsp3—O (alcohol) bonds (Allenet al., 2003), as the very low comple-teness of the dataset and the poor quality of the intensity data (mainly due to the spotty background from the other very small crystallites) resulted in physically unreasonable bond distances and angles in the refinements. The weights for the restraints were derived from the standard uncertainties quoted for these bonds in International Tables for Crystal-lography. All C and O atoms were refined with isotropic displacement parameters, although these were constrained to have similar values to neighbouring atoms within the same molecule. H atoms attached to C atoms were placed geome-trically and not refined, whilst those on the O atoms were placed along likely hydrogen bonds and also not refined. Details of the crystal, data collection and refinement statistics are given in Table 1.
2.3. X-ray powder diffraction measurements
Synchrotron X-ray powder diffraction (XRPD) data were recorded on Station 2.3 (Cernik et al., 1990; Collins et al., 1992), = 1.17455 A˚ , at the SRS, Daresbury Laboratory. Liquid cyclohexanol was loaded in a 2 mm diameter capillary which was mounted on the diffractometer and data were recorded between ambient temperature and 118.5 K using an open-flow cooling device (Oxford Cryosystems) to cool the sample. The XRPD pattern obtained on cooling to 260 K showed only two strong Bragg reflections, consistent with the formation of cyclohexanol phase I. The transient nature of
[image:7.610.47.299.520.711.2]Acta Cryst.(2008). B64, 573–582 Richard M. Ibbersonet al. Polymorphism in cyclohexanol
577
Figure 3
phase III0was established following a series of runs on cooling the sample to 215 K, which confirmed that this phase is stable for approximately 15 min at this temperature before trans-forming to a third phase (III). Further tests showed that phase III0forms only on such a cooling cycle. On warming the phase III sample from 215 K back up to 260 K the sample was observed to transform directly to phase I. In order to record data of adequate statistical quality, the sample was repeatedly transformed from phase I to III0by cooling from 260 to 215 K and then collecting data for 15 min over a limited range of 2. Four ranges of 2were used: 5–15, 11–19, 14–21 and 20–30, the scans being subsequently merged into a single dataset.
At 260 K, the phase I data were indexed on a face-centred cubic unit cell, a = 8.785 (1) A˚ and V = 678.0 (2) A˚3, in agreement with the observations in the neutron experiments. The phase III0 data were indexed on a monoclinic cell a = 5.914 (1), b= 20.548 (2),c= 16.116 (2) A˚ ,= 97.84 (2) and
V = 1940.1 (5) A˚3, and in line with the observations from single-crystal measurements (seex2.2). Preferred orientation
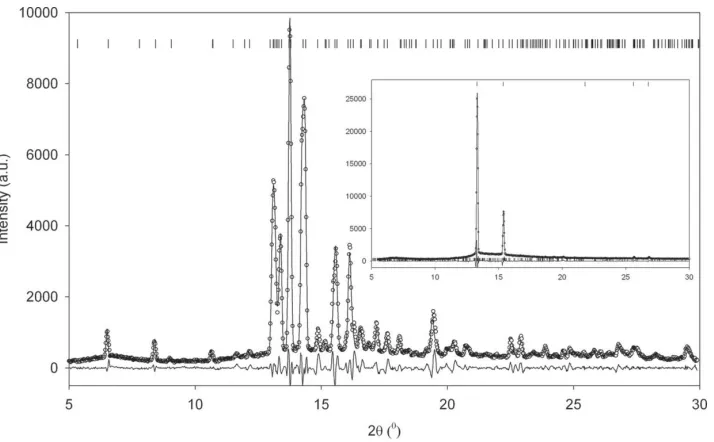
effects render the data unsuitable for detailed structure refinement and the final fits of the Pawley refinements are shown in Fig. 4. Pawley refinements of lower-temperature datasets, following the phase transformation, were based on the phase III structure fromx2.1.1.
Crystal structures were visualized using the programs
CAMERON(Watkinet al., 1993),MERCURY(Macraeet al., 2006) andDIAMOND(Crystal Impact, 2004). Analyses were carried out using PLATON (Spek, 2004) and Hirshfeld surfaces were calculated using CrystalExplorer (Wolff et al., 2007).
3. Results and discussion
3.1. The phase I crystal structure
The diffraction data recorded for cyclohexanol-I provide only very limited structural information, but are in agreement with the proposed face-centred cubic structure with all sample reflections conforming to an f.c.c. (face-centred cubic) lattice. No peaks were observed, in either the NPD, XRPD or single-crystal measurements, in violation of the face-centring to support the proposed model of a simple-cubic structure (S´ciesin´skaet al., 1989). The structural data in this phase are remarkable for the dearth of Bragg peaks observed even given the plastic nature of the phase. These observations corrobo-rate, albeit qualitatively, the high level of disorder in the model proposed (Andre´et al., 1984; Ceccaldi, 1985), which includes both axial and equatorial orientational configurations of the hydroxyl group and orientational disorder of the cyclohexyl ring. The volume per molecule is largest in this phase, 167.8 A˚3 at 250 K, and the 9% volume discontinuity associated with the first-order transition from phase II is also substantial in comparison with similar plastic phases. For example, cyclo-hexanone, which also adopts a chair conformation, shows a 6% volume discontinuity at the 225 K transition to a plastic f.c.c. phase (Ibberson, 2006). Cyclo-hexene oxide shows a comparable volume discontinuity of 9%, but in this case the molecule has a half-chair conformation and transforms at 193 K to a disordered simple-cubic structure (Ibberson et al., 2006).
3.2. The phase II crystal structure
[image:8.610.46.298.103.233.2]The structure of cyclohexanol-II has one molecule in the asym-metric unit and the hydroxyl groups of the molecules adopt an equatorial conformation, with a C—C—C—O torsion angle of 179.63 (4). The molecules are linked by hydrogen bonds around the fourfold axis into tetrameric rings (Fig. 5); distances and angles
Table 2
Selected hydrogen-bond lengths (A˚ ) and bond angles () for the phases of cyclohexanol.
D—H D—H H A D—H A D A A
Phase II
O61—D71 0.978 (12) 1.792 (11) 168.7 (9) 2.758 (9) O61 O61—D72 0.939 (16) 1.836 (16) 166.7 (19) 2.758 (9) O61
Phase III
O11—D11 1.008 (12) 1.592 (11) 170.5 (9) 2.587 (9) O21 O21—D21 1.008 (16) 1.782 (16) 176.7 (9) 2.787 (9) O11
Phase III0
O11—H11 0.90 1.75 179 2.65 (4) O31
O21—H21 0.90 1.85 179 2.75 (3) O11
[image:8.610.51.408.500.721.2]O31—H31 0.90 1.82 178 2.72 (3) O21
Figure 4
The final XRPD Pawley plot of cyclohexanol phase III0 at 215 K. The pattern contains weak peaks
are given in Table 2. The hydroxyl D atoms refine to an equatorial-in eq(60) conformation [form (I)] and a D62—
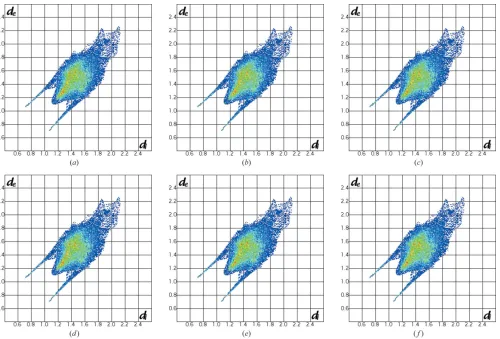
C6—O61—D71 torsion angle of 60.8 (8). The molecules are arranged so that the hydrogen-bond angles are approaching 170 and the ring motif is essentially planar with the bonds deviating by only5 around the tetramer from theab crys-tallographic plane. The possibility of hydroxyl groups adopting an axial ring position was investigated in detail using difference-Fourier methods. No evidence for axially arranged groups was observed; however, the Fourier plots did reveal disorder of the equatorially arranged D atoms within the ring plane and this was refined in the final analysis to give occu-pancy factors of 0.73 (1) and 0.27 (1) for the two possible orientations. The Hirshfeld surface fingerprint plot (McKinnon et al., 2004; Fig. 6a) reveal the characteristic hydrogen-bond spikes and also show that the remaining D D interactions are around 2.40 A˚ , the sum of the van der Waals radius. There is one significantly short contact, D32 D62, of 2.221 (8) A˚ .
The structure proposed here is at variance with much of the available literature on phase II. Earlier neutron powder diffraction studies (S´ciesin´skaet al., 1989), using a protonated sample, propose monoclinic cell parameters and a unit-cell volume of 1265 A˚3, withZ= 8. The corresponding tetra-gonal unit-cell volume at 80 K is 1180 A˚3, which implies a
significantly different molecular volume, and the two cells are
[image:9.610.60.560.371.710.2]Acta Cryst.(2008). B64, 573–582 Richard M. Ibbersonet al. Polymorphism in cyclohexanol
579
Figure 6
Two-dimensional fingerprint plots for (a) cyclohexanol-II at 2 K (dominant hydroxyl group orientation), (b) cyclohexanol-III at 2 K (molecule 1), (c) cyclohexanol-III at 2 K (molecule 2), (d) cyclohexanol-III0at 120 K (molecule 1), (e) cyclohexanol-III0at 120 K (molecule 2), (f) cyclohexanol-III0at 120 K (molecule 3).
Figure 5
The cyclohexanol-II ring motif viewed down c. Hydrogen bonds are
not readily reconciled. The possibility of an isotope effect cannot be ruled out; however, as shown below, it should be noted that the remaining phases are all found to adopt the same structure for both normal and perdeuterated samples. There is also some controversy regarding the abundance of axial and equatorial conformers in the phase II structure based on spectroscopic evidence. Following temperature-dependent Raman spectroscopy, James et al. (1976)2 report that conversion from phase I involves the elimination of axial isomers and thus equatorial isomers dominate the structures of phases II (and III) with phase II showing, in addition, intermolecular hydrogen bonding. The study by James et al.
(1976) also suggested the possibility of a small concentration of conformationally disordered molecules. Alternatively, IR studies (S´ciesin´ska & S´ciesin´ski, 1979) supported by more recent model calculations (Konopka & Wasiutynski, 1999) suggest both axial and equatorial conformers are present in both the phase II and phase III ordered structures, which may be discriminated by their different hydrogen-bond archi-tecture. The hydrogen bonding in phase II is thought to consist of ‘cyclic dimers’ based on IR and inelastic neutron spectro-scopy (S´ciesin´ska et al., 1989) data. The structural inter-pretation by Jameset al.is supported in the most part by the present study.
3.3. The phase III crystal structure
The space-group symmetry of cyclohexanol-III requires two molecules in the asymmetric unit and the molecules pack to form four-membered infinite hydrogen-bonded chains running along the crystallographicc-axis direction (Fig. 7). Although the molecular conformation could not be refined fully against the phase III data, the geometry of the hydroxyl groups was freely refined revealing that one molecule in the asymmetric unit adopts the equatorial-in conformation with a D111— C11—O11—D11 torsion angle of 60.3 (8), similar to the molecular conformation in phase II, whilst the second adopts the equatorial-out conformation with a D211—C21—O21— D21 torsion angle of 170.3 (8). The Hirshfeld surface finger-print plots (Figs. 6b andc) show the hydrogen-bond spikes extending further than observed in phase II, reflecting the shorter O H contacts. The hydrogen-bond distances and angles are given in Table 2 and whilst both the angles are above 170, one bond length is short, 2.587 (9) A˚ , with the other a more typical length of 2.787 (9) A˚ . Searches on the Cambridge Structural Database (CSD) for hydrogen-bonding interactions between alkyl-bonded free hydroxyl group donors find a shortest interaction of 2.584 (2) A˚ for GOLWIN (Tusviket al., 1999) at ambient pressure. A shorter distance of 2.516 (17) A˚ is observed in phase II of L-serine, albeit at a pressure of 7.3 GPa (Moggach et al., 2006). The transition from cyclohexanol-III to cyclohexanol-II may well be driven by relieving the strain of the phase III structure resulting from this close contact.
The present studies again correct previous neutron powder diffraction studies for this phase (S´ciesin´ska et al., 1989) in which a primitive orthorhombic unit cell was proposed at 5 K. The volume of this orthorhombic cell is almost exactly double the monoclinic volume reported here at 2 K, suggesting a close relationship between the respective cells; however, the two cells are not readily reconciled with each other. In this case, isotope effects can be ruled out as the phase III structure was also observed in the XRPD experiments using a protonated sample.
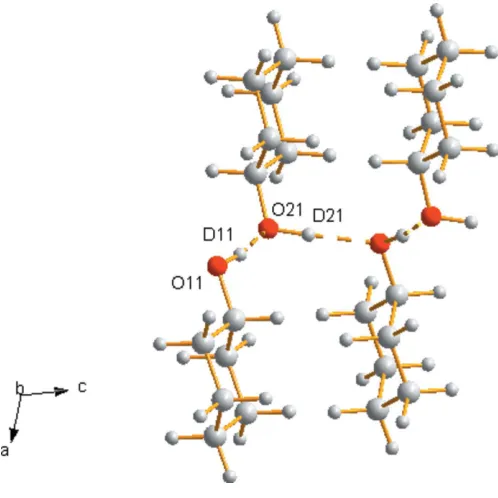
3.4. The phase III000crystal structure
[image:10.610.316.565.467.716.2]There are three molecules in the asymmetric unit of cyclohexanol-III0which are sequentially linked by hydrogen-bonded interactions to form three-membered infinite helical chains running along the crystallographicaaxis, as shown in Fig. 8. The hydrogen-bond distances and angles are given in Table 2 and both fall within normal ranges. One molecule in the asymmetric unit adopts the equatorial-in conformation with close to ideal geometry for the isomer and a H321— C32—O31—H31 torsion angle of 57. The remaining two molecules adopt an equatorial-out conformation but distorted from ideal geometry with H—C—O—H torsion angles of 149 and 153 for molecules 1 and 2, respectively, compared with the optimal 180 angle. In addition to the characteristic hydrogen-bond spikes, the Hirshfeld surface fingerprint plots (Fig. 6d–f) for phase III0 also show a significant feature between the spikes in particular for molecules 1 and 3 in the asymmetric unit, and these features are not observed in the other two phases. This corresponds to the presence of close H H contacts in the structure that are both shorter; the
Figure 7
The cyclohexanol-III ‘wave-like’ chain structure viewed down b.
Hydrogen bonds are drawn by dotted lines.
2In their paper Jameset al.designate the metastable form as II, and the stable
form as III. Their labelling has been altered to conform to that of Adachiet al.
feature extends to lower values ofdeand are more numerous, as denoted by the colour contouring, than observed in the corresponding plots for the other two phases. The phase III structure contains a number of H H contacts close to 2.20 A˚ , significantly less than the van der Waals radius. A recent survey (Woodet al., 2008) has shown that 1.7 A˚ is a practical limit for H H contacts up to pressures of 10 GPa, and contacts in the 2 A˚ region are rare. The number of points at larger values ofdeanddialso increases in phase III0, indicative of the less compact structure which is also confirmed by the molecular volume for this phase shown in Fig. 3.
There are only limited spectroscopic data recorded on phase III0 (Mayeret al., 1990) due to the transient nature of the phase. These focus on the kinetics of the phase transfor-mation and no frequency assignments were attempted. The present structural studies were successful in terms of deter-mining the structure of phase III0but shed little light on the kinetics of the transformation. The behaviour observed during the XRPD measurements is essentially consistent with the available literature (Mayeret al., 1990), whereas in the single-crystal experiment the sample transformed at a significantly lower temperature and is apparently more stable. The latter behaviour is most likely simply a function of thermal history and cooling rate, which is more uniform when applied to a much smaller volume single-crystal sample compared with the powder studies.
4. Summary and conclusions
The rich polymorphism of cyclohexanol reflects the confor-mational flexibility of the molecule. It is widely accepted that the energetically most stable conformation of the cyclohexane ring is the chair; however, the optimal orientation of the hydroxyl group is more contentious and has been the subject of numerous experimental measurements (Jameset al., 1976;
Konopka & Wasiutynski, 1999; S´ciesin´ska & S´ciesin´ski, 1979) andab initioand force-field calculations (Jansenet al., 1997a,b; Mayeret al., 1990; Palke & Kirtman, 1988). The most recent calculations (Jansen et al., 1997a,b) suggest that the energy difference between any of the four isomers (I)–(IV) does not exceed 3.60 kJ mol1, but that the two equatorial isomers and the axial 60 isomer are the most stable species. Hence the phase stability of cyclohexanol may be interpreted in terms of realising the most stable conformers within the crystal struc-ture allied with crystal packing effects dominated by the formation of hydrogen-bonded interactions.
In the orientationally ordered solid-state structures described here, no axial isomers are observed and only in the plastic phase I is the full conformational range of the molecule expressed (Andre´et al., 1984; Ceccaldi, 1985). On undergoing the transformation to the metastable phase III0the molecules order and all exhibit the equatorial form. In this Z0 = 3 structure, one molecule adopts the equatorial-in conformation with optimal geometry, but the hydroxyl groups of two other molecules in the equatorial-out form are distorted from the most stable orientation. The resulting structure is hydrogen bonded and also contains a number of short, presumably repulsive, H H interactions. Nevertheless, the molecular volume within the structure is seen to be significantly larger when compared with phases II and III (Fig. 3). For example, the molecular volume for cyclohexanol in phase III0at 215 K is 157 A˚3compared with 152 A˚3for phases II and III at 210 and 200 K, respectively. Phase III0therefore may be regarded as a non-optimal transient stage between phase I and (metastable) phase III. Not surprisingly the I–III0transition is irreversible. The phase III structure comprises molecules adopting both the equatorial-in and equatorial-out conformations, but in this case the geometry of each species is well matched to the ideal gas-phase structures. The molecular packing in phase III is efficient and comparable to that observed for the stable phase II, with a maximum volume discrepancy between these phases of some 1 A˚3per molecule observed at 4 K (see Fig. 3). The
molecular volume observed for phase III is seen to converge with the phase II value on approach to the transition point around 200 K. The stable phase II structure comprises one molecule with its hydroxyl group in an optimal equatorial-out conformation. In this structure the molecules form hydrogen-bonded tetrameric units which relieve the strain of the short hydrogen-bonded interaction within the chain structure adopted in phase III.
Cyclohexanol thus provides an interesting system on which to develop the understanding of hydrogen bonding in small molecule systems since it exhibits two out of the three most commonly observed hydrogen-bonded motifs in the crystal packing of monoalcohols, namely chains and dimers (Brock & Duncan, 1994; Taylor & Macrae, 2001). The results of Taylor & Macrae (2001) show that for secondary (2) monoalcohols chain and ring motifs are preferentially formed subject to steric effects. Cyclohexanol-II forms a planar four-membered ring, which is most common for 2 monoalcohols, and also supports the ‘rule’ of an increased likelihood of crystallizing in a high-symmetry (in this case tetragonal) space group. The
[image:11.610.49.296.508.707.2]Acta Cryst.(2008). B64, 573–582 Richard M. Ibbersonet al. Polymorphism in cyclohexanol
581
Figure 8
The threefold helical hydrogen-bonded chains in the structure of
cyclohexanol-III0viewed downa. Hydrogen bonds are drawn by dotted
hydrogen-bond motif of phase III0 falls within the threefold helices group classifying the geometries of OH OH chains (Taylor & Macrae, 2001). The formation of approx-imate helices via translation within Z0 = 3 structures, as observed in cyclohexanol-III0, is a frequent occurrence and indeed is again a characteristic more commonly associated with 2and tertiary (3) alcohols (Taylor & Macrae, 2001). The implication is that steric factors play a role in promoting these helical motifs and this may well also reflect the transformation from the orientationally disordered phase I to III0. The phase III structure forms chains categorized as ‘wave-like’ (Taylor & Macrae, 2001), which are relatively rare for 2 monoalcohols and more commonly observed in 1 monoalcohols, for example the ambient pressure structure of ethanol (Jo¨nsson, 1976). Thus, the structures of cyclohexanol follow, to a large extent, the empirical observations of Taylor & Macrae (2001). However, the extensive polymorphism shown by cyclohexanol highlights the difficulties in employing these types of obser-vations in order to direct crystal-structure prediction and one of the challenges in the on-going developments in computa-tional modelling and computacomputa-tional crystal structure predic-tion remains to treat appropriately the effect of temperature on phase stability and lattice energy.
Experiments at the ISIS Pulsed Neutron and Muon Source, Rutherford Appleton Laboratory, and the Synchrotron Radiation Source, Daresbury Laboratory, were supported by beamtime allocations from the Science and Technology Facilities Council. The authors thank Dr John E. Warren for his help on Station 9.8.
References
Adachi, K., Suga, H. & Seki, S. (1968).Bull. Chem. Soc. Jpn,41, 1073– 1087.
Adachi, K., Suga, H., Seki, S., Kubota, S., Yamaguchi, S., Yano, O. & Wada, Y. (1972).Mol. Cryst. Liq. Cryst.18, 345–368.
Allen, F. H., Kennard, O., Watson, D. G., Brammer, L., Orpen, A. G. & Taylor, R. (2003).J. Chem. Soc. Perkin Trans. 2, pp. 1972–1999. Altomare, A., Cascarano, G., Giacovazzo, C., Guagliardi, A., Burla, M. C., Polidori, G. & Camalli, M. (1994).J. Appl. Cryst.27, 435. Andersson, O., Ross, R. G. & Ba¨ckstro¨m, G. (1989).Mol. Phys.66,
619–635.
Andre´, D., Ceccaldi, D. & Szwarc, H. (1984).J. Phys. Fr.45, 731–737. Betteridge, P. W., Carruthers, J. R., Cooper, R. I., Prout, K. & Watkin,
D. J. (2003).J. Appl. Cryst.36, 1487.
Blessing, R. H. (1997).J. Appl. Cryst.30, 421–426.
Brock, C. P. & Duncan, L. L. (1994).Chem. Mater.6, 1307–1312. Bruker (2006a).RLATT.Bruker AXS, Madison, Wisconsin, USA. Bruker (2006b).SAINT.Bruker AXS, Madison, Wisconsin, USA. Ceccaldi, D. (1985).Phys. Rev. B,31, 8221–8225.
Cernik, R. J., Murray, P. K., Pattison, P. & Fitch, A. N. (1990).J. Appl. Cryst.23, 292–296.
Coelho, A. A. (2003).J. Appl. Cryst.36, 86–95.
Coelho, A. (2008). Topas-Academic: General Profile and Structure Analysis Software for Powder Diffraction Data; http://members.op-tusnet.com.au/~alancoelho/.
Collins, S. P., Cernik, R. J., Pattison, P., Bell, A. M. T. & Fitch, A. N. (1992).Rev. Sci. Instrum.63, 1013–1014.
Crystal Impact (2004).DIAMOND, Version 3.0. Crystal Impact GbR, Bonn, Germany.
Green, J. R. & Griffith, W. T. (1965).J. Phys. Chem. Solids,26, 631– 637.
Green, J. R. & Griffith, W. T. (1969a).J. Cryst. Growth,5, 171–183. Green, J. R. & Griffith, W. T. (1969b).Mol. Cryst. Liq. Cryst.6, 23–40. Hartmann, M., Jenau, M., Wu¨rflinger, A., Godlewska, M. & Urban, S.
(1992).Z. Phys. Chem.177, 195–210.
Ibberson, R. M. (2006).Acta Cryst.B62, 592–598.
Ibberson, R. M., David, W. I. F. & Knight, K. S. (1992). Report RAL-92-031. Rutherford Appleton Laboratory, Oxon, England. Ibberson, R. M., Yamamuro, O. & Tsukushi, I. (2006).Chem. Phys.
Lett.423, 454–458.
James, D. W., Shurvell, H. F. & Parry, R. M. (1976). J. Raman Spectrosc.5, 201–209.
Jansen, C., Mey, D., Raabe, G. & Fleischhauer, J. (1997a). J. Mol. Struct. Theochem.pp. 398–399.
Jansen, C., Mey, D., Raabe, G. & Fleischhauer, J. (1997b). J. Mol. Struct. Theochem.pp. 395–404.
Jo¨nsson, P. G. (1976).Acta Cryst.B32, 232–235. Kelley, K. K. (1929).J. Am. Chem. Soc.51, 1400–1406.
Konopka, M. N. & Wasiutynski, T. (1999).Acta Phys. Pol. A,96, 399– 407.
Macrae, C. F., Edgington, P. R., McCabe, P., Pidcock, E., Shields, G. P., Taylor, R., Towler, M. & van de Streek, J. (2006).J. Appl. Cryst.39, 453–457.
Mayer, J., Rachwalska, M., S´ciesin´ska, E. & S´ciesin´ski, J. (1990).J. Phys. Fr.51, 857–867.
McKinnon, J. J., Spackman, M. A. & Mitchell, A. S. (2004). Acta Cryst.B60, 627–668.
Moggach, S. A., Marshall, W. G. & Parsons, S. (2006).Acta Cryst.B62, 815–825.
Oˆ tsubo, A. & Sugawara, T. (1955).Sci. Rep. Res. Inst. Tohoku Univ. A,7, 583–590.
Palke, W. E. & Kirtman, B. (1988).J. Phys. Chem.92, 3046–3048. S´ciesin´ska, E., Mayer, J., Natkaniec, I. & S´ciesin´ski, J. (1989). Acta
Phys. Pol. A,76, 617–629.
S´ciesin´ska, E. & S´ciesin´ski, J. (1979).Mol. Cryst. Liq. Cryst.51, 9– 27.
Sheldrick, G. M. (2001). SADABS. University of Go¨ttingen, Germany.
Spek, A. L. (2004).PLATON.Utrecht University, The Netherlands. Taylor, R. & Macrae, C. F. (2001).Acta Cryst.B57, 815–827. Tusvik, P. H., Mostad, A., Dalhus, B. & Rosenqvist, E. (1999).Acta
Cryst.C55, 1113–1115.
Wasiutyn´ski, T., S´ciesin´ski, J. & S´ciesin´ska, E. (2001). Phase Transitions,73, 523–532.
Watkin, D. J., Pearce, L. & Prout, C. K. (1993). CAMERON.
Chemical Crystallography Laboratory, University of Oxford, England.
Wolff, S. K., Grimwood, D. J., McKinnon, J. J., Jayatilaka, D. & Spackman, M. A. (2007).CrystalExplorer, Version 2. University of Western Australia.