Comparative Analysis of EDM Parameters
Influencing MRR, TWR and Surface Roughness
for EN-24 and EN-42
Ashutos Shukla1, Sumit Kumar Singh2, Nikhil Bajpai3
1
M. Tech scholar, 2, 3Assistant Professor, Department of Mechanical Engineering, Bansal Institute of Engineering & Technology, Lucknow
Abstract: The present scenario is the advancement of manufacturing industry, and it requires for alloy substances having high level hardness, impact resistance and toughness. The EDM is used in specific cutting complex contours which are complex to machine using traditional machining methods. It is a non-touching non-regular machining method which is used for better quality of product which is complex to achieve by using of contacting EDM processes. The current study on EDM is performed on EN-24 and EN-42 with copper as electrode to establish the influence and compare the process factors on material removal rate, tool wear rate and surface roughness. The experimental outcomes resulted that the material removal rate, tool wear rate and surface roughness are majorly effected by peak current, pulse on time while pulse duty factor was found to be the least influencing parameter for all performance measures.
Keywords: EDM, EN-24, EN-42, Taguchi, S/N ratio, MRR, TWR.
I. INTRODUCTION AND LITERATURE SURVEY
Electro Discharge Machining (EDM) process is generally an electrical-warm non-conventional material machining technique, which uses electrical energy to produce electrical spark and the material evacuation predominantly happens due to erosion caused by the heat energy of the spark. EDM are generally applied to perform machining operation on hard substance which are not easy to machine and have more strength and are temperature contrary alloys. EDM may also be used for machining complex design in short batches or for on job-shop orient. Experimental substance which should be machined in EDM must be conductor of electricity. EDM is widely used nontraditional machining method for removing material from work-piece without applying any physical cutting force by the tool. Flushing is most vital function in any electrical discharge machining operation. Flushing is the process of introducing clean filtered dielectric fluid in spark gap. Incorrect Flushing can result in inconsistent cutting and poor machining. There are so many literatures in the field of EDM such as: Ojha et al. [1] conducted analysis with Taguchi approach and revealed that current significantly influences MRR, Dimensional Tolerance and surface roughness whereas TWR is mostly influenced by flow rate of the dielectric fluid used. Sari et al. [2] found that carbon Nano-tubes give better surface finish as well as the conventional EDM technique. The thickness of recast layer is observed to be lower when carbon Nano-tubes are used. Kubade et al. [3] investigated that MRR is mainly dominated with current whereas other factors were less influencing. Tool wear rate is most effected by maximum current as well as pulse on time, whereas pulse duty cycle and gap voltage cause low fluctuation on it. Harpuneet et al. [4] Investigated the Effect of Copper Chromium and Aluminum Electrodes on EN-31 Die Steel and concluded that Metal removal rate is better for copper chromium except at 6A current when compared to brass electrode. Maximum MRR was achieved at 12A for both brass and copper chromium. Singh et al. [5] found that the negative polarity of tool is essential for minimizing the roughness of surface and increasing the pulse on time produces more rough surfaces. Addition of powder particles in insulating fluid will decreases the level surface roughness of EDM specimen while larger peak currents offers more rough surfaces. Syed et al. [6] investigated the performance of EDM using aluminum mixed in distilled water and concluded that the polarity causes an important role in EDM. Higher productivity is achieved with positive charge, while better surface finish is obtained in negative charge. The main objectives of the paper are the study the impact of position of unbalanced mass and alter in speed of rotor on shaft vibration.
II. EXPERIMENTAL SETUP AND DATA COLLECTION
C; 0.41, Si; 0.28%, Mo; 0.21%) and EN-42 (chemical composition: Fe; 95.7%, P; 0.05%, Mn; 0.55%, S; .05%, C; .70% Si; 0.28%) was chosen for as workpiece. Work piece has diameter of 5 mm in round bar. Experiment were conducted to determine MRR, TWR, and Surface roughness for both EN-24 and EN-42 with variation in input parameters. The input parameters and their levels are shown in Table 1., and Table 2. shows the Design of experiment and output Responses. In Table 2. Material removal rate(MRR)
is in mm3/min and Tool wear rate (TWR) is in mm3/min and the surface roughness is measured in µm for both EN-24 and EN-42
material.
Table 1. Process Parameters and their levels
S.No. Parameters Units Level 1 Level 2 Level 3
1 Peak Current (Ip) A 2 5 8
2 Pulse-on-time (Ton) µsec 20 40 60
[image:2.612.51.567.257.562.2]3 Pulse duty Factor(T) 5 6 7
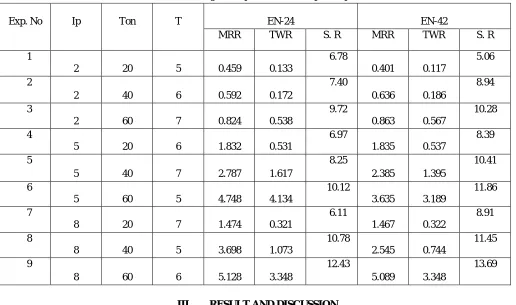
Table 2. Design of Experiment and Output Responses
Exp. No Ip Ton T EN-24 EN-42
MRR TWR S. R MRR TWR S. R
1
2 20 5 0.459 0.133
6.78
0.401 0.117
5.06
2
2 40 6 0.592 0.172
7.40
0.636 0.186
8.94
3
2 60 7 0.824 0.538
9.72
0.863 0.567
10.28
4
5 20 6 1.832 0.531
6.97
1.835 0.537
8.39
5
5 40 7 2.787 1.617
8.25
2.385 1.395
10.41
6
5 60 5 4.748 4.134
10.12
3.635 3.189
11.86
7
8 20 7 1.474 0.321
6.11
1.467 0.322
8.91
8
8 40 5 3.698 1.073
10.78
2.545 0.744
11.45
9
8 60 6 5.128 3.348
12.43
5.089 3.348
13.69
III. RESULT AND DISCUSSION
Optimal parameters settings are find using Taguchi techniques. In the Taguchi technique, the term ‘signal’ represents the required value (mean) for the output characteristic and therefore the term ‘noise’ represents the undesirable value (standard Deviation) for the output characteristic. The S/N ratio primarily depends upon the standard attributes of the method to be optimized. Generally, there are three categories of performance attributes for the investigation of the S/N ratio; they are the lower is better, the nominal is better, and the higher is better. S/N ratio for each response is typically computed differently as per the classification of the execution attributes and so no matter the class the larger S/N ratio will relate to better process performance characteristic.
A. Calculation of S/N Ratio
To obtain optimal responses, higher-the better-quality characteristic for Material removal rate and lower-the better-quality for Tool wear rate and surface roughness must be taken. The equation for the calculation of S/N ratio is:
Table 3. S/N ratios for MRR, TWR and S. R
Exp. No.
EN-24 EN-42
S/N ratio for MRR
S/N ratio for TWR
S/N ratio for S. R
S/N ratio for MRR
S/N ratio for TWR
S/N ratio for S. R
1 -6.7637 17.5230 -16.6246 -7.9371 18.6363 -14.0830
2 -4.5536 15.2894 -17.3846 -3.9309 14.6097 -19.0268
3 -1.6815 5.3844 -19.7533 -1.2798 4.9283 -20.2399
4 5.2585 5.4981 -16.8647 5.2727 5.4005 -18.4752
5 8.9027 -4.1742 -18.3291 7.5498 -2.8915 -20.3490
6 13.5302 -12.3274 -20.1036 11.2101 -10.0731 -21.4817
7 3.3699 9.8699 -15.7208 3.3286 9.8429 -18.9976
8 11.3593 -0.6120 -20.6524 8.1138 2.5685 -21.1761
9 14.1990 -10.4957 -21.8894 14.1326 -10.4957 -22.7281
[image:3.612.40.572.86.260.2]B. Analysis for MRR
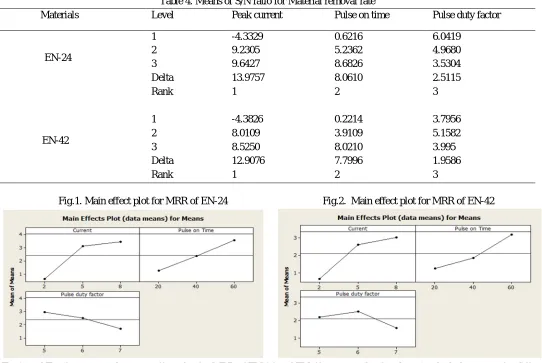
[image:3.612.39.581.311.674.2]Table 4. shows the means of S/N ratio for material removal rate.
Table 4. Means of S/N ratio for Material removal rate
Materials Level Peak current Pulse on time Pulse duty factor
EN-24
1 -4.3329 0.6216 6.0419
2 9.2305 5.2362 4.9680
3 9.6427 8.6826 3.5304
Delta 13.9757 8.0610 2.5115
Rank 1 2 3
EN-42
1 -4.3826 0.2214 3.7956
2 8.0109 3.9109 5.1582
3 8.5250 8.0210 3.995
Delta 12.9076 7.7996 1.9586
Rank 1 2 3
Fig.1. Main effect plot for MRR of EN-24 Fig.2. Main effect plot for MRR of EN-42
[image:3.612.37.576.316.496.2]material optimal parameters are Peak current; 8A, Pulse on time; 60μsec and Pulse duty factor is 5, and for EN-42 material optimal parameters are Peak current; 8A, Pulse on time; 60μsec and Pulse duty factor is 6.
C. Analysis For Tool Wear Rate
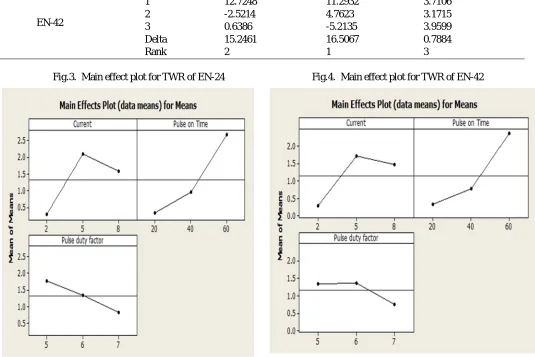
[image:4.612.41.573.158.321.2]Table 5. shows the means of S/N ratio for Tool wear rate.
Table 5. Means of S/N ratio for Tool wear rate
Materials Level Peak current Pulse on time Pulse duty factor
EN-24
1 12.7323 10.9637 1.5279
2 -3.6678 3.5011 3.4306
3 -0.4126 -5.8129 3.6934
Delta 16.4001 16.7766 2.1655
Rank 2 1 3
EN-42
1 12.7248 11.2932 3.7106
2 -2.5214 4.7623 3.1715
3 0.6386 -5.2135 3.9599
Delta 15.2461 16.5067 0.7884
[image:4.612.47.582.261.618.2]Rank 2 1 3
Fig.3. Main effect plot for TWR of EN-24 Fig.4. Main effect plot for TWR of EN-42
Fig.3. and Fig.4. presents the mean effect plot for TWR of EN-24 and EN-42 respectively. It is noticed that both Ip and Ton are the major effective alternative and have direct influence on TWR for both materials. It is seen that TWR follows an increasing trend with Ton for both EN-24 and EN-42. In case of peak current, TWR initially increases with it but on further increase in Ip, TWR decreases. This is according to the concept that have higher peak of current, MRR is more and thus the debris present in middle the tool and the experimental substance after material transfer reduces the intensity of electrons striking the surface of the tool. Hence TWR decreases by
increment in peak current. Optimal parameters settings obtained for TWR is as follows: Peak current; 2A, Pulse on time; 20μsec and
D. Analysis for Surface Roughness
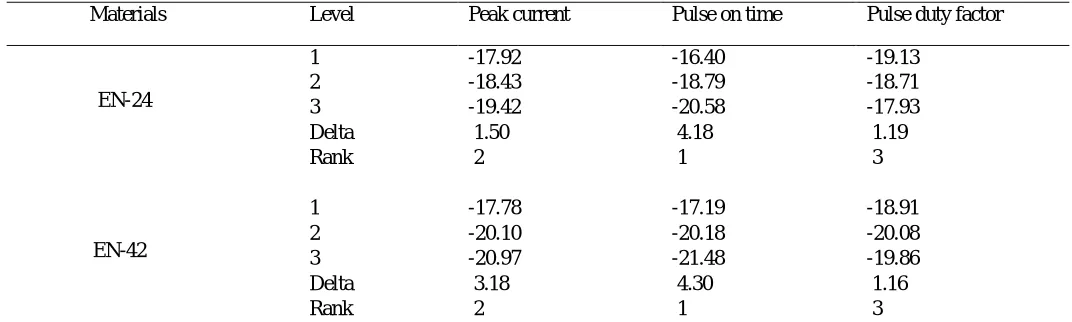
[image:5.612.37.573.128.289.2]Table 6. shows the means of S/N ratio for Surface Roughness.
Table 6. Means of S/N ratio for Surface Roughness
Materials Level Peak current Pulse on time Pulse duty factor
EN-24
1 -17.92 -16.40 -19.13
2 -18.43 -18.79 -18.71
3 -19.42 -20.58 -17.93
Delta 1.50 4.18 1.19
Rank 2 1 3
EN-42
1 -17.78 -17.19 -18.91
2 -20.10 -20.18 -20.08
3 -20.97 -21.48 -19.86
Delta 3.18 4.30 1.16
[image:5.612.47.571.316.495.2]Rank 2 1 3
Fig.5. Main effect plot for S. R of EN-24 Fig.6. Main effect plot for S. R of EN-42
Fig.5. and Fig.6. presents the mean effect plot for SR of EN-24 and EN-42 respectively. This is noticed that both current and Ton are the major influencing alternatives and have direct influence on SR for both materials. It is observed that SR follows an increasing trend with both Ip and Ton for both EN-24 and EN-42. Optimal parameters settings obtained for S. R is as follows: Peak current; 2A, Pulse on time; 20μsec and Pulse duty factor is 7 for EN -24, and for EN-42 material optimal parameters are Peak current; 2A, Pulse on time; 20μsec and Pulse duty factor is 5.
E. Confirmation Test
Confirmation tests have been performed for MRR, TWR and Surface Roughness with their optimum levels of process variables. For
EN-24 material, on the taking the optimum parameters value for MRR the results come out 5.06 mm3 /min which is near to the expected
value 5.118 mm3 /min, on the taking the optimum parameters for TWR the results come out 0.128 mm3 /min which is near to the
expected value 0.141 mm3 /min and on the tanking the optimum parameters for Surface Roughness the results come out 5.06 µm which
is near to 5.25 µm.
For EN-42 material, on the taking the optimum parameters value for MRR the results come out 5.089 mm3 /min which is near to the
expected value 5.023 mm3 /min, on the taking the optimum parameters for TWR the results come out 0.134 mm3 /min which is near to
the expected value 0.139 mm3 /min and on the tanking the optimum parameters for Surface Roughness the results come out 5.08 µm
IV. CONCLUSIONS
It is concluded from the analysis the Peak current and Pulse on time are the major influencing on MRR, TWR and S. R for both materials. MRR shows and increasing trend with Peak current and Pulse on time for both EN-24 and EN-42 because at top level of Peak current and Pulse on time, the intensity of spark is high and hence large amount of material transfer from upper layer of work piece. TWR follows an increasing trend with pulse on time for both EN-24 and EN-42. TWR initially increases with peak current but on further increase in Peak current, TWR decreases. For S. R lower the peak current and pulse on time lower is the surface roughness.
REFERENCES
[1] D. K. Ojha, S. Panda, D.Mishra “A Study on Effect of EDM Process Parameters on AISI 304L Stainless Steel”26th All India Manufacturing Technology, Design and Research Conference (AIMTDR 2014) December 12th–14th, 2014
[2] Sari, M.M., Noordin, M.Y. and Brusa, E., 2013. Role of multi-wall carbon nanotubes on the main parameters of the electrical discharge machining (EDM) process. The International Journal of Advanced Manufacturing Technology, 68(5-8), pp.1095-1102.
[3] Pravin R. Kubade, V. S. Jadhav, An Experimental Investigation of Electrode Wear Rate (EWR), Material Removal Rate (MRR) and Radial Overcut (ROC) in EDM of High Carbon-High Chromium Steel (AISI D3), International Journal of Engineering and Advanced Technology (IJEAT) ISSN: 2249 – 8958, Volume-1, Issue-5, June
[4] Singh, H., 2012, July. Investigating the effect of copper chromium and aluminum electrodes on EN-31 Die steel on electric discharge machine using positive polarity. In proceedings of the world congress on engineering (Vol. 3, pp. 4-6).
[5] Singh, B., Singh, P., Tejpal, G. and Singh, G., 2012. An experimental study of surface roughness of h11 steel in EDM process using copper tool electrode. Int. J. of Adv. Engg. Tech, 3(4), pp.130-133.