Original citation:
Zhang, Qiang, Bhalerao, Abhir and Hutchinson, Charles. (2017) Deformable appearance
pyramids for anatomy representation, landmark detection and pathology classification.
International Journal of Computer Assisted Radiology and Surgery.
Permanent WRAP URL:
http://wrap.warwick.ac.uk/88990
Copyright and reuse:
The Warwick Research Archive Portal (WRAP) makes this work of researchers of the
University of Warwick available open access under the following conditions.
This article is made available under the Creative Commons Attribution 4.0 International
license (CC BY 4.0) and may be reused according to the conditions of the license. For more
details see:
http://creativecommons.org/licenses/by/4.0/
A note on versions:
The version presented in WRAP is the published version, or, version of record, and may be
cited as it appears here.
Int J CARS
DOI 10.1007/s11548-017-1622-5
O R I G I NA L A RT I C L E
Deformable appearance pyramids for anatomy representation,
landmark detection and pathology classification
Qiang Zhang1 · Abhir Bhalerao1 · Charles Hutchinson2
Received: 28 January 2017 / Accepted: 23 May 2017
© The Author(s) 2017. This article is an open access publication
Abstract
Purpose Representation of anatomy appearance is one of the key problems in medical image analysis. An appearance model represents the anatomies with parametric forms, which are then vectorised for prior learning, segmentation and clas-sification tasks.
Methods We propose a part-based parametric appearance model we refer to as a deformable appearance pyramid (DAP). The parts are delineated by multi-scale local feature pyramids extracted from an image pyramid. Each anatomy is represented by an appearance pyramid, with the variabil-ity within a population approximated by local translations of the multi-scale parts and linear appearance variations in the assembly of the parts. We introduce DAPs built on two types of image pyramids, namely Gaussian and wavelet pyramids, and present two approaches to model the prior and fit the model, one explicitly using a subspace Lucas–Kanade algo-rithm and the other implicitly using the supervised descent method (SDM).
Results We validate the performance of the DAP instances with difference configurations on the problem of lumbar spinal stenosis for localising the landmarks and classifying the pathologies. We also compare them with classic methods such as active shape models, active appearance models and constrained local models. Experimental results show that the DAP built on wavelet pyramids and fitted with SDM gives the best results in both landmark localisation and classifica-tion.
B
Qiang Zhang1 Department of Computer Science, University of Warwick,
Coventry, UK
2 University Hospitals Coventry and Warwickshire, Coventry,
UK
Conclusion A new appearance model is introduced with several configurations presented and evaluated. The DAPs can be readily applied for other clinical problems for the tasks of prior learning, landmark detection and pathology classification.
Keywords Deformable part models·Deformable appear-ance pyramids·Landmark detection·Classification
Introduction
process is implemented by local feature searching followed by a regularisation imposed through a prior model of the global shape. Various types of DPM instances have been pro-posed utilising advanced feature detection algorithms such as boosted regression [5], random forests [8], regularised mean-shift [11], and shape optimisation methods such as pictorial structures [1] and nonparametric models [16]. However, less attention has been paid to optimising the appearance repre-sentation and preserving the anatomical details in medical imaging.
In this paper, we introduce a new appearance model referred to as deformable appearance pyramids (DAPs). The object appearance is delineated by an appearance pyramid (AP), which is a multi-scale part-based representation built on the image pyramid, see Fig. 1b. The deformation is approximated by the translations of the parts as well as the linear appearance variations in the assembly of the parts. The multi-scale delineation preserves the details of the anatomi-cal features at high resolution, while captures the background information at lower resolution. We present and evaluate the DAPs built on two types of image pyramids, namely Gaussian and wavelet pyramids, and introduce two methods to model the prior and fit to new instances, one explicitly using a mul-tivariate Gaussian model and subspace Lucas–Kanade (LK) algorithm [2], another implicitly using supervised descent method (SDM) [16].
We apply the DAPs to the problem of lumbar spinal stenosis (LSS) for fitting the landmarks and grading the central and foraminal stenosis [7,14]. The performances of the DAPs with various configurations are evaluated and compared with classic methods such as active shape models (ASMs), AAMs [3] and constrained local models (CLMs) [4]. Experimental results show that the DAPs built on wavelet image pyramids [18] and driven by the SDM give the best performance on both landmark detection and pathol-ogy classification.
Deformable appearance pyramids for object
representation
Objects belonging to the same class (e.g. same anatomy from different cases) often share similar appearances. The appear-ances can be represented by a deformable model, which is fitted to individual cases by changing the parameters of the model. With the deformable appearance model, the varia-tions in the population caused by the diversity of individual cases or the pathological degenerations can be parametrised, learned and used as prior knowledge for robust fitting and classification. A DAP is a deformable model representing the anatomies by multi-scale rigid parts as well as the geo-metrical configuration. It models the variability within a
population with local translations and linear appearance vari-ations in the assembly of the parts.
Local feature pyramid
We begin by describing the parts at multiple scales. The part at a landmark is typically described by an image patch with a certain size. Choice of the patch size can significantly affect the performance of the model. For sharper local structures, a smaller patch can give more precise pixel location. At blurry structures, however, the patch size should be large enough to cover distinguishable textural information. A good feature descriptor is expected to have a high spatial specificity (pixel location) while maintaining good distinctive ability (textural properties). Due to the uncertainty principle in signal pro-cessing [15], a single scale patch cannot achieve both. We therefore represent the part with a multi-scale local feature pyramid (LFP), with the smaller scales containing local high frequency features, and the larger scales low frequency com-ponents.
A L-level LFP at a landmark, denoted by{Al}lL=1, is an assembly of patches extract from aL-level image pyramid. The patches Al describe the local features with increasing scales and decreasing resolutions in octave intervals. The first-level patch is the smallest one with the finest resolution. A patch in thelth level hasl octaves larger scale and lower resolution, which keeps the same size in pixel across all lev-els, see an example extracted from Gaussian image pyramid in Fig.2.
Anatomy decomposition by DAP
A DAP is a part-based deformable model with each part delineated by a LFP. The DAP consists of two components: {A,s}, withA= {{An,l}Ll=1}nN=1, called an appearance
pyra-mid, being the assembly of the LFPs, andsthe geometrical configuration accounting for the deformations.Nis the total number of landmarks.
As the patches cover larger anatomical regions at lower-resolution pyramidal layers, fewer number of patches are required to describe the appearance of the anatomy at a coarser level. We trim the patches at these levels preserv-ing only those denotpreserv-ing key features. In practice, a simple trimming algorithm can be designed to iteratively delete the patches which have least distance from their neighbourhood patches until a distance criterion is satisfied. DenotingKnas the subset of scale indices preserved at thenth landmark, the AP becomesA = {{An,l}l∈Kn}
N
n=1. At each level ofA, the
appear-Int J CARS
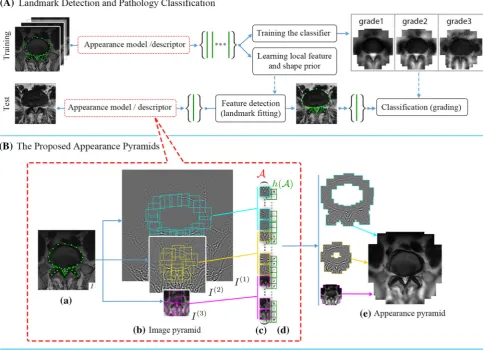
Fig. 1 a A standard approach of landmark detection and
pathol-ogy classification.bThe proposed appearance modelAand feature descriptorh(A).Appearance decomposition(a) an image example. (b) Pyramidal image channels. Local patches are extracted from the chan-nels at key landmarks ins. Patches of different channels have the save size in pixels, which give a multi-scale description of the local features.
(c) All patches are concatenated and flattened into a 1D vectorAserving as the profile of the appearance. (d) A further feature extraction func-tion can be used to enhance the robustness.Reconstruction(e) feature patches are padded at each scale level with the geometry configured by
s. All scales are accumulated to recover the object appearance
Fig. 2 Gaussian local feature pyramid
ance, they are chosen to be either pyramids with redundant channels such as Gaussian pyramids or with complemen-tary channels such as wavelet pyramids: we refer to the appearance delineations as Gaussian appearance pyramids and wavelet appearance pyramids, respectively. We briefly
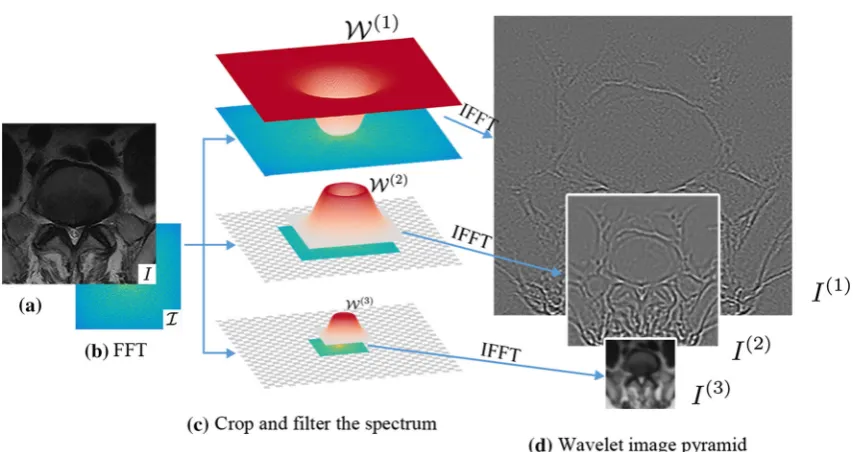
illustrate a recent method of wavelet pyramid decomposition in Fig.3. A detailed introduction can be found in [18].1
1 Supplementary webpages of the Gaussian appearance pyramid
[image:4.595.118.484.502.614.2]Fig. 3 Wavelet image pyramid. (a) An image example. (b) Fourier transform of the image. (c) Multi-scale windows{W(l)}lL=1are applied to the spectrum. As the windows cover only a subband at one octave lower, spectrums are cut by half at each larger scale. (d) Subband
pyra-mids representing multi-scale structures are obtained directly from the filtered spectrum, with a simultaneous downsampling at larger scales achieved by the cropping in the Fourier domain
Deformable appearance pyramids fitting
Fitting a DAP to a new case is accomplished by searching for the landmarks based on local features and matching the model correctly to the geometry and appearance of the object. The geometrical configuration of a DAP defines how the parts relate to each other and the prior knowledge constrains the shape to beplausiblein an object category. As a result, the choices of prior modelling and geometry constraint are important. We describe two strategies, one which learns the prior knowledge with explicit methods and the other implic-itly.
Explicit model
In the explicit method, the geometry is configured with the point distribution shape model. The shape is represented by
s = [x1,x2, . . . ,xN], in whichxn is the coordinate of the
nth landmark. We follow the two-step fitting strategy com-monly used in part-based models [11,12], i.e. local feature searching followed by a geometrical regularisation. The local feature searching gives predictions of the landmark locations, while the shape prior regularises the geometry within plausi-ble variations. The likelihood of a shape instance with respect to the shape prior and local landmark predictions can be cal-culated by,
Footnote 1 continued
and wavelet appearance pyramid at http://sites.google.com/site/ waveletappearancepyramids/.
p(s|Θ,A)∝ p(s|Θ)p(s|A)
=p(s|Θ)
N
n=1
p(xn|{An,l}l∈Kn) (1)
We show how the prior of the patch appearanceAis learnt and used for the local feature searching, and the prior of the geometrysis learnt for the shape regularisation.
Local feature searching
Appearance prior Given the training set, we can extract A from each image and obtain a set of training samples
{A1,A2, . . .}. By extracting the local features from the
cor-responding landmarks, the shape variation in the training set is removed and a better pixel-to-pixel correspondence achieved; therefore,Acan be viewed as ‘shape-free’ appear-ances. To learn the statistics of the appearances, we normalise the mean and variance of eachAand apply principal com-ponent analysis (PCA). The eigenvectors accounting for the significant variations in the training samples form a matrix
PA, which spans an eigenspace.
A new instance can be represented in the eigenspace by
A= ¯A+PAbA, (2)
[image:5.595.84.511.50.276.2]Int J CARS
bA=PAT(A− ¯A). (3)
Searching We derive a subspace LK algorithm [2] for the DAP fitting. In a standard LK method, the searching can be expressed by
ˆ
xn,l =arg min||An,l(xn,l)− ¯An,l||2, (4)
which attempts to find the location minimising the difference between the local appearance and the template A¯n,l. An,l is the patch at theith landmark and thelth scale inA.A¯n,l is a patch inA¯.xˆn,l is the predicted location of theith landmark inferred fromAn,l.
The standard LK method assumes the difference between the template and the local feature is caused by the misalign-ment, and aims to minimise the difference by adjusting the location. However, the difference can also be the appearance variations among cases, which makes the searching challeng-ing. As the salient variations have been learnt and represented in the eigenspace spanned by PA, we project the AP onto its orthogonal subspace where these variations are excluded, namely
A⊥=I −P APAT
A, (5)
where I is an identity matrix. The objective function thus becomes
ˆ
xn,l =arg min||A⊥n,l(xn,l)− ¯A⊥n,l||2, (6)
in whichA⊥n,ldenotes a patch inA⊥. In this way, the salient appearance variations have been removed and a more robust LK method achieved. Equation (6) is solved iteratively by the inverse gradient descent method [17]
⎧ ⎪ ⎨ ⎪ ⎩
xn,l = ∂
¯
A⊥n,l
∂xn
+
A⊥n,l(xn)− ¯A⊥n,l
,
ˆ
xn,l ← ˆxn,l+xn,l.
(7)
Suppose we also have the varianceσn2,l of the prediction ˆ
xn,l, which could indicate the salience of the local feature or the confidence of the prediction. To keep it simple, we calcu-late the variance as the mean squared difference between the patch observation and the template. Using a Gaussian para-metric form, the likelihood of the location of theith landmark given the multi-scale prediction can be represented by
p(xn|{An,l}l∈Kn)∝
l∈Kn
p(xn|An,l)
= l∈Kn
exp(xn− ˆxn,l)
2
−2σn2,l . (8)
Shape regularisation
Shape prior Assuming a multi-variant Gaussian model, the statistics of the shapes is built by applying PCA to the aligned training shapes,
bs=PsT(s− ¯s), (9)
where Ps∈R2N×tis the eigenvectors matrix corresponding
to the first t largest eigenvaluesλ1, . . . , λt and spans a t -dimensional eigenspace.bs ∈Rt×1is the shape parameters
in the eigenspace.
The probability of a shape instance being plausible in the eigenspace can be calculated by the density estima-tion [10],
p(s|Θ)∝exp −1 2b
T sΛbs
=exp
⎛
⎝−1
2 t
j=1
b2j
λj ⎞
⎠, (10)
in whichΛ=diag{λ1, . . . , λt}.
Regularisation Substituting (8) and (10) into (1), the likeli-hood becomes
p(s|Θ,A)∝exp ⎛
⎝−1
2 t
j=1
b2j
λj ⎞ ⎠
N
n=1
l∈Kn
exp(xn− ˆxn,l)
2
−2σ2
n,l
(11)
Taking the negative log form, we can obtain an energy function,
E(s)= 1
2 t
j=1
b2j
λj +
N
n=1
l∈Kn
(xn− ˆxn,l)2
2σn2,l (12)
The maximum likelihood shape with respect to the prior and observation is the one minimising E(s), which is given by
s=
PsΛ−1PsT+
L
l=1
Σ−1
l
−1
PsΛ−1PsT¯s+
L
l=1
Σ−1
l sˆl
, (13)
where Λ = diag([λ1, . . . , λt]) and Σl = diag([σn2,l,
. . . , σ2
Implicit model
In the implicit model, we deduce the true shapes∗from the observation at an initial shapeA(s(0)), which is solving the regression problem,A(s(0))→s∗. With SDM algorithm, it can be decomposed into a set of regressors and fitted recur-sively,
A(s(i))→s(i),
s(i+1)=s(i)+s(i). (14)
Each regressor is modelled linearly by,
s(i)=R(i)A(s(i))+b(i). (15)
The parameters{R(i),b(i)}can be learnt from the training images. Specifically, at theith iteration, the parameters can be learnt by minimising the residual error of regression in the training set,
arg min {R(i),b(i)}
M
k=1
||s(ki)−R(i)Ak
s(ki)
−b(i)||22, (16)
in whichM is the number of training samples.s(ki) is the difference between the current shapes(i)and the true shape
s∗k of thekth training data. In all cases, the initial shapes(0)
for the first regressor is set as the average shape at the aver-age location in the training dataset. The shape samples for training the subsequent regressors are generated by applying the previous regressor,
sk(i+1)=sk(i)+R(i)Ak
s(ki)
+b(i). (17)
In practice, to suppress the over-fitting problem in these situa-tions with high-dimensional features and inadequate training data, a L2 regularisation is applied and the objective func-tion (16) becomes
arg min {R(i),b(i)}
M
k=1
||s(ki)
−R(i)Ak
s(ki)
−b(i)||22+λ||R(i)||22, (18)
whereλcontrols the extent of regularisation. Note that in the implicit model the shape prior is in a nonparametric form and is integrated in the training of the regressors. More details of SDM can be found at Xiong and Torre [16].
To reduce the dimensionality of the descriptors and enhance the fitting performance, instead of using intensity features, a more robust feature descriptor such as histogram of oriented gradients (HOG) [6] can be readily applied on the patches. Denotingh(·)as the feature extraction function, the fitting process can be expressed by
s(i)=R(i)h(A(s(i)))+b(i).
s(i+1)=s(i)+s(i), (19)
with the parameters{R(i),b(i)}learnt in the training data by
arg min {R(i),b(i)}
M
k=1
||s(ki)−R(i)h
Aks(ki)
−b(i)||22+λ||R(i)||22. (20)
Appearance reconstruction, pathology modelling and classification
In the testing stage, the shape of an new object is fitted using the methods presented above. As the pyramidal channels are either redundant or complementary, we can recover the appearance of the object from the DAP. In other words, the objects can be represented compactly by the DAP parame-ters. Specifically, the shape parametersbscan be calculated
by (9) and the appearance parameters bA by (3). For the classification tasks, the correspondence of anatomical fea-tures should be built such that the differences among the descriptors account for the true variations rather than the mis-alignment. In a DAP, the appearance correspondence is built by extracting local features at corresponding landmarks. A classifier predicts the label given an anatomical observation
Φ = [bs,bA], i.e. =arg maxp( |Φ). The most significant variations in the training data{Φ}can be learned by a further PCA and the dimensionality reduced by preserving the sig-nificant components, which span a feature spacePΦ. A DAP therefore can be represented in the feature space by a com-pact set of parametersbΦ, i.e.bΦ = PΦT(Φ− ¯Φ), in which
¯
Φis the mean of{Φ}. UsingbΦas inputs the classifier now predicts =arg maxp( |bΦ). We train the classifier using AdaBoost with 100 learning cycles, with decision trees as the weak learners.
Experiments
Int J CARS
Fig. 4 aMid-sagittal view of a lumbar spine.Grey dashed linesshow the raw axial scans.Red linesshow the aligned disc-level planes, from which the axial images are extracted.bAnatomy of a L3/4 disc-level axial image.cA case with severe central stenosis.dA case with foraminal stenosis
Table 1 Performance of landmark detection by the criteria of PtoBD in pixels and DSC in percentage
Metrics AAM ASM CLM Gauss+LK* Gauss+SDM* Wavelets+SDM*
PtoBD 3.10±1.29 2.51±1.32 2.34±1.15 2.21±1.07 1.95±0.92 1.87±0.73 DSC 90.6±4.9 92.1±5.2 92.4±5.2 92.8±4.0 93.9±3.3 94.7±2.6 * Instances of DAP
are sampled to extract the aligned images. On a disc-level image shown in Fig.4b, conditions of the posterior disc mar-gins (red line) and the posterior spinal canal (cyan line) are typically inspected for the diagnosis. Degeneration of these structures can constrict the spinal canal (pink area) and the neural foramen (yellow area) causing central and foraminal stenosis.
The dataset for validation consists of T2-weighted MRI axial images of 200 patients with varied LSS symptoms. The L3/4, L4/5 and L5/S1 disc-level axial images are extracted, through which we obtain three sets of 200 axial images, 600 images in total. Due to the difference in resolution, all images are resampled to have a pixel space of 0.5 mm. Each image is inspected and labelled with respect to the conditions of central stenosis and foraminal stenosis, respectively. The anatomy is annotated with 37 landmarks outlining the disc, central canal and facet. We evaluate the performances of DAP with two choices of image appearances, i.e. Gaussian versus wavelets, and two choices of fitting methods, i.e. subspace LK versus SDM. We also compare them with three popular models: AAM [3,9] as a standard appearance model, ASM as a widely used shape model, and CLM [4] as a part-based approach.
Results of landmark detection
For landmark detection, we evaluate the performance of DAPs with three configurations: Gaussian appearance pyra-mid with subspace LK as the fitting algorithm, Gaussian appearance pyramid with SDM and wavelet appearance
pyra-mid with SDM. To cover richer pathological variations, we perform the landmark detection on the mixed dataset con-taining all 600 images. We randomly choose 300 images for training and detect the landmarks on the remaining 300. Two metrics are used for the evaluation: the point-to-boundary distance (PtoBD) and the dice similarity coefficients (DSC) of the canal and disc contours. PtoBD calculates the dis-tance of the fitted landmarks to the ground truth contour, which is more accurate over point-to-point distance. DSC is defined as the amount of the intersection between a fitted shape and the ground truth, DSC=2·t p/(2·t p+f p+f n), witht p, f pand f ndenoting the true positive, false positive and false negative values, respectively. It considers both the sensitivity and specificity. The mean results of the methods compared are shown in Table1. We can see that the DAPs with all three configurations outperform the other methods by a favourable margin. In addition, the comparison of the three DAP instances shows that the implicit model with SDM as the fitting algorithm gives better results than the explicit model with subspace LK as the fitting algorithm. Delineating the objects with wavelet appearance pyramids shows further improvement giving the best performance. Several qualita-tive results by the DAP with wavelet pyramids and SDM fitting algorithm are shown in Fig.5.
Results of anatomical classification
[image:8.595.52.545.259.307.2]Fig. 5 Topqualitative results of landmark detection by the DAP with wavelet appearance pyramid and SDM algorithm.Bottomappearance fitted by the wavelet DAP
[image:9.595.56.543.51.219.2]Fig. 6 Average appearance of classes represented by wavelet DAP.aThree grades of central stenosis.bNormal and abnormal in terms of foreminal stenosis
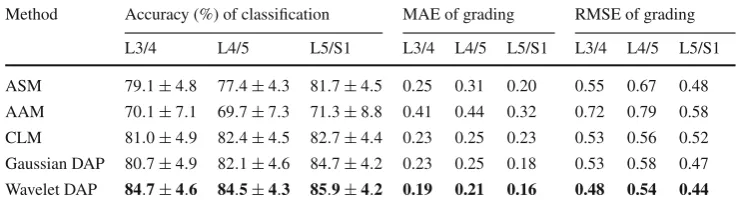
Table 2 Agreement of
classification and grading of central stenosis
Method Accuracy (%) of classification MAE of grading RMSE of grading
L3/4 L4/5 L5/S1 L3/4 L4/5 L5/S1 L3/4 L4/5 L5/S1
ASM 79.1±4.8 77.4±4.3 81.7±4.5 0.25 0.31 0.20 0.55 0.67 0.48 AAM 70.1±7.1 69.7±7.3 71.3±8.8 0.41 0.44 0.32 0.72 0.79 0.58 CLM 81.0±4.9 82.4±4.5 82.7±4.4 0.23 0.25 0.23 0.53 0.56 0.52 Gaussian DAP 80.7±4.9 82.1±4.6 84.7±4.2 0.23 0.25 0.18 0.53 0.58 0.47 Wavelet DAP 84.7±4.6 84.5±4.3 85.9±4.2 0.19 0.21 0.16 0.48 0.54 0.44
The best results are highlighted in bold
compared with a subspace LK method, we use the landmark locations by SDM in the classification tasks and evaluate the accuracy by Gaussian appearance pyramids and wavelet appearance pyramids.
For central stenosis, in each of the three subsets, the morphology of the central canal is inspected and labelled with three grades: normal, moderate and severe. For illustra-tion, the average appearances of these classes delineated by the wavelet DAP are shown in Fig.6a. We randomly pick 100 samples to train the classifier and test on the remain-ing 100 and repeat for 100 times for an unbiased result. The DAP extracted from the detected landmarks are pro-jected onto the feature space and represented by a compact set of parameters (Fig.5, bottom), which are used as inputs of the classifier. The performance of normal/abnormal
clas-sification is measured by accuracy, which is calculated as
[image:9.595.60.542.255.359.2] [image:9.595.176.546.402.505.2]Int J CARS
Table 3 Accuracy (%) of classification of foreminal stenosis
Anatomy ASM AAM CLM Gaussian DAP Wavelet DAP
L3/4 83.3±3.8 73.3±5.5 83.1±4.7 84.3±4.1 85.0±3.9
L4/5 82.4±4.6 76.2±5.8 83.3±4.3 86.9±3.9 87.8±3.5
L5/S1 81.8±4.7 74.5±5.7 82.9±4.5 85.2±4.3 85.7±4.3
The best results are highlighted in bold
DAP gives better performance compared with the popular shape and appearance models. The wavelet version of the DAP enables a further improvement. We believe that the DAP models benefit from its better local feature description and appearance delineation. The further improvement is brought on by the superior properties of wavelets, namely that they are complementary which preserves the full information of discriminating local appearance, and they decompose com-plex textures into simpler feature components.
Conclusion
We presented a multi-scale deformable part model we refer to as a DAP. Several configurations of the DAP are introduced and evaluated, including two forms of pyramids, namely Gaussian pyramid and wavelet pyramid, and two fitting meth-ods namely subspace LK and SDM. The models are applied on the problem of LSS for detecting the landmarks and clas-sifying the pathologies. As the anatomies of cases at varied degree of degeneration are modelled and represented by the same compact parameters and the appearances can be recon-structed by the DAP models, suggested further work includes the combination of DAP and manifold learning methods such as anisotropic statistic modelling [13] to learn and visualise the pathological progress, by learning the most probable paths in the subspace. The DAPs can easily be applied to other anatomical area for clinical use where segmentation and classification are needed.
Compliance with ethical standards
Conflict of interestThe authors declare that they have no conflict of interest.
Ethical approvalAll procedures performed in studies involving
human participants were in accordance with the ethical standards of the institutional and/or national research committee and with the 1964 Helsinki declaration and its later amendments or comparable ethical standards.
Informed consent Informed consent was obtained from all individual participants included in the study.
Open Access This article is distributed under the terms of the Creative Commons Attribution 4.0 International License (http://creativecomm ons.org/licenses/by/4.0/), which permits unrestricted use, distribution, and reproduction in any medium, provided you give appropriate credit to the original author(s) and the source, provide a link to the Creative Commons license, and indicate if changes were made.
Appendix: Derivation of the ML shape
The maximum likelihood shape is the one minimising the energy function,
E(s)=
t
j=1
b2j
2λj + N
n=1
l∈
(xn− ˆx)2
2σn2,l . (21)
We first rewrite it in a compact matrix form. To do so, we add to the equation a summation of zero terms,
N
n=1
l∈
(xn− ˆx)2
2σn2,l , (22)
withxˆn,l assigned with zero values andσn2,l set to be infi-nite. Cn is the relative complement of n in the number set
{1,2, . . . ,L}, indicating the missing levels at thenth
land-mark. The zero terms represent the estimations at landmarks of the trimmed patches in an DAP. The infinite variance value allows the landmark to lie anywhere.
With the zero terms, the energy function becomes
E(s)=
t
j=1
b2j
2λj + N
n=1
L
l=1
(xn− ˆx)2
2σn2,l , (23)
which can be rewritten in a matrix form,
E(s)= 1
2b
T
sΛ−1bs+
1 2
L
l=1
(s− ˆsl)TΣl−1(s− ˆsl), (24)
where Λ = diag([λ1, . . . , λt])and Σl = diag([σ12,l, . . . ,
σ2
N,l]),bsis the vector of shape parameters andsis the shape.
Equation (24) has the typical form of an energy function for shape regularisation, with the difference that the second term is a summation of multiple predictions. Substituting9
into24gives
E(s)= 1
2(s− ¯s)
TPsΛ−1PT
s (s− ¯s)+
1 2
L
l=1
The ML shapesis the one minimising E(s), obtained by solving the equation,
dE(s)
ds =PsΛ
−1
PsT(s− ¯s)+
L
l=1
Σ−1
l (s− ˆsl)=0. (26)
The solution is
s=
PsΛ−1PsT+ L
l=1
Σ−1
l
−1
×
PsΛPsTs¯+
L
l=1
Σ−1
l ˆsl
. (27)
References
1. Antonakos E, Alabort-i Medina J, Zafeiriou S (2015) Active picto-rial structures. In: Proceedings of the IEEE conference on CVPR, pp 5435–5444
2. Baker S, Matthews I (2001) Equivalence and efficiency of image alignment algorithms. In: Proceedings of the 2001 IEEE computer society conference on computer vision and pattern recognition, 2001 (CVPR 2001) vol 1. pp I–1090
3. Cootes TF, Edwards GJ, Taylor CJ (2001) Active appearance mod-els. IEEE Trans Pattern Anal Mach Intell 23(6):681–685 4. Cristinacce D, Cootes T (2008) Automatic feature localisation with
constrained local models. Pattern Recognit 41(10):3054–3067 5. Cristinacce D, Cootes TF (2007) Boosted regression active shape
models. In: BMVC, pp 1–10
6. Dalal N, Triggs B (2005) Histograms of oriented gradients for human detection. In: IEEE computer society conference on com-puter vision and pattern recognition, 2005 (CVPR 2005), vol 1. pp 886–893
7. Ericksen S (2013) Lumbar spinal stenosis: imaging and non-operative management. In: Fischgrund JS (ed) Seminars in spine surgery, vol 25. Elsevier, Edinburgh, pp 234–245
8. Lindner C, Thiagarajah S, Wilkinson J, Consortium T, Wallis G, Cootes TF (2013) Fully automatic segmentation of the proximal femur using random forest regression voting. IEEE Trans Med Imaging 32(8):1462–1472
9. Matthews I, Baker S (2004) Active appearance models revisited. Int J Comput Vis 60(2):135–164
10. Moghaddam B, Pentland A (1997) Probabilistic visual learning for object representation. IEEE Trans Pattern Anal Mach Intell 19(7):696–710
11. Saragih JM, Lucey S, Cohn JF (2009) Face alignment through subspace constrained mean-shifts. In: IEEE 12th international con-ference on computer vision. pp 1034–1041
12. Saragih JM, Lucey S, Cohn JF (2011) Deformable model fitting by regularized landmark mean-shift. Int J Comput Vis 91(2):200–215 13. Sommer S (2015) Anisotropic distributions on manifolds: template estimation and most probable paths. In: Ourselin S, Alexander DC, Westin C-F, Cardoso MJ (eds) International conference on informa-tion processing in medical imaging. Springer, Berlin, pp 193–204 14. Steurer J, Roner S, Gnannt R, Hodler J (2011) Quantitative radiologic criteria for the diagnosis of lumbar spinal stenosis: a sys-tematic literature review. BMC Musculoskelet Disord 12(1):175 15. Wilson R, Spann M (1988) Image segmentation and uncertainty.
Wiley, New York
16. Xiong X, Torre F (2013) Supervised descent method and its appli-cations to face alignment. In: Proceedings of the IEEE conference on CVPR. pp 532–539
17. Zhang Q, Bhalerao A, Dickenson E, Hutchinson C (2016) Active appearance pyramids for object parametrisation and fitting. Med Image Anal 32:101–114