warwick.ac.uk/lib-publications
Original citation:
Coetzee, Iwan, Zabihi, Nima and Gouws, Rupert (2017) Intelligent controller for a cooling
system for a three-phase power transformer. In: International Conference on Electrical,
Electronics, Computers, Communication, Mechanical and Computing (EECCMC), Tamil Nadu,
India, 28-29 Jan 2018 (Unpublished)
Permanent WRAP URL:
http://wrap.warwick.ac.uk/97183
Copyright and reuse:
The Warwick Research Archive Portal (WRAP) makes this work by researchers of the
University of Warwick available open access under the following conditions. Copyright ©
and all moral rights to the version of the paper presented here belong to the individual
author(s) and/or other copyright owners. To the extent reasonable and practicable the
material made available in WRAP has been checked for eligibility before being made
available.
Copies of full items can be used for personal research or study, educational, or not-for profit
purposes without prior permission or charge. Provided that the authors, title and full
bibliographic details are credited, a hyperlink and/or URL is given for the original metadata
page and the content is not changed in any way.
Publisher’s statement:
“© 2018 IEEE. Personal use of this material is permitted. Permission from IEEE must be
obtained for all other uses, in any current or future media, including reprinting
/republishing this material for advertising or promotional purposes, creating new collective
works, for resale or redistribution to servers or lists, or reuse of any copyrighted component
of this work in other works.”
A note on versions:
The version presented here may differ from the published version or, version of record, if
you wish to cite this item you are advised to consult the publisher’s version. Please see the
‘permanent WRAP URL’ above for details on accessing the published version and note that
access may require a subscription.
Intelligent Controller For A Cooling System For A
Three-Phase Power Transformer
Iwan Coetzee
1, Nima Zabihi
2, and Rupert Gouws
11School of Electrical, Electronic and Computer Engineering, North-West University, Potchefstroom Campus, South Africa
2International Automotive Research Centre (IARC), WMG, University of Warwick, Coventry, UK
Abstract—Eskom, the national electricity supplier of South
Africa struggle to supply sufficient amount of power each year. This is partially due to residential consumers that use appliances that required significant amount of power. This results in transformers that overheat which decrease the efficiency of the transformer. Also due to the heat the life expectancy of the transformers decreases. A solution to this problem is to cool the transformer in a controlled manner. This paper therefore provides the design of a controlled cooling system for a three-phase power transformer that is energy efficient and displays the experimental results of this design. The cooling of the transformer make use of a thermoelectric cooling module (TECM) which is controlled by an programmable logic controller (PLC) which receives its data from a PT 100 thin sensors which is placed between the windings and core of the transformer. A prototype model of the actual transformer was used to perform the tests to indicate the cooling results. Solidworks® where used for the transformer simulation which were then implemented based on the results. A Flir thermal image camera was used to confirm the results and is compared to the simulated results. The payback period was determined to see how long the project will take before profit is made.
Keywords— TECM; PLC; transformer; cooling system; solar energy, PT 100.
I. INTRODUCTION
Transformers overheat partial due to residential consumers that require power for their appliances. Eskom, South Africa electricity supplier struggle to supply sufficient amount of power each year for this requirements of the residential consumers according to [1-3]. According to [4] making use of a controlled cooling system which is powered by renewable energy can support Eskom in this power demand form the residential consumers. This study focuses on making cooling systems more energy effective, and it was decided to demonstrate such a system by making use of a 5 kVA, 400 V three-phase power transformer. Transformers lifetime and efficiency decrease due to heat according to [3]. This results in power outages since insufficient power can be delivered to the consumers according to [4]. A controlled cooling system for a transformer can improve the efficiency as well as the lifetime of transformers. This solution can relieve the strain on Eskom and provide the consumers with the required power without power outages.
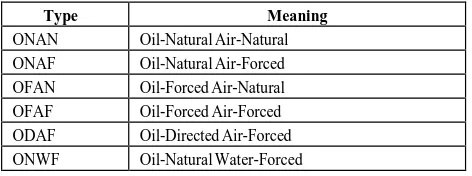
[image:2.595.313.549.294.382.2]There are already several cooling methods available for power transformers which work very sufficiently, but not necessarily energy efficiently according to [4, 5]. They are shown in table 1.
Table 1: Type of Transformers
Type Meaning
ONAN Oil-Natural Air-Natural
ONAF Oil-Natural Air-Forced
OFAN Oil-Forced Air-Natural
OFAF Oil-Forced Air-Forced
ODAF Oil-Directed Air-Forced
ONWF Oil-Natural Water-Forced
A thermoelectric cooling module (TECM) was used as the cooling mechanism and testing it as a cooling device combined with the cooling liquid and pump for a prototype design of the actual transformer. TECMs have also been used as part of an air-conditioning system in a previous project by [6], a TECM holder for vaccines by [7] and for a bulk tank on a dairy farm by [8]. The research for the support of renewable energy was done on solar energy. The cooling system consist of a TECM, PLC, pump and PT 100 sensors which forms the controlled cooling system which must be powered by solar energy. With this background the main problem with this solution lies in the placement of the PT 100 sensors between the core and windings of the transformer as can be seen in figure 3. This means that the transformer design must be done and re-winded with the sensor placed between the two parts. The suggested solution is given in figure 1 to solve this problem. It can be seen with components are required for this system to operate with one another. At a later section the trade-off of each component will be seen and the best option will be replaced back into this figure to form the conceptual design and is then simulated using Solidworks®. The results
obtained from Solidworks® was implemented. As mentioned
the transformer serves as a prototype for the actual transformer used for residential consumers. As most residential consumers are home during peak hours, the solar energy consists of a grid tied interactive topology.
there are radiation as well as for a part into the night to cover the peak time where there is no radiation available.
Figure 1: Basic Suggested Solution
The cooled down transformer was compared to a non- cooled down transformer to see the effect of the efficiency. It is also important to determine whether the use of the cooling system is cost effective. The remainder of this paper consist of a literature review for the components used in the system. Then a description of the transformer is given. Thereafter a methodology that describes how the finding of the solution to the problem was obtained. The results obtained from testing the transformer is displayed and a conclusion on the findings of this study.
II. LITERATURE REVIEW
This literature review describes the components used in designing the system. These components are the TECM, renewable energy, PLC controller and PT 100 thin sensor. Other components not described in this paper are the pump, tube, cooling liquid, and batteries. The literature review will focus only on the components for this solution and not the alternative solutions as mentioned in table 1.
A. Thermoelectric Cooling Module
The TECMs were suggested by the client as cooling devices and have been used in previous final year projects by [6-8] in 2012 as part of a “TECM holder” for vaccines, in 2013 as part of a “Mini TECM Solar Air Conditioning System” and, in 2014 as an “Energy efficient bulk tank.” Thus the investigation was not done in depth as the component has already been supported by other articles. The TECM that was used are a liquid-to-air TECM. The TECM is a device based on the “Peltier effect”. Peltier is a scientist who discovered that when a DC supply is applied the thermocouples, a temperature difference is found between the n- and p-junctions. A liquid-to-air has a hot and cold side. This means that the liquid will get hot and the heat of the liquid was dissipated by the used of the fan attached to the TECM. There are a variety of TECMs available that can be chosen from [9].
B. Renewable Energy
South Africa has a very large area which can be used for solar energy. The solar energy is formed by absorbing the irradiation of the sun. Approximately 10-20% of the irradiation is converted to electrical energy according to [10]. Solar energy was not decided on based on the cost effectiveness but also due to the availability of irradiation. The map of the global horizontal irradiation of South Africa form [11] is considered the most important to evaluate the irradiation in certain regions of South Africa. Form the map approximately 80% of the map the average irradiation is expected to be above 2000 kW/m2 per annum. This means that South Africa is an ideal place for solar energy due to the high availability. In the North-West province, Potchefstroom have an approximately 2100 kW/m2. This means that Potchefstroom have more than sufficient amount of irradiation for the project. There are a variety of different ways in generating electricity by means of solar energy. Examples of photovoltaic panels include: poly-crystalline, mono-crystalline and CIR silicon panels. It was decided to use poly-crystalline panels.
C. Controller
For this system five PT100 thin sensors are placed between the windings and core of the transformer as indicated in figure 2. The controlled received the data from the sensors and based on the temperature, the controller determine whether the TECM and pump must be switched on or off. The controller depends on sensors 1, 2, 4 and 5. Sensors 1, 2, 4 and 5 working together respectively. Both of them are used to verify one another be setting a difference value between them. This is to determine whether one of the sensors is broken and show an error message if the results is bigger than that difference. Sensor 4 and 5 are used to determine the upper and lower limits of the cooling system, for example. If the sensor reaches 100 °C the TECM and pump switch on and the cooling system is active. Once the transformer is cooled to 90 °C the cooling system is deactivated by the controller and the cooling system is off. The controller must also be able to switch between solar energy and backup batteries. This is for the time when no irradiation is absorbed by the solar panels. From the controllers that where considered: Arduino, PLC, PIC and Raspberry PI. It was decided to use the PLC based on its implementation difficulty and its amazing capability with the PT 100 sensor as well as solar energy according to [12].
Figure 2: PT100 Thin Sensor Placements
[image:3.595.372.488.562.676.2]designed to work with the PT100/1000 sensors. Its operation is based on logic control, controlling the system using only a high are low operator. It can also be connected to a PC where an online test can be conducted showing the results on the PC screen.
D. PT100 thin sensor
As mentioned in the controller section PT 100 thin sensors are used to determine the temperature between the core and windings or the transformer. These sensors are specifically designed for this purpose. The “thin” refers to the fact that the sensor is approximately 1.5 mm thick which makes it ideal to slide between the two parts. The sensor operates between -50
°C and 250 °C which is ideal for the prototype design according to [13] but for the actual transformer the PT 1000 thin sensors must be used. The PT 100 thin sensor is shown in figure 3.
Figure 3: PT 100 sensor by (TC Direct, 2012)
E. Remaining components
[image:4.595.336.528.105.231.2]The remaining components for the project are given in table 2 as well as the components listed in the literature review. These components are the pump, tube, cooling liquid and batteries. All these components together form part of the cooling solution. These components are selected form a trade-off for setting certain criteria. For each component four sub-components was chosen to be trade-off against one another.
Table 2: Solution Component
Component Chosen product
Pump Facet Cube Electronic Fuel Pump
Cooling Liquid Ethylene Glycol (Antifreeze)
Tube Arlon: Silicon Rubber plated for thermal
conduction
Batteries Lead-acid battery
Cooling Device TECM
Renewable
Energy 300 W Solar power panels
Controller PLC 0BA6
Controller
expansions AM2 RTD
Sensor PT 100 thin sensor
F. Transformer
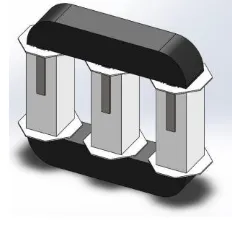
As mentioned the transformer that was be used as the prototype for the actual design was a 5 kVA, 400 V, three- phase power transformer. The transformer was re-winded due to the sensors that were placed between the core and windings of the transformer. As can be seen in figure 4 the sensor
placement is the same as in figure 2 as well as the indication of the mould. The figure also shows that the transformer is re-winded to place the sensor between the windings and the core of the transformer.
Figure 4: Transformer Re-winding
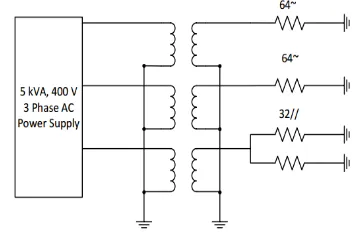
It is required from the client that the transformer is re- winded with a star as primary configuration and an optional delta or star configuration. Thus for this system, a star-star configuration is used with a star load as indicated in figure 5. In figure 5 it can be seen that the load of phase A and B of the transformer is 64 ohm and phase C is 32 ohm. The reason for this is that the transformer would be operated at half load for phase A and B and at full load for phase C.
Figure 5: Load Connection Diagram
Thus to obtain full load two 64 ohm resistors must be connected in parallel to obtain that requirement. As mentioned, a resistor is used to represent the load of the prototype design. In practice the load of phase A and B would be for example a radio and television and phase C load would either be represented by a geyser or oven. The reason for the use of a star-star configuration is due to the complexity is reduced to demonstrate the cooling effect and due to the fact that a neutral wire is available for the safety purposes.
III. METHODOLOGY
[image:4.595.325.501.345.461.2]results comply with the specifications of the client. This paper only contains the design, implementation and results of the system. After conducting the literature review and deciding on the components listed in table 2, the design process needed to be initiated. Thus the transformer which serves as the prototype of the actual transformer used for residential consumers are a 5 kVA, 400 V three-phase power transformer which was connected in a star-star configuration with a star load. The cooling device was selected as a liquid-to-air TECM is LA-115-24-02-0710 from [9]. The tubes of the TECM are connected with the arlon tube and the electronic fuel pump with the ethylene glycol inserted into the tube. The arlon tube is coiled around phase C. Figure 6 shows how the transformer looks in simulation with the tube coiled around phase C.
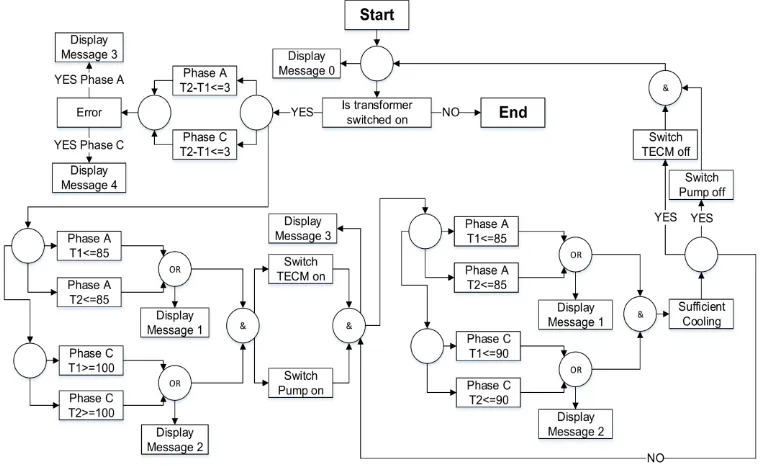
The PT 100 thin sensors place between the windings and core of the transformer and are connected to the PLC which makes the decisions on whether to switch the system on or off. Figure 7 show the operation of the PLC. Once implementation was complete the testing could be initiated. There are three main tests that have to be conducted and then calculations must be done based on the test results to determine whether the system is more efficient. The three tests are listed below.
- Test 1: The first test is to do an open and a short circuit test of the transformer. This is to calculate the core and copper losses of the transformer.
- Test 2: The second test is preformed to obtain the base values for each phase. The controller is set to only obtain the values. The base values are the temperature, current and voltage. The values are obtained in 5 minutes intervals for 400 minutes. The efficiency is then calculated which is the base efficiency.
- Test 3: The final test is preformed to obtain the cooling values for each phase. The controller limits
[image:5.595.357.508.121.216.2]are set based on the base values obtained in test 2. The values are the temperature, current and voltage. The values are obtained for 5 minutes intervals for 400 minutes. The efficiency is then calculated for this test and was compared to the efficiency of test 2.
Figure 6: Transformer with Silicone Rubber Tube
IV. EXPERIMENTAL RESULTS
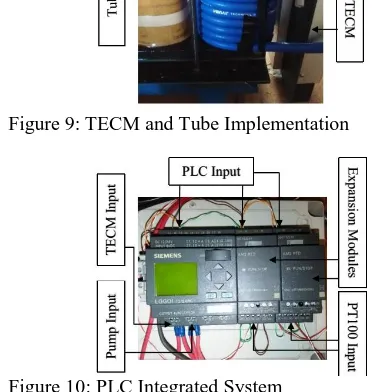
This section discusses the results of the three tests that were performed. The tests were performed on the prototype as shown in figure 8. The figure shows the complete integrated system. The TECM is placed against the tube for more heat conduction. The tube can be seen is coiled around phase C. It can also be seen that the TECM is connected to the pump and to the tube. Figure 9 display the tube that was coiled around the phase. It can also be seen that the TECM was placed against It is for the most heat to be absorbed by the heat sink on the TECM.
[image:5.595.108.488.452.685.2]The PLC connection is shown in figure 10. It also shows that two AM2 RTD expansion modules are used which is made specifically for the PT 100/1000 sensor. The result of the first test is shown in table 3. It shows the total losses of the core, copper compared to the experimental and simulated values.
Figure 8: Complete Integrated System
Figure 9: TECM and Tube Implementation
Figure 10: PLC Integrated System
These losses form part of the input power. The second and third test show the temperature over time for the controlled system as shown in figure 11. It can be seen that phase A and B is operated at half the load and phase C at full load. It can also be seen that the temperature of phase C increases much faster than phase A and B. It can also be seen that from the PLC the upper limit is set to 100oC and the lower limit to
90oC. Thus phase C temperature regulates between these two
values. It can also be seen that the effect of the cooling have an influence on phase B. Figure 11 illustrates the cooling system on and off switching when the upper and lower limits was reached. It can also be seen that this cooling system also have an effect on phase B temperature.
Table 3: Copper and Core losses Simulated and Experimental
Losses Base Experimented (W)
Cooled
Experimented (W) Simulated (W)
Core losses 110 101 105
Copper losses 54 47 50
Total 164 148 155
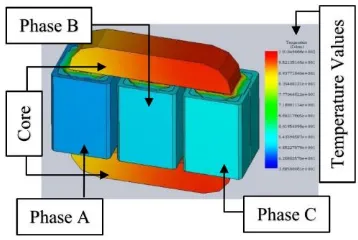
[image:6.595.329.526.136.507.2]Figure 12 shows the baseline temperature and cooled test temperature values. Figure 15 was used to obtain the values for the PLC and figure 14 was obtained from that settings. Figure 12 values for both tests for each phases is confirmed with a Flir thermal image camera. The reason for this is due to the magnetic field of the transformer that has an influence on the value obtained from the PT 100 sensors.
Figure 11: Cooling System Temperature
Figure 12: Baseline and Cooled Temperature
The number after the symbol a and b of figure 13 represent a phase. Thus 1 represents phase A, 2 represents phase B and 3 represent phase C.As can be seen that phase A temperature of the base test the Flir camera value is 71.5oC compared to
73oC shown in figure 15. Phase B temperature of the Flir
camera is 76.1oC compared to 78oC. Phase C temperature of
the Flir camera is 107.8oC compared to 106oC. For the cooled
test the phase A values is 66.2oC compared to 66oC of figure
15. Phase B temperature value of the Flir camera is 66.8oC
compared to 66oC. Phase C temperature value of the Flir
camera is 74.3oC compared to 91oC. The reason for the
[image:6.595.47.233.265.461.2]implemented system shown in figure 14. The results is based on figure 7. This values obtained is compared to the Flir thermal image camera results (figure 13) and the actual results (figure 11).
To calculate the efficiency of the transformer the ratio of the output to the input must be calculated. This is for ideal transformer. For non-ideal transformers the core and copper losses must also be taken into consideration. Equation 1 and equation 2 display the efficiency equation for ideal and non-ideal transformer respectively according to [14].
(1)
(2)
a.1) a.2)
a.3) b.1)
[image:7.595.342.521.52.172.2]b.2) b.3)
Figure 13: Flir Results a) Baseline b) Cooled
Figure 14: Implementation Results
Where Po is the output power, Pin is the input power, Pcu
is the copper losses and Pc is the core losses. The losses of the
system are given in table 2. The output power is calculated as:
(3)
Where a is the turn ratio of the transformer and cosθ is the power factor of the system.
Table 4 show the baseline efficiency, cooled efficiency and the difference increase in efficiency. This efficiency is without the use of solar energy for the cooling system.
Table 4: Efficiency of baseline test and cooled test
Type Efficiency (%)
Baseline 88.49
Cooled 89.39
Improvement 0.9
The efficiency for phase A baseline and cooled is given in figure 15. The efficiency for phase B baseline and cooled is given in figure 16. The efficiency for phase C baseline and cooled is given in figure 17. Form all three figures, 15-17, it can be seen that the Linear (Base Efficiency Phase B) gradient of the cooled values is greater than of the baseline Linear (Cooled Efficiency Phase B) values. This indicates that the efficiency of the transformer does increase.
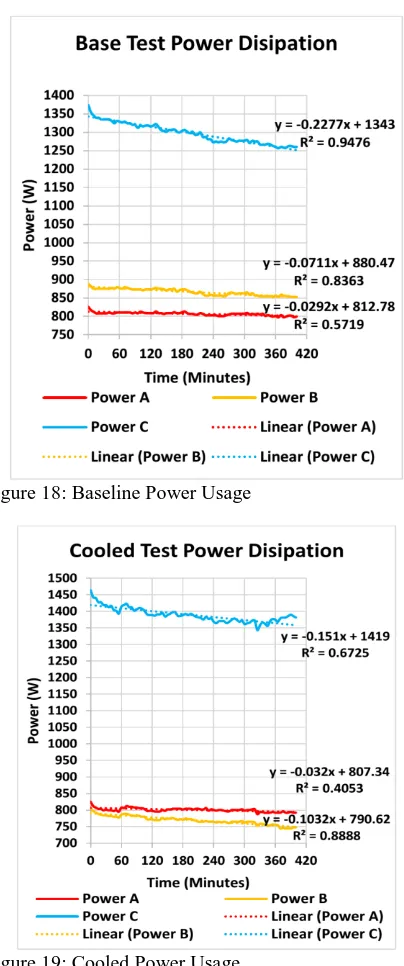
The power usage for the baseline test and cooled test are displayed in figure 18 and 19 respectively. It can be seen that the power for each phase is calculated separately and that phase shifts is ignored.
The implementation can get very expensive, thus table 5 shows the total expenses for the project using:
Base components without implementation of the cooling system.
Cooled components without the implementation of solar energy
Cooled components with the implementation of solar energy.
[image:7.595.40.288.176.709.2]Figure 15: Phase A Efficiency
Figure 16: Phase B Efficiency
[image:8.595.329.531.46.529.2]Figure 17: Phase C Efficiency
Figure 18: Baseline Power Usage
Figure 19: Cooled Power Usage
According to [15] the price per unit for a residential area is R 1.15 VAT included. Making the following assumption that the price per unit will be kept the same for the entire period, the payback period can be calculated as:
(4)
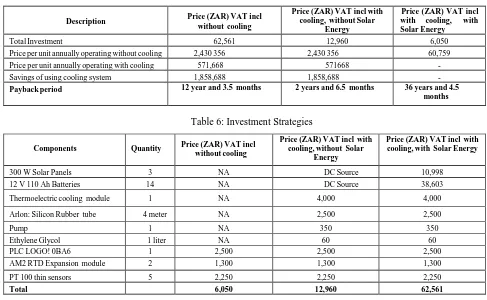
Table 5 displays the total investment, the savings of using the cooling system and the total savings. Using table 6 together with figure 18 and 19 also with the assumption made the payback period is calculated using equation 4. Table 6 also contains the payback period.
Table 5: Investment results
Description Price (ZAR) VAT incl without cooling
Price (ZAR) VAT incl with cooling, without Solar
Energy
Price (ZAR) VAT incl with cooling, with Solar Energy
Total Investment 62,561 12,960 6,050
Price per unit annually operating without cooling 2,430 356 2,430 356 60,759
Price per unit annually operating with cooling 571,668 571668 -
Savings of using cooling system 1,858,688 1,858,688 -
Payback period 12 year and 3.5 months 2 years and 6.5 months 36 years and 4.5 months
Table 6: Investment Strategies
Components Quantity Price (ZAR) VAT incl without cooling
Price (ZAR) VAT incl with cooling, without Solar
Energy
Price (ZAR) VAT incl with cooling, with Solar Energy
300 W Solar Panels 3 NA DC Source 10,998
12 V 110 Ah Batteries 14 NA DC Source 38,603
Thermoelectric cooling module 1 NA 4,000 4,000
Arlon: Silicon Rubber tube 4 meter NA 2,500 2,500
Pump 1 NA 350 350
Ethylene Glycol 1 liter NA 60 60
PLC LOGO! 0BA6 1 2,500 2,500 2,500
AM2 RTD Expansion module 2 1,300 1,300 1,300
PT 100 thin sensors 5 2,250 2,250 2,250
Total 6,050 12,960 62,561
As indicated on the figure 20, it would take approximately 12 years and 4 months with correspond to the calculated value of 12 years, 3 months and 2 weeks for the total investment with solar energy. Making use of the cooling system without any support of the solar energy results in a total payback period of 2 years and 7 months compared to the actual of 2 years, 6 months and two weeks. By making only use of the components for the base test results in a total payback period of 36 years and 4 months compared to the actual value of 36 years, 4 months and 2 weeks.
V. DISCUSSION
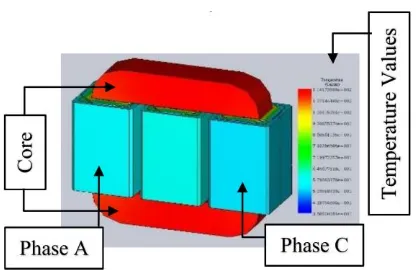
The results can be interpreted for an actual transformer used for residential use. If all the phases were to be operated at full load and have a TECM for each phase and cooled with ethylene glycol. Figure 6 shows the implemented transformer and figure 21 shows the results of implemented transformer. The temperature for this configuration is approximately 155 °C before it is cooled down. After the transformer is cooled down the temperature is approximately 115 °C. The PLC can be set to switch separately for example if only one phase reaches the upper limit temperature the specific phase can be cooled down, or it can be set if one phase reach the upper limit temperature all the phases can be cooled down. As mentioned the TECM, PLC, pump and sensors form part of the solar energy. The simulations done for the solar energy are based on the prototype. Thus this means that the four components will have a total output power of 160 W, as indicated in table 7. It was decided that the transformer will operate 24 hours a day, resulting in 3.84 kW/day. The solar panels to use was decided
[image:9.595.339.519.437.603.2]to be 300 W which is more than enough since only 160 W is needed. The batteries that was used is ten 12 V, 110 Ah battery. The calculations for the batteries were done when the least irradiation is available which is in June as can be seen from figure 22.
Figure 20: Payback Period
Table 7: Solar Power Requirements
Component Power (W)
TECM 139
PLC LOGO! 0BA6 3
Facet Electronic Fuel Pump 15
PT 100 sensors 3
Figure 21: Three TECM Cooling Transformer, 1 per phase. Result of implemented transformer
The figure also shows the available energy from the solar panels and the required energy from the consumer. The simulations were done using PVSyst®. The price for the
[image:10.595.59.267.48.183.2]required solar panels are R 10,998 and the batteries are R 38,603 based on quotations received during 2015 by [16]. As mentioned the panels are selected as 300 W panels, this is due to the fact that there is energy required to charge a discharge the batteries. Figure 23 show the energy required to do this operation.
Figure 22: Solar Power Simulation
Figure 23: Charge and Discharge of Batteries Power
VI. CONCLUSION
The main purpose of this project was to design an intelligent controller for a cooling system for a three-phase power transformer. As can be seen from the results, the cooling system decreases the temperature of the transformer which in result increase the efficiency of the transformer. It can be seen that compared the actual results, the Flir thermal image camera results and the simulated results that the temperature is in a small margin with one another. The results that have a larger difference can either be due to the magnetic field of the transformer, the tube that is coiled around the cooling phase. It can also be due to an insufficient environment created in the simulation software. It was clear that if the cooling system is operated with solar energy, it would take approximately 10 years longer before profit is made compared to if solar energy is replaced by DC sources. If the transformer would have been operated at full load, three TECMs would have been used for the cooling purposes of the transformer as indicated in figure 21. The total decrease in temperature would be approximately 30 °C.
References
[1] Bonisa, T. C. H., 2013. Eskom holdings SOC limited. Std. Pp., Dec. 2013.
[2] Debba, P., 2010. Forecasts for electricity demand in South Africa using the CSIR sectoral regression model, Pretoria, Jun., 2010.
[3] Electrical4U, 2015. Transformers cooling systems and methods. [Online] Available at: http://electrical4u.com/transformer- cooling-system-and-methods/ [Accessed 2 February 2017].
[4] Perez, J., 2010. Fundamental principles of transformers thermal loading and protection, ERLPhase Power Technologies, Winnipeg, Tech. Rep., 2010.
[5] EPEC, 2009. Guide to power transformers specification issues. 2 ed. Christchurch, NZ, Jan., 2009.
[6] De Waal, B., 2013. Mini TECM solar air conditioning system, NWU, Potchefstroom, South Africa.
[7] Eilers, H., 2012. TECM cooling holder, a review on TECMs: Installations, performance and efficiency, Potchefstroom.
[8] Pelser, W. A., 2015. Design of an intellegent controller for a renewable energy efficiecnt bulk storage tank. SAUPEC, pp 437-434.
[9] Laird Technologies., 2010. Thermoelectric assembly, America, 2010, pp 4-5.
[10] Secondary Energy Infobook., 2009. The need project, Manasas, pp 42. [11] SAAEA, 2012. New most detailed solar resources map of South Africa.
[Online] Available at: http://saaea.blogspot.com/2012
[12] Amunrud, A., 2002. Programmable logic controllers, Pretoria: Siemens, Paper. EE 367, Feb. 2002.
[13] Reissmann Sensortechnik., 2015. PT100, PT500, PT100 datasheet, [Accessed March 2015].
[14] Guru, B. S. and Hiziroglu, H. R., 2001. Electric machinery and transformers. 3 ed. New York: Oxford University Press.
[15] ESKOM, 2015. Tariffs and Charges 2015/2016, South Africa, ESKOM, April, 2015, pp 31.
[image:10.595.45.278.329.675.2]