1
Microstructure dependence of performance degradation for intermediate temperature solid oxide fuel cells based on metallic catalyst infiltrated La- and Ca-doped SrTiO3 anode support
C. S. Ni†, L. Y. Lu†, D. Miller, M. Cassidy and J. T. S. Irvine* School of Chemistry, University of St Andrews
KY16 9ST, St Andrews, United Kingdom *[email protected]
†Ni and Lu are equal contributors to this work.
Abstract
Anode-supported solid oxide fuel cells with the configuration of La0.2Sr0.25Ca0.45TiO3 (LSCTA-)
anode, YSZ electrolyte and La0.8Sr0.2Co0.2Fe0.8O3 (LSCF)-YSZ cathode were fabricated using tape
casting and co-sintering techniques followed by pre-reduction and impregnation. In order to improve the performance, the active anodes were prepared via the wet impregnation of metallic catalysts (Ni or Ni-Fe solution). The impregnation of 3 wt.% nickel significantly improved the fuel cell performance from 43 mW/cm2 for the bare LSCTA- anode to 112 mW/cm2 for the Ni-LSCT
A-anode at 700 oC in humidified hydrogen containing 3 vol.% H2O. More interestingly, the
2
Introduction
Solid oxide fuel cells are electrical generation devices that convert the chemical energy directly into electricity through the electrochemical reaction between a fuel and an oxidant. They have been considered as the most efficient, cleanest power-generation systems1,2, offering the great prospects for the direct utilization of a wide variety of hydrocarbon fuels3~5. The most commonly used anode material in SOFC is the porous Ni-YSZ cermet, usually used in conjunction with an yttria-stabilised zirconia (YSZ) electrolyte. The nickel provides both the electronic conducting pathways and the electrocatalytic activity for fuel oxidation, the YSZ acts as the oxygen ionic conductor and provides a measure of structural stability6 , 7. However, Ni-YSZ anodes were found to show serious degradation when using hydrocarbon as fuel due to carbon deposition8 and sulphur poisoning9. The
degradation of Ni-YSZ anode is also aggravated by the agglomeration and sintering of nickel particles under the operation condition10, which is the critical issue limiting the development of Ni-YSZ cermet anode.
To overcome the problems related to the Ni-YSZ anode, A-site doped strontium titanate based perovskites have been developed owing to their high electronic conductivity and good volumetric stability in reducing atmospheres11~13. In the earlier work, La-substituted SrTiO
3 (LST) exhibited a
high electrical conductivity over 100 S/cm in reducing atmosphere14 after a pre-reduction at elevated temperatures. However, LST was known to exhibit a limited ionic conductivity and a poor catalytic activity for fuel oxidation15. These weaknesses could be compensated by infiltration of
metal catalyst as well as an ionic conductor, such as GDC, into the perovskite scaffold. Remarkable performance has been reported using A-site deficient titanate-based anode infiltrated with nickel, copper or ruthenium with additional ceria phase16~19; for example with Ni and CeO2-impregnated
pre-reduced La0.2Sr0.25Ca0.45TiO3 (LSCTA-) anode composite, a power density of 960 mWcm-2 was
achieved at 800 oC for the cells when humidified hydrogen was used as fuel19.
For an SOFC working continuously for forty-thousand hours, a high durability is critically important, especially for electrodes with nano-particles via infiltration method20. The reason for the
degradation of an electrode prepared by infiltration has been so far ascribed to the morphology variation of the impregnated coatings on the scaffold surface that leads to the decrease of effective reaction sites, as seen extensively during stability testing of cathode materials21~23. Similarly, for the titanate perovskite anode, a strong degradation was also observed and has been mainly attributed to the increase of polarization resistance24,25. For example, a short-stack electrolyte-supported based on LSCTA- anode of 100 cm2has been tested at 800 oC and 900 oC and severe degradation of cells
has been observed though an initial power output of 3.3 kW has been obtained26. However, the
interaction between the titanate scaffold and the impregnates has never been studied. It has been known that YSZ scaffold structure could be modified by treatment in hydrofluoric acid27, therefore titanate might topographically react with the nitrate solution during impregnation and the subsequent firing process. This in turn may affect the subsequent interaction between titanate and catalytic metal during the operation of anode and provide an alternative mechanism for the degradation. Therefore, an in-depth survey on the infiltrated anode is required, allowing an improved understanding of the microstructure-performance relationship not only on the catalyst morphology but also on the scaffold-catalyst interfacial reaction. We utilised a focussed ion beam (FIB) sectioning and polishing technique for cross-section preparation to reveal the interface between the catalyst and titanate. As it is very difficult to reveal the interaction between impregnates and scaffolds on the surface morphology the ion preparation techniques have the advantage of minimising surface damage associated with mechanical techniques and offer the possibility of revealing the sub-micron scale detail that occurs underneath the surface of this interface.28 For the first time we found that the interior morphology near the surface after the annealing process would be playing an important role in the degrading mechanism. In this paper, we present some stability studies on LSCTA- anode-supported fuel cells with Ni or Ni-Fe infiltrated
3
back-scattered electron (BSE) and transmission electron microscopy (TEM) on the cross-section of the the ion beam etched samples.
Experimental
La0.2Sr0.25Ca0.45TiO3 (LSCTA-) powder was supplied by Topsoe Fuel Cells as part of the EU
FCH-JU project SCOTAS and was calcined at either 1100 or 1250 oC for 5 h to tailor the powder properties to obtain the compatible shrinkage process with dense YSZ, described elsewhere19.
Button fuel cells were fabricated by an organic based tape casting technique with co-sintering of dense YSZ electrolytes bonded with porous anode and cathode skeletal structures (LSCTA- and
YSZ respectively). To optimise the interface of the sintered LSCTA- anode and YSZ electrolyte,
co-casting of the LSCTA- and YSZ green tapes was employed, where the LSCTA- wet tape slip was cast
on the top of the thin dried YSZ green tape. After drying, the green tapes were cut into an appropriate size and laminated to form the complete cell skeletal structure, followed by co-sintering at 1350 oC in air. This process is described in greater detail elsewhere 19.The sintered samples of 2 cm in diameter were subjected to a reduction process at 900 oC for 12 h in a 5 % H2-Ar atmosphere.
Upon reduction, the colour of LSCTA- changes from light yellow to black.
The cathode side of pre-reduced samples were impregnated with precursor solutions containing La0.8Sr0.2Co0.2Fe0.8O3 (LSCF) and fired at 450 oC in air to decompose the nitrate but avoiding the
re-oxidation of LSCTA-. The loadings of impregnates in the YSZ cathode were 20-25 wt.% LSCF.
Anode catalyst materials including Ni and Ni0.75Fe0.25 were impregnated into the porous LSCT
A-scaffold using solutions of Ni(NO3)2.6H2O (Newburyport, MA USA) for the former and with
additional Fe(NO3)3.9H2O (Sigma-Aldrich, USA) mixed at a 3:1 mole ratio of Ni:Fe for the latter.
A small addition of triton surfactant was added to aid impregnation. Multiple cycles of impregnation and calcination at 450 oC were used until the desired loading of impregnates of oxides was reached.
Counter electrode
Exhaust Fuel (N2, H2, steam)
Air
Working electrode
Cathode
Ceramabond
YSZ electrolyte Furnace
Anode Silver
Paste
[image:3.595.69.370.443.615.2]Alumina tube Suspended sample Attached silver net
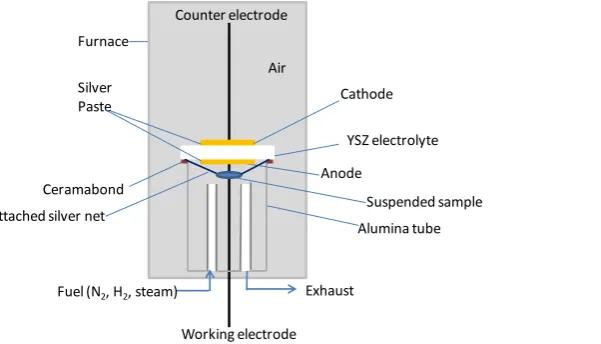
Figure 1 Schematic of simulated fuel cell operation atmosphere for reduction of metallic catalysts
In order to identify the phases obtained from the impregnated materials at different atmospheres, Ni(NO3)2.6H2O and Fe(NO3)3.9H2O were dissolved into deionised water to prepare nickel nitrate
and nickel-iron nitrate solutions at a molar ratio of 3: 1 with addition of citric acid. These solutions were subsequently agitated and heated to 150 oC for combustion, followed by calcinations in air at 450 oC for 30 min, in exactly the same manner as the heat treatment of the impregnated catalysts in the porous anode scaffold. A fraction of this calcined powder was reduced at 900 oC for 12 h in a
5 % H2-Ar atmosphere. The powders calcined at 450 oC in air and reduced at the atmosphere with
4
Another fraction of this calcined powder was pressed into a pellet and suspended into an alumina tube, which was sealed by a thick YSZ pellet with two silver wires attached onto two electrodes on either side. The atmosphere in the tube can be controlled by adjusting the flow rates of steam, hydrogen and nitrogen on the sealed side and the partial pressure of oxygen monitored by the OCV measured on the silver electrodes across the YSZ pellet, as shown in Figure 1. By adjusting the flow rates of the gases (H2, N2 and steam), an OCV value between 0.55-0.6 V versus the ambient air at
the cathode side (P(O)2 =0.21 atm) at 700 oC was obtained. This corresponds to an oxygen partial
pressure of ~10-13 Pa to which the calcined powder was exposed to for 12 hours.
With respect to the button cells, after the electrodes being impregnated with the precursor solutions and attached with silver wires on the electrodes, the fuel cells were directly mounted and sealed onto an alumina tube. A gas flow of Ar containing 5 % H2 was passed over to the anode in order to
avoid the re-oxidation of the anode upon heating to test temperature of 700 oC, before switching to humidified hydrogen (3 % H2O). Electrochemical tests were carried out using both DC and AC
impedance techniques, the latter over the frequencies between 100 kHz and 0.04 Hz using a combination of Solartron 1255 Frequency Response Analyser and Solartron 1287 Electtrochemical Interface. To reveal the morphology samples were cut by Leica EM TIC 3X Triple Ion Beam Cutter System and were analysed by JEOL 6700 scanning electron microscopy (SEM) with energy dispersive X-ray analysis (EDX) to investigate the interactions between catalyst and scaffold prior to testing and after testing. JEOL TEM 2011 transmission electron microscopy equipped with Oxford Isis EDS detector was also used to analyse the detailed microstructure and chemical composition of the bimetallic Ni-Fe impregnated anode. The TEM samples were prepared in the following way: at first, the samples were fixed into Gatan G-1 epoxy to protect the surface structures; then the cured samples were cut and thinned to electro transparency by mechanical grinding and focused ion beam polishing.
Results and discussion
Configuration of the cells
LSCTA-anode
10mm
100mm
YSZ electrolyte YSZ
cathode
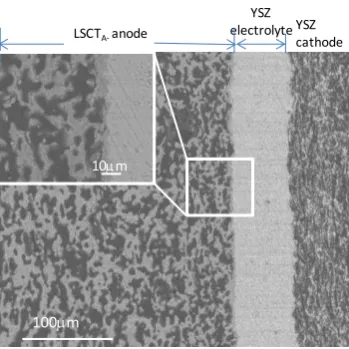
Figure 2 Back-scattered electron (BSE) image of the cross section of the cell after reduction, showing the anode to the left and the cathode to the right of the dense YSZ electrolyte. The inset is the magnified image of the anode/electrolyte interface, as shown in the rectangle.
[image:4.595.62.237.472.647.2]5
accompanied with the loss of oxygen would threaten the bonding between the anode and electrolyte. Fortunately, the microstructure indicates that neither volumetric change during the reduction at 900
oC nor thermal cycles in air between 450 oC and room temperature during the infiltration process
did any harm to the integrity of the fuel cell. The coarse pores are observed in the anode support, which are sufficient to provide pathways for fuel transport into the functional layer at the interface of electrode and electrolyte. The inset of Figure 2 is the magnified BSE image of the electrolyte/anode interface. It demonstrates that a good intimacy has been successfully formed between the perovskite anode and the YSZ electrolyte by co-casting and co-sintering techniques. A thin but indented LSCTA- layer closely attached to YSZ electrolyte could provide more surface area
to support the anode electrochemical reaction on the electrolyte/anode interface, where YSZ, LSCTA- and fuel meet together, going some way to mitigate the lack of ionic conductivity in the
LSCTA- and promote the transport and exchange of oxygen ions from the YSZ electrolyte within
the LSCTA- anode.
Initial performance
0 1 2 3 4 5
0 -1 -2 -3 -4 -5 LSCT Ni-LSCT NiFe-LSCT A-Z ''/ cm 2
Z'cm2
400Hz
0.32Hz 0.4 0.5 0.6 0.7 0.8 0.9 1.0 0.0
-0.1 -0.2 -0.3
250Hz
0.0 0.2 0.4 0.6 0.8 1.0 0.0 0.2 0.4 0.6 0.8 1.0 1.2 LSCT Ni-LSCT NiFe-LSCT A-E/ V I/Acm-2 0.00 0.05 0.10 0.15 0.20 0.25 0.30 P/ W c m -2
(a)
(b)
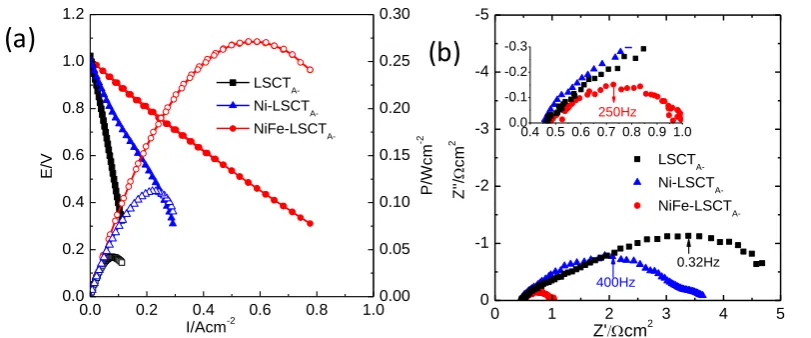
Figure 3 (a) I-V and I-P curves and (b) EIS curves of the cells tested at 700 oC in humidified hydrogen (3 % H2O) with different anodes: LSCTA- backbone, Ni and Ni-Fe impregnated LSCTA-.
I-V and I-P curves in (a) are signified by solid and open symbols, respectively. The inset in the Nyquist plots magnifies the high-frequency intersection with x-axis.
The initial performances of the fuel cells without catalyst, and with 3 wt.% nickel and 3 wt.% Ni-Fe on the anode at 700 oC are shown in Figure 3. All the three cells show an open circuit voltage (OCV) of 1.02 V (Figure 3(a)), which is slightly lower than the theoretical OCV of 1.09 V from Nernst equation using humidified H2 containing 3 % H2O, which could related to the cross-over of gas
between the cathode and anode and the low catalytic activity of the anode. The power density of the cell without catalyst showed a maximum power density of 43 mW cm-2, and the addition of nickel to the bare LSCTA- anode doubles the peak power density to 112 mW cm-2. Compared to the cell
[image:5.595.64.470.279.448.2]6
cell confirms that the high electrode losses can be attributed to the bare LSCTA- anode since the
contribution of Rp from the cathode is minor, less than 0.06 cm2 at 80 hours (see Figure S1 in the
supplementary). This result is consistent with what has been reported for infiltrating LST30 ,31, LSTM32 and LSCM 33~35 as anodes. The simulated spectra were shown in Figure S2 and it can be seen that the three cells show a similar series resistance, Rs, The polarization resistance of the cell
without catalyst, with Ni catalyst and Ni-Fe catalyst is 5.09, 3.22 and 0.53 cm2, respectively by
adding up R1, R2 and R3 (if any) for the arcs at difference frequencies. For the cell with Ni
impregnated anode, three arcs with characteristeic frequencies above 1 kHz (High frequency), on the scale of 100 Hz (intermediate frequency) and below 1 Hz (low frequency) can be easily distinguished, while the cell with bare LSCTA- showed an merged arc at high- and intermediate
frequencies. According to the previous study, the high- and intermediate-frequency arc can be assigned to the charge transfer process on the electrolyte/anode interface and the low frequency arc could be related to dissociative adsorption of gaseous species and surface diffusion.19,36 From the simulated parameters shown in Table S1, the addition of Ni on the bare LSCTA- anode decreases the
charge transfer process while expedites the adsorption of gaseous species and surface diffusion process and this could be related to the catalyst/LSCTA- interface that blocks the charge and ion
transport. Surprisingly, the impedance spectra for the cell with Ni-Fe co-infiltration showed only one arc at intermediate frequency. The enhancement by impregnation of bi-metal can possibly be
attributed to the better microstructure in the bi-metal system: the addition of a small amount of Fe into Ni could significantly decrease the aggregation of Ni and improve the number of active sites on Ni and the activity of those sites by decreasing the activation energy. In this case, both the charge transfer and the diffusion process are accelerated by the Fe addition37.
Initial stage stability test
0 10 20 30 40 50 60 70 80 0.1
0.2 0.3 0.4 0.5 0.6 0.7 0.8
LSCT
A-Ni-LSCT
A-E
(V
)
Time(Hour)
NiFe-LSCT
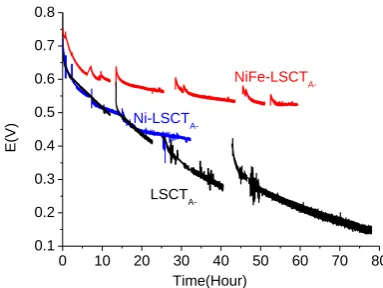
A-Figure 4 Time dependence of voltage of the varied anodes at 700 oC in humidified hydrogen (3% H2O) under different current densities: 60, 130, and 280 mA/cm2 for LSCTA- backbone, Ni and
[image:6.595.67.259.573.717.2]7
As well as the initial performance, the chronoamperometric tests of the three cells without catalyst, and with Ni or Ni-Fe as catalyst were also examined and the voltage variations with time at current densities of 60, 130, and 280 mA/cm2 for the LSCTA- backbone, Ni and Ni-Fe impregnated cells,
respectively, at 700 oC are shown in Figure 4. These current densities were set to give a starting voltage ~0.7 V, the working potential of actual SOFC, in each of the cells. The LSCTA- backbone
shows a drastic degradation from 0.65 V to 0.15 V in 80 h, which has so far been attributed to the re-oxidation of the scaffold under relatively high oxygen partial pressure resulted from the transporting oxygen ions at the low voltages. The partial oxidation of LSCTA- surface causes a
decrease in both ionic and electronic conductivities, and therefore results in a deterioration of the performance. The degradation rate of the cell catalyzed with pure nickel is much faster than that with nickel-iron composite. Within 32 hours, the voltage of Ni-LSCTA- cell drops below 0.45 V,
while that of Ni-Fe composite impregnated LSCTA- cell stabilizes at 0.53 V after 60 hours. The
prevention of the nickel aggregation by the addition of iron could be one of the reasons responsible for the improved stability37. The OCV of the three cells tested at intervals during the stability testing is stable, about 1.03 V, throughout the whole testing duration, which indicates the decrease of the voltage is coming from the area specific resistance of the fuel cell under constant fuel utilization. It should be noted that the performance of all the three cells slightly increases even after the short-time intermediate relaxation at OCV. It also can be seen that all the three cells show a similar degradation rate at the first 20 h, but as the time on test increases the impregnated samples demonstrate a trend to a reduced degradation rate compared to the specimen without catalyst: the presence of catalyst on the LSCTA- backbone prevents the further deterioration of the anode
performance. The impedance spectroscopy data after the cell relaxed to OCV were simulated and the results were presented in Table S2 to S4. It can be seen that the degradation for the cell with bare LSCTA- and Ni catalyst is mainly from the increase of charge transfer resistance while the cell
with Ni-Fe co-infiltration remains very stable. It should be noted that the addition of catalyst could be beneficial to the preservation of Rs while the cell with bare LSCTA- is subject to the increase of
ohmic resistance, and strong indication of oxidation process under bias that decreases the conductivity of the anode.
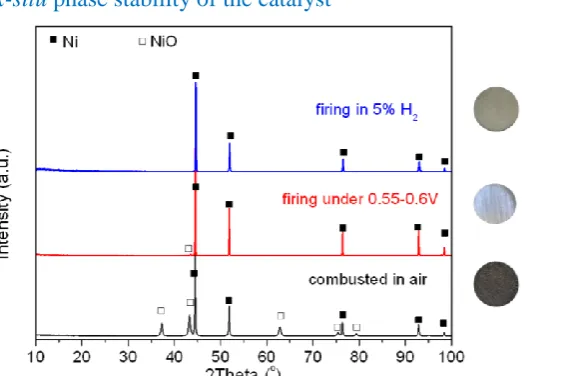
[image:7.595.67.357.465.653.2]Ex-situ phase stability of the catalyst
Figure 5 XRD patterns of the prepared Ni(O) powder calcined at 450 oC and reduced in 5 % H2-Ar
or in N2-H2-H2O with oxygen partial pressure of 10-13 Pa (equivalent to 0.55-0.6V vs air)
The effect of different atmospheres on the phase evolution of the catalyst was of interest, so nickel nitrate solution calcined at 450 oC in air for 30 min was reduced under various oxygen partial pressures for 12 h. These were a 5% H2-Ar atmosphere and an oxygen partial pressure of 10-13 Pa
generated by mixing N2, H2 and steam. As displayed in Figure 5, after annealing at 450 oC, the
8
[image:8.595.57.321.555.764.2]reducing condition caused by combustion of citric acid. Upon reduction, the sample becomes brown and metallic, and is composed of a single phase of metallic nickel. Therefore, during the stability testing, the catalyst in the anode is likely to be metallic nickel rather than nickel oxide.
Figure 6 XRD patterns of the prepared Ni-Fe compound calcined at 450 oC and reduced in 5 % H2
-Ar or in N2-H2-H2O with oxygen partial pressure of 10-13 Pa (equivalent to 0.55-0.6V vs air)
In order to gain a better understanding as to the effect of iron on reduction and phase composition of the catalyst under an operation equivalent atmosphere, nickel and iron nitrate solution calcined at 450 oC in air for 30 min was subsequently reduced in either 5% H
2-Ar or at an oxygen partial
pressure of 10-13 Pa generated by a mixture of N2, H2 and steam for 12h. The mole ratio of Ni to Fe
in this study is 3:1. Figure 6 shows XRD patterns of Ni-Fe compound under different conditions. Before reduction, the sample powder is in brown colour on the exterior. The main phases include NiO, NiFe2O4 and Ni; however, a small diffraction peak, attributed to cubic Fe2O3 phase (JCPDs
00-002-1047), was also detected. Upon reduction in argon containing 5 % hydrogen, the sample becomes metallic colour, the diffraction peaks of which can assigned for cubic awaruite FeNi3
(JCPDs 00-038-0419). However, after being reduced at the atmosphere with P(O2)~10-13 Pa, the
sample is comprised of metallic nickel and spinel oxide. Therefore, during the stability testing, the catalyst in the anode is likely to maintain as metallic nickel and iron oxide rather than FeNi3.
Microstructure of the anode
(a) (b)
9
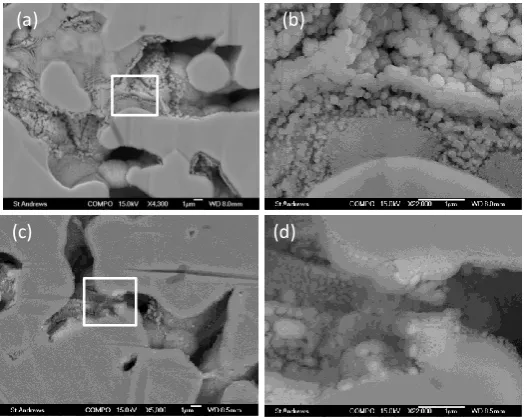
Figure 7 Back-scattered electron (BSE) images of Ni-impregnated LSCTA- (a, b) after firing at 450 oC in air for 30 min and (c, d) after the stability testing at 700 oC for 32 h in humidified hydrogen
(3 % H2O). (b) and (d) are the enlarged images of the rectangular areas in the general images (a)
and (c), respectively.
As the addition of catalyst is shown to improve both the performance and the durability of the cell, it is therefore of interest to investigate any correlation between the performance and the microstructure of LSCTA--based anodes. Figure 7 shows the back-scattered electron (BSE) images
of the Ni-LSCTA- anode before and after testing for 32 hours. From the micrographs it can be seen
that after impregnation and low-temperature firing, a uniform coating of nano-sized NiO/Ni has formed on the LSCTA- support surface (Figure 7(a) and (b)). Fine particles, around 50 nm, can be
seen on the edges around the LSCTA- grains, especially around the convex areas, and coarse
particles, around 200 nm in diameter, are concentrated on the concave surfaces. The difference in the size of the catalyst particles is attributed to the uneven deposition process driven by capillary action, resulting in a thinner layer formed on convex surfaces and a thicker layer on concave surfaces38. After the initial I-V testing at 700 oC under humidified hydrogen, Ni particles tend to dispersed on the surface of the LSCTA- scaffold and the size of Ni particles are on the scale of 100
nm19 and an additional image is also provided in Figure S3. There is a significant change in the microstructure after 32 hours in humidified hydrogen at 700oC as shown in Figure 7(c) and (d). A
continuous bright layer contains nanoparticles of 50 nm, which tend to line up along the edge of LSCTA- grains but agglomerate on the corners (Figure 7(d)). A layer, even darker than the backbone,
can be distinguished outside the bright layer, the composition of this darker layer is not yet clear. However, there is some speculation that it may be composed of backbone material as the decomposition of the nitrate and citric acid produces conditions of localised acidity and could therefore induce a partial dissolution of the backbone during the firing process followed by re-nucleation and growth during fuel cell testing. Gorte et al. has studied the deactivation of Pd on La0.7Sr0.3VO3, and proposed that the coverage of Sr2V2O7 on Pd surface could be the reason for the
10 (a)
(f) (e)
(d) (c)
(b)
catalyst LSCT
[image:10.595.59.321.56.373.2]A-catalyst
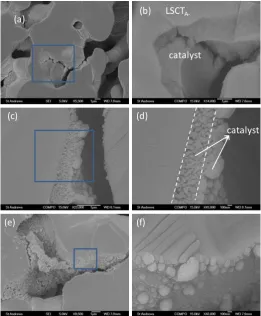
Figure 8 Secondary electron microscopy (SEM) and Back-scattered electron (BSE) images of Ni-Fe impregnated LSCTA- (a, b) before testing, (c, d) and (e, f) after testing for 24 and 60 h, respectively,
at 700 oC. (b), (d) and (f) the enlarged images of the rectangular areas in the general images (a), (c)
and (e), respectively.
The microstructures of Ni-Fe impregnated LSCTA- anode at different testing times are shown in
Figure 8. After firing at 450 oC, a dense layer of bi-metallic oxide is formed covering the surface of the backbone particles (Figure 8(a)). In particular, the thickness of the catalyst can reach around 1 mm at the bottom side (Figure 8(b)). After initial I-V testing under humidified hydrogen, the catalyst layer forms a connected framework with grains under the scale of 50 nm as shown in Figure S4. The distribution of the catalyst again suggests that capillary forces play have a strong influence during the impregnation process. A comparison of the SEM image (Figure 8(a)) and BSE image (Figure 8(b)) implies a seamless bonding between the catalyst and backbone. After 24-h reduction in 5% H2 at 700 oC, the dense layers become a porous coating comprising of metallic particles of
11 1
2 3
0 2 4 6 8 10 12 14 16 Ca La La Fe Int ens it y (Arb. U nit s )
X-ray energy (keV) O
Fe Sr Ca Ti
La Fe
Sr
0 2 4 6 8 10 12 14 16 Fe Int ens it y (Arb. U nit s )
X-ray energy (keV) O Ni Fe Sr Ca Ti La+Ti Fe Ni Ni Sr
0 2 4 6 8 10 12 14 16 Ca La Int ens it y (Arb. U nit s )
X-ray energy (keV) O Sr Ca Ti La+Ti Sr
Site 1 in (a)
Site 2 in (a) Site 3 in (a)
(a)
(b)
[image:11.595.59.325.55.290.2](c) (d)
Figure 9 Transmission electron microscopy (TEM) image (a) of LSCTA- anode coated with a Ni-Fe
layer on the surface after stability testing for 24 h at 700 oC in humidified hydrogen and the corresponding EDX spectra (b), (c) and (d) of the marked areas by numbers 1, 2 and 3
A TEM micrograph with EDX is able to reveal more detail of impregnated catalyst on the backbone and identify the elemental composition of the different layers. The TEM image of an interface between the LSCTA- backbone and catalyst after testing in fuel cell condition for 24 h is shown in
Figure 9, along with the corresponding EDX spectra. Two different structures on the LSCT
A-backbone can be observed, including a nanoparticle on the very top and a relatively dense layer between the backbone and top layer, consistent with the analysis result of SEM images. According to the EDX spectra of the coating, there is chemical interaction between Ni-Fe and LSCT
A-backbone. The microstructure of the catalyst on the LSCTA- surface plays an important role in the
cell performance: on the very top the nanoparticle is mainly comprised of Ni (63 at. % of the cation) and Fe(28 at.% of the cation) with minor La, Sr and Ti; the layer between Ni-Fe nanoparticles and LSCTA- backbone, as indicated by site 2, shows a strong interaction between iron and the backbone,
consisting of possibly (La,Sr,Ca)2Fe(Ti)O4 and/or La(Sr,Ca)Fe(Ti)O3 and titanate since the atomic
percentage of the cation in this layer contains 46 % La, 33 % Fe, 8% Sr, 7 % Ca and 7% Ti in atomic ratio. The ceramic interlayer could also serve as an coating that retards the oxidation of underneath LSCTA- anode, which could be implied from the stable Rs value of the cell during
testing under bias for different times. The growth of nano-sized metallic catalyst particles due to thermal instability is always attributed to be the major reason for the performance degradation of a cell prepared with infiltration40. The nano particle growth has two ramifications: it will decrease the surface area for electrochemical reactions and in electrodes where the infiltrated phase supplies electrical conductivity, and increase the series resistance by creating larger intergranular gaps and eventual loss of percolation. In this particular anode-supported cell arrangement where the LSCT
A-support structure provides most of the electrical conductivity, the bulk of the degradation will mostly likely come from the reduction of surface area for catalysis. The growth of metal particles is obvious from the SEM images, but the interaction between the metal particles and the LSCT
A-backbone may contribute to a further degradation mechanism for the anode. The substitution of Fe for Ni may be able to decrease the particle size growth due to the existence of iron-containing oxides interacting with the backbone and to a lesser extent, this interaction of Ni-Fe catalyst with the LSCTA- backbone could also decrease the coverage of backbone oxide on the catalyst surface.
12
The fuel cells using A-site deficient strontium titanate La0.2Sr0.25Ca0.45TiO3 (LSCTA-) as an anode
scaffold material reduced at high temperature (i.e. 900oC) show a promising electrochemical performance after impregnation of catalyst. The impregnation of a bimetal Ni-Fe catalyst has been shown to improve the electrochemical performance compared with a cell impregnated with only Ni. Possible mechanisms for this improvement could be due to an optimized microstructure of the catalyst as the Fe addition improves the number of active sites on Ni and the activity of those sites by decreasing the activation energy, leading to an accelerated charge transfer and the diffusion process.
The impregnated samples demonstrate a more stable performance than those without catalyst during testing in humidified hydrogen for 60 h, however they still show some performance degradation with time. This is most likely linked to the significant microstructural evolution observed in the impregnated cells before and after testing. The growth of catalyst particles and the interaction between the catalyst and LSCTA- backbone are likely to be the main reasons for the degradation of
the cell performance. As well as improving electrochemical performance the combined Ni-Fe catalyst was also shown to effectively reduce degradation when compared with the pure nickel catalyst as the agglomeration and growth of the particles has been slowed by the addition of Fe, and the chemical interaction between nickel catalyst on the outer layer and LSCTA- backbone has also
been inhibited by the Fe-rich layer on the inner layer attached to the anode backbone.
Acknowledgements
The research leading to these results has received funding from the European Union's Seventh Framework Programme (FP7/2007-2013) for the Fuel Cells and Hydrogen Joint Technology Initiative under grant agreement n° 256730 and Energy Technology Partnership (ETP). We would also like to thank Stewart McCracken of MCS Ltd Edinburgh for access to the Leica EM TIC 3X Triple Ion Beam System for sample preparation as part of the ETP PhD Studentship.
References
1T. Setoguchi, K. Okamoto, K. Eguchi and H. Arai, J. Electrochem. Soc., 1992, 139, 2875-2880 2S. P. Jiang, Int. J. Hydrogen Energy, 2012, 37, 449-470
3 A. Atkinson, S. Barnett, R. J. Gorte, J. T. S. Irvine, A. J. Mcevoy, M. Mogensen, S. C. Singhal
and J. Vohs, Nat. Mater., 2004, 3, 17-27
4 L. Yang, S. Wang, K. Blinn, M. Liu, Z. Liu, Z. Cheng and M. Liu, Science, 2009, 326, 126-129 5 L. Yang, Y. Choi, W. Qin, H. Chen, K. Blinn, M. Liu, P. Liu, J. Bai, T. A. Tyson and M. Liu, Nat. Commun, 2011., 2, 357-365
6 S. T. Aruna, M. Muthuraman and K. C. Patil, Solid State Ionics, 1998, 111, 45-51
7 J. H. Lee, H. Moon, H. W. Lee, J. Kim, J. D. Kim and K. H. Yoon, Solid State Ionics, 2002, 148,
15-26
8 M. L. Toebes, J. H. Bitter, A. J. van Dillen and K. P. de Jong, Catal. Today, 2002, 76, 33-42 9 Y. Matsuzaki and I. Yasuda, Solid State Ionics, 2000, 132, 261-269
10 T. Iwata, J. Electrochem. Soc., 1996, 143, 1521-1525
11 P. R. Slater, D. P. Fagg and J. T. S. Irvine, J. Mater. Chem., 1997, 7, 2495-2498 12 Q. X. Fu, S. B. Mi, E. Wessel and F. Tietz, J. Eur. Cera. Soc., 2008, 28, 811-820
13 R. Mukundan, E. L. Brosha and F. H. Garzon, Electrochem. Solid-State Lett., 2004, 7, A5-A7 14 Q. Ma, F. Tietz, Solid State Ionics, 2012, 225, 108-112
15 O. A. Marina, N. L. Canfield, J. W. Stevenson, Solid State Ionics, 2002, 149, 21-28 16 K. B. Yoo and G. M. Choi, Solid State Ionics, 2009, 180, 867-871
13
19 L. Lu, C. Ni, M. Cassidy and J. T. S. Irvine, J. Mater. Chem. A, 2016, 4, 11708-11718 20 S. Lee, N. Miller and K. Gerdes, J. Electrochem. Soc., 2012, 159, F301-F308
21 W. Wang,M. D. Gross, J. M. Vohs and R. J. Gorte, J. Electrochem. Soc., 2007, 154, B439-445 22 C. Setevich, F. Prado, D. Z. de Florio and A. Caneiro, J. Power Sources, 2014, 247, 264-272 23 Y. Liu, F. Wang, B. Chi, J. Pu, L. Jian and S. P. Jiang, J. Alloy Compd., 2013, 578, 37-43
24 Q. Ma, B. Iwanschitz, E. Dashjav, A. Mai, F. Tietz, H.-P. Buchkremer, Solid State Ionics, 2014,
262, 465-468
25 Q. Ma, B. Iwanschitz, E. Dashjav, S. Baumann, D. Sebold, I. A. Raj, A. Mai, F. Tietz, J. Power Sources, 2015, 279, 678-685
26 M. C. Verbraeken, B. Iwanschitz, E. Stefan, M. Cassidy, U. Weissen, A. Mai and J. T. S. Irvine,
Fuel Cells, 2015, 15, 682-688
27 R. Küngas, J.-S. Kim, J. M. Vohs and R. J. Gorte, J. Am. Ceram. Soc., 2011, 94, 2220-2224 28 J. T. S. Irvine, D. Neagu, M. C. Verbraeken, C. Chatzichristodoulou, C. Graves and M. B.
Mogensen, Nat. Energy, 2016, 1, 15014
29 D. Marrocchelli, S. R. Bishop, H. L. Tuller and B. Yildiz, Adv. Funct. Mater., 2012, 22, 1958-65 30 S. Lee, G. Kim, J. M. Vohs and R. J. Gorte, J. Electrochem. Soc., 2008, 155, B1179-B1183 31 J. S. Park, I. D. Hasson, M. D. Gross, C. Chen, J. M. Vohs and R. J. Gorte, J. Power Source,
2011, 196, 7488-7494
32 J. H. Kim, H. Schlegl and J. T. S. Irvine, Int. J. Hydrogen Energy, 2012, 37, 14511-14517 33 J. S. Kim, V. V. Nair, J. M. Vohs and R. J. Gorte, Scripta Mater., 2011, 65, 90-95
34 G. Kim, S. Lee, J. Y. Shin, G. Corre, J. T. S. Irvine, J. M. Vohs and R. J. Gorte, Electrochem. Solid-State Lett., 2009, 12, B48-B52
35 G. Kim, G. Corre, J. T. S. Irvine, J. M. Vohs and R. J. Gorte, Electrochem. Solid-State Lett., 2008,
11, B16-B19
36 M. C. Verbraeken, B. Iwanschitz, A. Mai and J. T. S. Irvine, J. Electrochem. Soc., 2012, 159,
F757-F762.
37 T. Ishihara and H. Zhong, Effects of Fe addition on the surface reaction of the anode of
intermediate temperature solid oxide fuel cells, Scripta Mater., 2011, 65, 108-111
38 G. Corre, G. Kim,, M. Cassidy, J. M. Vohs, R. J. Gorte and J. T. S. Irvine, Chem. Mater., 2009,
21, 1077-1084
Figure S1 The polarization resistance of the symmetrical LSCF-YSZ cathode with time tested at 700 oC in air.
0 1 2 3 4 5
0.0 0.5 1.0
Z'/cm2 250 Hz
79.4 Hz
0.4 Hz
1.26 kHz
0.0 0.5 1.0 1.5 2.0 2.5 3.0 3.5
0.0 0.5
Bare LSCT
A-Ni-LSCT
A--Z
"/
cm
2
15.9 kHz
400 Hz
0.25 Hz
0.4 0.5 0.6 0.7 0.8 0.9 1.0 1.1
0.0 0.1
NiFe-LSCT
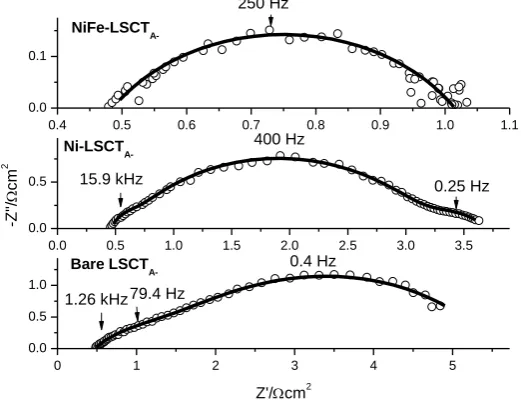
A-Figure S2 The experimental (open symbols) and simulated (line) EIS results of the three cells under OCV tested at
700 oC in 3% H 2O-H2.
Table S1 Parameters from the simulated EIS data of the three cells tested at 700 oC. The three cells have been fitted
with the equivalent circuit Rs(R1Q1)(R2Q2)(R3Q3), where n and Q are parameters associated with constant phase
element. The units of R and Q are cm2 and -1sn cm-2, respectively.
Rs Q1 n1 R1 Q2 n2 R2 Q3 n3 R3
LSCTA- 0.47 5.74x10⁻² 0.53 1.08 1.59x10⁻¹ 0.63 4.01
Ni-LSCTA- 0.46 1.69x10⁻⁴ 1.00 0.12 5.22x10⁻³ 0.66 2.59 1.16 0.61 0.51
NiFe-LSCTA- 0.49 2.11x10⁻² 0.63 0.53
0.00 0.02 0.04 0.06 0.08
0.00 -0.02
1258HZ 2000HZ
2000HZ 2000HZ
4360HZ
0h 6h 16h 24h 40h 60h 80h
Z'
'/
cm
2
Z'cm2 YSZ 120m
[image:14.595.110.371.324.525.2] [image:14.595.81.510.651.719.2]Table S2 Parameters from the simulated EIS data of the bare LSCTA- cell tested at 700 C with time. The data have
been fitted with the equivalent circuit Rs(R2Q2)(R3Q3), where n and Q are parameters associated with constant phase
element.
Time /h
Parameter Unit 0 12 24 40
Rs cm2 0.47 0.58 0.69 0.75
Q2 -1 sn cm-2 5.75x10⁻² 5.29 x10⁻² 5.14 x10⁻² 4.42 x10⁻²
n2 0.53 0.51 0.49 0.50
R2 cm2 1.08 1.28 1.62 1.42
Q3 -1 sn cm-2 0.16 0.15 0.15 0.15
n3 0.63 0.60 0.67 0.68
[image:15.595.92.506.344.538.2]R3 cm2 4.00 6.38 3.04 2.49
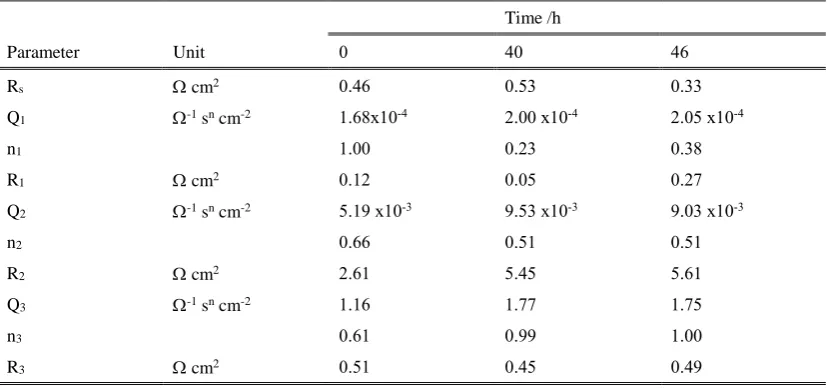
Table S3 Parameters from the simulated EIS data of the Ni- LSCTA- cell tested at 700 oC with time. The data have
been fitted with the equivalent circuit Rs(R1Q1)(R2Q2)(R3Q3), where n and Q are parameters associated with constant
phase element.
Time /h
Parameter Unit 0 40 46
Rs cm2 0.46 0.53 0.33
Q1 -1 sn cm-2 1.68x10⁻⁴ 2.00 x10⁻⁴ 2.05 x10⁻⁴
n1 1.00 0.23 0.38
R1 cm2 0.12 0.05 0.27
Q2 -1 sn cm-2 5.19 x10⁻³ 9.53 x10⁻³ 9.03 x10⁻³
n2 0.66 0.51 0.51
R2 cm2 2.61 5.45 5.61
Q3 -1 sn cm-2 1.16 1.77 1.75
n3 0.61 0.99 1.00
[image:15.595.93.506.600.699.2]R3 cm2 0.51 0.45 0.49
Table S4 Parameters from the simulated EIS data of the NiFe- LSCTA- cell tested at 700 oC with time. The data have
been fitted with the equivalent circuit Rs(R2Q2), where n and Q are parameters associated with constant phase
element.
Time /h
Parameter Unit 0 12 24 40 56
Rs cm2 0.49 0.44 0.46 0.48 0.50
Q2 -1 sn cm-2 2.11x10⁻² 5.68 x10⁻² 5.78 x10⁻² 5.27 x10⁻² 4.52 x10⁻²
n2 0.63 0.52 0.52 0.52 0.54