Findings of the 2013 Workshop on Statistical Machine Translation
Ondˇrej Bojar
Charles University in Prague University of EdinburghChristian Buck University of PennsylvaniaChris Callison-Burch
Christian Federmann
Saarland University University of EdinburghBarry Haddow University of EdinburghPhilipp Koehn
Christof Monz
University of Amsterdam Johns Hopkins UniversityMatt Post Radu SoricutGoogle University of SheffieldLucia Specia
Abstract
We present the results of the WMT13 shared tasks, which included a translation task, a task for run-time estimation of ma-chine translation quality, and an unoffi-cial metrics task. This year, 143 machine translation systems were submitted to the ten translation tasks from 23 institutions. An additional 6 anonymized systems were included, and were then evaluated both au-tomatically and manually, in our largest manual evaluation to date. The quality es-timation task had four subtasks, with a to-tal of 14 teams, submitting 55 entries.
1 Introduction
We present the results of the shared tasks of the Workshop on Statistical Machine Translation (WMT) held at ACL 2013. This workshop builds on seven previous WMT workshops (Koehn and Monz, 2006; Callison-Burch et al., 2007, 2008, 2009, 2010, 2011, 2012).
This year we conducted three official tasks: a translation task, a human evaluation of transla-tion results, and a quality estimatransla-tion task.1 In
the translation task (§2), participants were asked
to translate a shared test set, optionally restrict-ing themselves to the provided trainrestrict-ing data. We held ten translation tasks this year, between En-glish and each of Czech, French, German, Span-ish, and Russian. The Russian translation tasks were new this year, and were also the most popu-lar. The system outputs for each task were evalu-ated both automatically and manually.
The human evaluation task (§3) involves ask-ing human judges to rank sentences output by anonymized systems. We obtained large numbers of rankings from two groups: researchers (who
1The traditional metrics task is evaluated in a separate
pa-per (Mach´aˇcek and Bojar, 2013).
contributed evaluations proportional to the number of tasks they entered) and workers on Amazon’s Mechanical Turk (who were paid). This year’s ef-fort was our largest yet by a wide margin; we man-aged to collect an order of magnitude more judg-ments than in the past, allowing us to achieve sta-tistical significance on the majority of the pairwise system rankings. This year, we are also clustering the systems according to these significance results, instead of presenting a total ordering over systems. The focus of the quality estimation task (§6)
is to produce real-time estimates of sentence- or word-level machine translation quality. This task has potential usefulness in a range of settings, such as prioritizing output for human post-editing, or selecting the best translations from a number of systems. This year the following subtasks were proposed: prediction of percentage of word edits necessary to fix a sentence, ranking of up to five al-ternative translations for a given source sentence, prediction of post-editing time for a sentence, and prediction of word-level scores for a given trans-lation (correct/incorrect and types of edits). The datasets included English-Spanish and German-English news translations produced by a number of machine translation systems. This marks the second year we have conducted this task.
The primary objectives of WMT are to evaluate the state of the art in machine translation, to dis-seminate common test sets and public training data with published performance numbers, and to re-fine evaluation methodologies for machine trans-lation. As before, all of the data, translations, and collected human judgments are publicly avail-able.2 We hope these datasets serve as a
valu-able resource for research into statistical machine translation, system combination, and automatic evaluation or prediction of translation quality.
2http://statmt.org/wmt13/results.html
2 Overview of the Translation Task
The recurring task of the workshop examines translation between English and five other lan-guages: German, Spanish, French, Czech, and — new this year — Russian. We created a test set for each language pair by translating newspaper arti-cles and provided training data.
2.1 Test data
The test data for this year’s task was selected from news stories from online sources. A total of 52 articles were selected, in roughly equal amounts from a variety of Czech, English, French, German, Spanish, and Russian news sites:3
Czech: aktu´alnˇe.cz (1), CTK (1), den´ık (1), iDNES.cz (3), lidovky.cz (1), Novinky.cz (2)
French: Cyber Presse (3), Le Devoir (1), Le
Monde (3), Liberation (2)
Spanish: ABC.es (2), BBC Spanish (1), El Peri-odico (1), Milenio (3), Noroeste (1), Primera Hora (3)
English: BBC (2), CNN (2), Economist (1),
Guardian (1), New York Times (2), The Tele-graph (1)
German: Der Standard (1), Deutsche Welle (1), FAZ (1), Frankfurter Rundschau (2), Welt (2)
Russian: AIF (2), BBC Russian (2), Izvestiya (1), Rosbalt (1), Vesti (1)
The stories were translated by the professional translation agency Capita, funded by the EU Framework Programme 7 project MosesCore, and by Yandex, a Russian search engine.4 All of the
translations were done directly, and not via an in-termediate language.
2.2 Training data
As in past years we provided parallel corpora to train translation models, monolingual corpora to train language models, and development sets to tune system parameters. Some training corpora were identical from last year (Europarl5, United
Nations, French-English 109 corpus, CzEng),
some were updated (News Commentary, mono-lingual data), and new corpora were added (Com-mon Crawl (Smith et al., 2013), Russian-English
3For more details see the XML test files. Thedocidtag
gives the source and the date for each document in the test set, and theoriglangtag indicates the original source language.
4http://www.yandex.com/
5As of Fall 2011, the proceedings of the European
Parlia-ment are no longer translated into all official languages.
parallel data provided by Yandex, Russian-English Wikipedia Headlines provided by CMU).
Some statistics about the training materials are given in Figure 1.
2.3 Submitted systems
We received 143 submissions from 23 institu-tions. The participating institutions and their en-try names are listed in Table 1; each system did not necessarily appear in all translation tasks. We also included three commercial off-the-shelf MT systems and three online statistical MT systems,6
which we anonymized.
For presentation of the results, systems are treated as eitherconstrainedorunconstrained, de-pending on whether their models were trained only on the provided data. Since we do not know how they were built, these online and commercial sys-tems are treated as unconstrained during the auto-matic and human evaluations.
3 Human Evaluation
As with past workshops, we contend that auto-matic measures of machine translation quality are an imperfect substitute for human assessments. We therefore conduct a manual evaluation of the system outputs and define its results to be the prin-cipal ranking of the workshop. In this section, we describe how we collected this data and compute the results, and then present the official results of the ranking.
We run the evaluation campaign using an up-dated version of Appraise (Federmann, 2012); the tool has been extended to support collecting judg-ments using Amazon’s Mechanical Turk, replac-ing the annotation system used in previous WMTs. The software, including all changes made for this year’s workshop, is available from GitHub.7
This year differs from prior years in a few im-portant ways:
• We collected about ten times more judgments that we have in the past, using judgments from both participants in the shared task and non-experts hired on Amazon’s Mechanical Turk.
• Instead of presenting a total ordering of sys-tems for each pair, we cluster them and report a ranking over the clusters.
6Thanks to Herv´e Saint-Amand and Martin Popel for
har-vesting these entries.
Europarl Parallel Corpus
Spanish↔English French↔English German↔English Czech↔English
Sentences 1,965,734 2,007,723 1,920,209 646,605
Words 56,895,229 54,420,026 60,125,563 55,642,101 50,486,398 53,008,851 14,946,399 17,376,433 Distinct words 176,258 117,481 140,915 118,404 381,583 115,966 172,461 63,039
News Commentary Parallel Corpus
Spanish↔English French↔English German↔English Czech↔English Russian↔English
Sentences 174,441 157,168 178,221 140,324 150,217
Words 5,116,388 4,520,796 4,928,135 4,066,721 4,597,904 4,541,058 3,206,423 3,507,249 3,841,950 4,008,949 Distinct words 84,273 61,693 69,028 58,295 142,461 61,761 138,991 54,270 145,997 57,991
Common Crawl Parallel Corpus
Spanish↔English French↔English German↔English Czech↔English Russian↔English
Sentences 1,845,286 3,244,152 2,399,123 161,838 878,386
Words 49,561,060 46,861,758 91,328,790 81,096,306 54,575,405 58,870,638 3,529,783 3,927,378 21,018,793 21,535,122 Distinct words 710,755 640,778 889,291 859,017 1,640,835 823,480 210,170 128,212 764,203 432,062
United Nations Parallel Corpus
Spanish↔English French↔English
Sentences 11,196,913 12,886,831
Words 318,788,686 365,127,098 411,916,781 360,341,450 Distinct words 593,567 581,339 565,553 666,077
109Word Parallel Corpus
French↔English Sentences 22,520,400
Words 811,203,407 668,412,817 Distinct words 2,738,882 2,861,836
CzEng Parallel Corpus Czech↔English Sentences 14,833,358
Words 200,658,857 228,040,794 Distinct words 1,389,803 920,824
Yandex 1M Parallel Corpus Russian↔English Sentences 1,000,000
Words 24,121,459 26,107,293 Distinct words 701,809 387,646
Wiki Headlines Parallel Corpus Russian↔English
Sentences 514,859 Words 1,191,474 1,230,644 Distinct words 282,989 251,328
Europarl Language Model Data
English Spanish French German Czech Sentence 2,218,201 2,123,835 2,190,579 2,176,537 668,595
Words 59,848,044 60,476,282 63,439,791 53,534,167 14,946,399 Distinct words 123,059 181,837 145,496 394,781 172,461
News Language Model Data
English Spanish French German Czech Russian
Sentence 68,521,621 13,384,314 21,195,476 54,619,789 27,540,749 19,912,911 Words 1,613,778,461 386,014,234 524,541,570 983,818,841 456,271,247 351,595,790 Distinct words 3,392,137 1,163,825 1,590,187 6,814,953 2,655,813 2,195,112
News Test Set
English Spanish French German Czech Russian
Sentences 3000
Words 64,810 73,659 73,659 63,412 57,050 58,327 Distinct words 8,935 10,601 11,441 12,189 15,324 15,736
ID Institution
BALAGUR Yandex School of Data Analysis (Borisov et al., 2013) CMU
CMU-TREE-TO-TREE
Carnegie Mellon University (Ammar et al., 2013)
CU-BOJAR, CU-DEPFIX, CU-TAMCHYNA
Charles University in Prague (Bojar et al., 2013)
CU-KAREL,CU-ZEMAN Charles University in Prague (B´ılek and Zeman, 2013) CU-PHRASEFIX,
CU-TECTOMT Charles University in Prague (Galuˇsˇc´akov´a et al., 2013)
DCU Dublin City University (Rubino et al., 2013a)
DCU-FDA Dublin City University (Bicici, 2013a) DCU-OKITA Dublin City University (Okita et al., 2013)
DESRT Universit`a di Pisa (Miceli Barone and Attardi, 2013)
ITS-LATL University of Geneva
JHU Johns Hopkins University (Post et al., 2013)
KIT Karlsruhe Institute of Technology (Cho et al., 2013)
LIA Universit´e d’Avignon (Huet et al., 2013)
LIMSI LIMSI (Allauzen et al., 2013)
MES-* Munich / Edinburgh / Stuttgart (Durrani et al., 2013a; Weller et al., 2013)
OMNIFLUENT SAIC (Matusov and Leusch, 2013)
PROMT PROMT Automated Translations Solutions
QCRI-MES Qatar / Munich / Edinburgh / Stuttgart (Sajjad et al., 2013)
QUAERO QUAERO (Peitz et al., 2013a)
RWTH RWTH Aachen (Peitz et al., 2013b)
SHEF University of Sheffield
STANFORD Stanford University (Green et al., 2013) TALP-UPC TALP Research Centre (Formiga et al., 2013a)
TUBITAK T ¨UB˙ITAK-B˙ILGEM (Durgar El-Kahlout and Mermer, 2013)
UCAM University of Cambridge (Pino et al., 2013)
UEDIN,
UEDIN-HEAFIELD University of Edinburgh (Durrani et al., 2013b) UEDIN-SYNTAX University of Edinburgh (Nadejde et al., 2013)
UMD University of Maryland (Eidelman et al., 2013)
UU Uppsala University (Stymne et al., 2013)
COMMERCIAL-1,2,3 Anonymized commercial systems ONLINE-A,B,G Anonymized online systems
3.1 Ranking translations of sentences
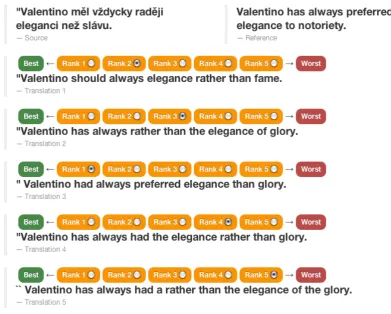
[image:5.595.303.540.339.546.2]The ranking among systems is produced by col-lecting a large number of rankings between the systems’ translations. Every language task had many participating systems (the largest was 19, for the Russian-English task). Rather than asking judges to provide a complete ordering over all the translations of a source segment, we instead ran-domly select five systems and ask the judge to rank just those. We call each of these a ranking task. A screenshot of the ranking interface is shown in Figure 2.
For each ranking task, the judge is presented with a source segment, a reference translation, and the outputs of five systems (anonymized and randomly-ordered). The following simple instruc-tions are provided:
You are shown a source sentence fol-lowed by several candidate translations. Your task is to rank the translations from best to worst (ties are allowed).
The rankings of the systems are numbered from 1 to 5, with 1 being the best translation and 5 be-ing the worst. Each rankbe-ing task has the potential to provide 10pairwise rankings, and fewer if the judge chooses any ties. For example, the ranking
{A:1, B:2, C:4, D:3, E:5}
provides 10 pairwise rankings, while the ranking
{A:3, B:3, C:4, D:3, E:1}
provides just 7. The absolute value of the ranking or the degree of difference is not considered.
We use the collected pairwise rankings to assign each system a score that reflects how highly that system was usually ranked by the annotators. The score for some systemAreflects how frequently it was judged to be better than other systems when compared on the same segment; its score is the number of pairwise rankings where it was judged to be better, divided by the total number of non-tying pairwise comparisons. These scores were used to compute clusters of systems and rankings between them (§3.4).
3.2 Collecting the data
A goal this year was to collect enough data to achieve statistical significance in the rankings. We distributed the workload among two groups of judges: researchers andTurkers. The researcher
group comprised partipants in the shared task, who were asked to contribute judgments on 300 sen-tences for each system they contributed. The re-searcher evaluation was held over three weeks from May 17–June 7, and yielded about 280k pair-wise rankings.
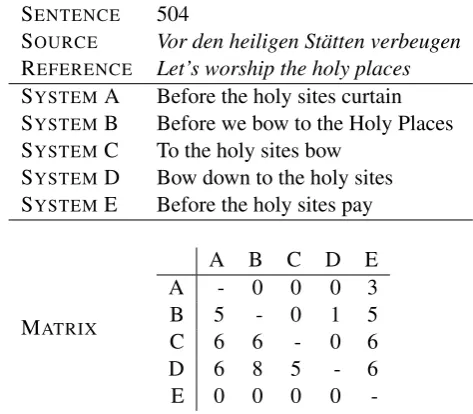
The Turker group was composed of non-expert annotators hired on Amazon’s Mechanical Turk (MTurk). A basic unit of work on MTurk is called a Human Intelligence Task (HIT) and included three ranking tasks, for which we paid $0.25. To ensure that the Turkers provided high quality an-notations, this portion of the evaluation was be-gun after the researcher portion had completed, enabling us to embed controls in the form of high-consensus pairwise rankings in the Turker HITs. To build these controls, we collected ranking tasks containing pairwise rankings with a high degree of researcher consensus. An example task is here:
SENTENCE 504
SOURCE Vor den heiligen St¨atten verbeugen REFERENCE Let’s worship the holy places SYSTEMA Before the holy sites curtain SYSTEMB Before we bow to the Holy Places SYSTEMC To the holy sites bow
SYSTEMD Bow down to the holy sites SYSTEME Before the holy sites pay
MATRIX
A B C D E
A - 0 0 0 3
B 5 - 0 1 5
C 6 6 - 0 6
D 6 8 5 - 6
E 0 0 0 0
-Matrix entry Mi,j records the number of re-searchers who judged System ito be better than
Systemj. We use as controls pairwise judgments
for which|Mi,j−Mj,i|>5, i.e., judgments where the researcher consensus ran strongly in one direc-tion. We rejected HITs from Turkers who encoun-tered at least 10 of these controls and failed more than 50% of them.
Figure 2: Screenshot of the Appraise interface used in the human evaluation campaign. The annotator is presented with a source segment, a reference translation, and the outputs of five systems (anonymized and randomly-ordered) and has to rank these according to their translation quality, ties are allowed. For technical reasons, annotators on Amazon’s Mechanical Turk received all three ranking tasks for a single HIT on a single page, one upon the other.
3.3 Annotator agreement
Each year we calculate annotator agreement scores for the human evaluation as a measure of the reliability of the rankings. We measured pair-wise agreement among annotators using Cohen’s kappa coefficient (κ) (Cohen, 1960), which is
de-fined as
κ= P(A)−P(E) 1−P(E)
whereP(A)is the proportion of times that the
an-notators agree, andP(E)is the proportion of time
that they would agree by chance. Note thatκis
ba-sically a normalized version ofP(A), one which
takes into account how meaningful it is for anno-tators to agree with each other, by incorporating
P(E). The values forκ range from 0 to 1, with
zero indicating no agreement and 1 perfect agree-ment.
We calculate P(A) by examining all pairs of
systems which had been judged by two or more judges, and calculating the proportion of time that they agreed thatA > B, A = B, orA < B. In
other words,P(A)is the empirical, observed rate
at which annotators agree, in the context of pair-wise comparisons.
As forP(E), it should capture the probability
that two annotators would agree randomly. There-fore:
P(E) =P(A>B)2+P(A=B)2+P(A<B)2
Note that each of the three probabilities inP(E)’s
definition are squared to reflect the fact that we are considering the chance thattwoannotators would agree by chance. Each of these probabilities is computed empirically, by observing how often an-notators actually rank two systems as being tied.
Table 3 givesκvalues for inter-annotator
LANGUAGEPAIR Systems Rankings Average
Czech-English 11 85,469 7,769.91
English-Czech 12 102,842 8,570.17
German-English 17 128,668 7,568.71
English-German 15 77,286 5,152.40
Spanish-English 12 67,832 5,652.67
English-Spanish 13 60,464 4,651.08
French-English 13 80,741 6,210.85
English-French 17 100,783 5,928.41
Russian-English 19 151,422 7,969.58
English-Russian 14 87,323 6,237.36
Total 148 942,840 6,370.54
WMT12 103 101,969 999.69
WMT11 133 63,045 474.02
Table 2:Amount of data collected in the WMT13 manual evaluation. The final two rows report summary information from the previous two workshops.
LANGUAGEPAIR WMT11 WMT12 WMT13 WMT13r WMT13m
Czech-English 0.400 0.311 0.244 0.342 0.279
English-Czech 0.460 0.359 0.168 0.408 0.075
German-English 0.324 0.385 0.299 0.443 0.324
English-German 0.378 0.356 0.267 0.457 0.239
Spanish-English 0.494 0.298 0.277 0.415 0.295
English-Spanish 0.367 0.254 0.206 0.333 0.249
French-English 0.402 0.272 0.275 0.405 0.321
English-French 0.406 0.296 0.231 0.434 0.237
Russian-English — — 0.278 0.315 0.324
English-Russian — — 0.243 0.416 0.207
Table 3: κscores measuring inter-annotator agreement. The WMT13rand WMT13mcolumns provide breakdowns for re-searcher annotations and MTurk annotations, respectively. See Table 4 for corresponding intra-annotator agreement scores.
0.6–0.8 is substantial, and 0.8–1.0 is almost per-fect. We find that the agreement rates are more or less the same as in prior years.
The WMT13 column contains both researcher and Turker annotations at a roughly 1:2 ratio. The final two columns break out agreement numbers between these two groups. The researcher agree-ment rates are similar to agreeagree-ment rates from past years, while the Turker agreement are well below researcher agreement rates, varying widely, but of-ten comparable to WMT11 and WMT12. Clearly, researchers are providing us with more consistent opinions, but whether these differences are ex-plained by Turkers racing through jobs, the partic-ularities that inform researchers judging systems they know well, or something else, is hard to tell. Intra-annotator agreement scores are also on par from last year’s level, and are often much better. We observe better intra-annotator agreement for researchers compared to Turkers.
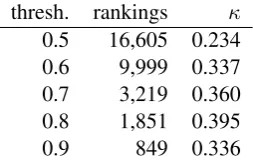
As a small test, we varied the threshold of ac-ceptance against the controls for the Turker data alone and computed inter-annotator agreement scores on the datasets for the Russian–English task (the only language pair where we had enough data at high thresholds). Table 5 shows that higher thresholds do indeed give us better agreements, but not monotonically. The increasing κs
sug-gests that we can find a segment of Turkers who do a better job and that perhaps a slightly higher threshold of 0.6 would serve us better, while the remaining difference against the researchers sug-gests there may be different mindsets informing the decisions. In any case, getting the best perfor-mance out of the Turkers remains difficult.
3.4 System Score
re-LANGUAGEPAIR WMT11 WMT12 WMT13 WMT13r WMT13m
Czech-English 0.597 0.454 0.479 0.483 0.478
English-Czech 0.601 0.390 0.290 0.547 0.242
German-English 0.576 0.392 0.535 0.643 0.515
English-German 0.528 0.433 0.498 0.649 0.452
Spanish-English 0.574 1.000 0.575 0.605 0.537
English-Spanish 0.426 0.329 0.492 0.468 0.492
French-English 0.673 0.360 0.578 0.585 0.565
English-French 0.524 0.414 0.495 0.630 0.486
Russian-English — — 0.450 0.363 0.477
[image:8.595.118.245.281.361.2]English-Russian — — 0.513 0.582 0.500
Table 4: κscores measuring intra-annotator agreement, i.e., self-consistency of judges, across for the past few years of the human evaluation. The WMT13rand WMT13mcolumns provide breakdowns for researcher annotations and MTurk annota-tions, respectively. The perfect inter-annotator agreement for Spanish-English is a result of there being very little data for that language pair.
thresh. rankings κ
0.5 16,605 0.234
0.6 9,999 0.337
0.7 3,219 0.360
0.8 1,851 0.395
0.9 849 0.336
Table 5:Agreement as a function of threshold for Turkers on the Russian–English task. The threshold is the percentage of controls a Turker must pass for her rankings to be accepted.
cent evaluation campaigns, we tweaked the metric and now arrived at a intuitive score that has been demonstrated to be accurate in ranking systems ac-cording to their true quality (Koehn, 2012).
The score, which we callEXPECTED WINS, has an intuitive explanation. If the system is compared against a randomly picked opposing system, on a randomly picked sentence, by a randomly picked judge, what is the probability that its translation is ranked higher?
Formally, the score for a systemSiamong a set of systems{Sj}given a pool of pairwise rankings summarized as win(A, B)— the number of times
system A is ranked higher than system B — is
defined as follows:
score(Si) =
1 |{Sj}|
X
j,j6=i
win(Si, Sj) win(Si, Sj) +win(Sj, Si)
Note that this score ignores ties.
3.5 Rank Ranges and Clusters
Given the scores, we would like to rank the sys-tems, which is straightforward. But we would also like to know, if the obtained system ranking is statistically significant. Typically, given the large
number of systems that participate, and the simi-larity of the systems given a common training data condition and often common toolsets, there will be some systems that will be very close in quality.
To establish the reliability of the obtained sys-tem ranking, we use bootstrap resampling. We sample from the set of pairwise rankings an equal sized set of pairwise rankings (allowing for multi-ple drawings of the same pairwise ranking), com-pute the expected wins score for each system based on this sample, and rank each system. By repeating this procedure a 1,000 times, we can de-termine a range of ranks, into which system falls at least 95% of the time (i.e., at least 950 times) — corresponding to a p-level ofp≤0.05.
Furthermore, given the rank ranges for each sys-tem, we can cluster systems with overlapping rank ranges.8
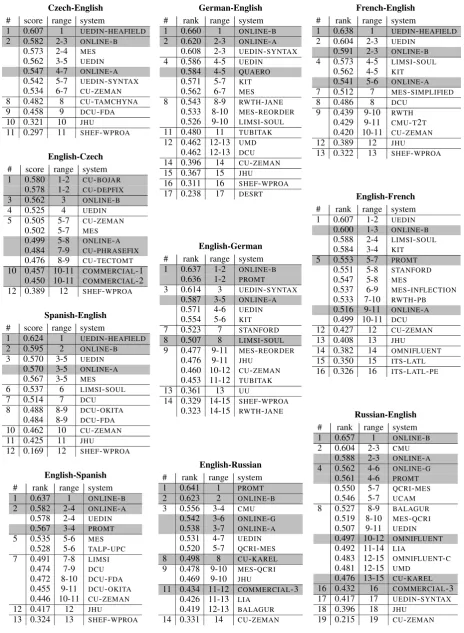
For all language pairs and all systems, Table 6 reports all system scores, rank ranges, and clus-ters. The official interpretation of these results is that systems in the same cluster are considered tied. Given the large number of judgements that we collected, it was possible to group on average about two systems in a cluster, even though the systems in the middle are typically in larger clus-ters.
8Formally, given ranges defined by start(S
i) and end(Si), we seek the largest set of clusters{Cc}that satisfies:
∀S∃C:S∈C
S∈Ca, S∈Cb→Ca=Cb
Ca6=Cb→ ∀Si∈Ca, Sj∈Cb:
Czech-English # score range system
1 0.607 1 UEDIN-HEAFIELD 2 0.582 2-3 ONLINE-B
0.573 2-4 MES 0.562 3-5 UEDIN 0.547 4-7 ONLINE-A 0.542 5-7 UEDIN-SYNTAX 0.534 6-7 CU-ZEMAN
8 0.482 8 CU-TAMCHYNA
9 0.458 9 DCU-FDA
10 0.321 10 JHU
11 0.297 11 SHEF-WPROA
English-Czech # score range system 1 0.580 1-2 CU-BOJAR
0.578 1-2 CU-DEPFIX
3 0.562 3 ONLINE-B
4 0.525 4 UEDIN
5 0.505 5-7 CU-ZEMAN 0.502 5-7 MES 0.499 5-8 ONLINE-A 0.484 7-9 CU-PHRASEFIX 0.476 8-9 CU-TECTOMT 10 0.457 10-11 COMMERCIAL-1
0.450 10-11 COMMERCIAL-2 12 0.389 12 SHEF-WPROA
Spanish-English # score range system
1 0.624 1 UEDIN-HEAFIELD
2 0.595 2 ONLINE-B
3 0.570 3-5 UEDIN 0.570 3-5 ONLINE-A 0.567 3-5 MES 6 0.537 6 LIMSI-SOUL
7 0.514 7 DCU
8 0.488 8-9 DCU-OKITA 0.484 8-9 DCU-FDA 10 0.462 10 CU-ZEMAN 11 0.425 11 JHU
12 0.169 12 SHEF-WPROA
English-Spanish # rank range system 1 0.637 1 ONLINE-B 2 0.582 2-4 ONLINE-A
0.578 2-4 UEDIN 0.567 3-4 PROMT 5 0.535 5-6 MES
0.528 5-6 TALP-UPC 7 0.491 7-8 LIMSI
0.474 7-9 DCU 0.472 8-10 DCU-FDA 0.455 9-11 DCU-OKITA 0.446 10-11 CU-ZEMAN 12 0.417 12 JHU
13 0.324 13 SHEF-WPROA
German-English # rank range system
1 0.660 1 ONLINE-B
2 0.620 2-3 ONLINE-A 0.608 2-3 UEDIN-SYNTAX 4 0.586 4-5 UEDIN
0.584 4-5 QUAERO 0.571 5-7 KIT 0.562 6-7 MES 8 0.543 8-9 RWTH-JANE
0.533 8-10 MES-REORDER 0.526 9-10 LIMSI-SOUL 11 0.480 11 TUBITAK 12 0.462 12-13 UMD
0.462 12-13 DCU 14 0.396 14 CU-ZEMAN 15 0.367 15 JHU
16 0.311 16 SHEF-WPROA 17 0.238 17 DESRT
English-German # rank range system 1 0.637 1-2 ONLINE-B
0.636 1-2 PROMT 3 0.614 3 UEDIN-SYNTAX
0.587 3-5 ONLINE-A 0.571 4-6 UEDIN 0.554 5-6 KIT
7 0.523 7 STANFORD
8 0.507 8 LIMSI-SOUL 9 0.477 9-11 MES-REORDER
0.476 9-11 JHU 0.460 10-12 CU-ZEMAN 0.453 11-12 TUBITAK 13 0.361 13 UU
14 0.329 14-15 SHEF-WPROA 0.323 14-15 RWTH-JANE
English-Russian # rank range system
1 0.641 1 PROMT
2 0.623 2 ONLINE-B
3 0.556 3-4 CMU 0.542 3-6 ONLINE-G 0.538 3-7 ONLINE-A 0.531 4-7 UEDIN 0.520 5-7 QCRI-MES
8 0.498 8 CU-KAREL
9 0.478 9-10 MES-QCRI 0.469 9-10 JHU
11 0.434 11-12 COMMERCIAL-3 0.426 11-13 LIA
0.419 12-13 BALAGUR 14 0.331 14 CU-ZEMAN
French-English # rank range system
1 0.638 1 UEDIN-HEAFIELD 2 0.604 2-3 UEDIN
0.591 2-3 ONLINE-B 4 0.573 4-5 LIMSI-SOUL
0.562 4-5 KIT 0.541 5-6 ONLINE-A 7 0.512 7 MES-SIMPLIFIED
8 0.486 8 DCU
9 0.439 9-10 RWTH 0.429 9-11 CMU-T2T 0.420 10-11 CU-ZEMAN 12 0.389 12 JHU
13 0.322 13 SHEF-WPROA
English-French # rank range system 1 0.607 1-2 UEDIN
0.600 1-3 ONLINE-B 0.588 2-4 LIMSI-SOUL 0.584 3-4 KIT 5 0.553 5-7 PROMT
0.551 5-8 STANFORD 0.547 5-8 MES
0.537 6-9 MES-INFLECTION 0.533 7-10 RWTH-PB 0.516 9-11 ONLINE-A 0.499 10-11 DCU 12 0.427 12 CU-ZEMAN 13 0.408 13 JHU
14 0.382 14 OMNIFLUENT 15 0.350 15 ITS-LATL 16 0.326 16 ITS-LATL-PE
Russian-English # rank range system
1 0.657 1 ONLINE-B
2 0.604 2-3 CMU 0.588 2-3 ONLINE-A 4 0.562 4-6 ONLINE-G
0.561 4-6 PROMT 0.550 5-7 QCRI-MES 0.546 5-7 UCAM 8 0.527 8-9 BALAGUR
0.519 8-10 MES-QCRI 0.507 9-11 UEDIN 0.497 10-12 OMNIFLUENT 0.492 11-14 LIA
0.483 12-15 OMNIFLUENT-C 0.481 12-15 UMD
0.476 13-15 CU-KAREL 16 0.432 16 COMMERCIAL-3 17 0.417 17 UEDIN-SYNTAX 18 0.396 18 JHU
[image:9.595.74.539.72.706.2]19 0.215 19 CU-ZEMAN
4 Understandability of English→Czech
For the English-to-Czech translation, we con-ducted a variation of the “understandability” test as introduced in WMT09 (Callison-Burch et al., 2009) and used in WMT10. In order to obtain additional reference translations, we conflated this test with post-editing. The procedure was as fol-lows:
1. Monolingual editing(also called blind edit-ing). The first annotator is given just the MT output and requested to correct it. Given er-rors in MT outputs, some guessing of the original meaning is often inevitable and the annotators are welcome to try. If unable, they can mark the sentences as incomprehensible.
2. Review. A second annotator is asked to
validate the monolingual edit given both the source and reference translations. Our in-structions specify three options:
(a) If the monolingual edit is an adequate translation and acceptably fluent Czech, confirm it without changes.
(b) If the monolingual edit is adequate but needs polishing, modify the sentence and prefix it with the label ‘OK:’. (c) If the monolingual edit is wrong,
cor-rect it. You may start from the origi-nal unedited MT output, if that is eas-ier. Avoid using the reference directly, prefer words from MT output whenever possible.
The motivation behind this procedure is that we want to save the time necessary for reading the sentence. If the reviewer has already considered whether the sentence is an acceptable translation, they do not need to read the MT output again in order to post-edit it. Our approach is thus some-what the converse of Aziz et al. (2013) who ana-lyze post-editing effort to obtain rankings of MT systems. We want to measure the understandabil-ity of MT outputs and obtain post-edits at the same time.
Both annotation steps were carried out in the CASMACAT/Matecat post-editing user inter-face.9, modified to provide the relevant variants of
the sentence next to the main edit box. Screen-shots of the two annotation phases are given in Figure 3 and Figure 4.
9http://www.casmacat.eu/index.php?n=Workbench
Occurrence GOOD ALMOST BAD EMPTY Total
First 34.7 0.1 42.3 11.0 4082
Repeated 41.1 0.1 41.0 6.1 805
Overall 35.8 0.1 42.1 10.2 4887
Table 7:Distribution of review statuses.
Similarly to the traditional ranking task, we pro-vided three consecutive sentences from the origi-nal text, each translated with a different MT sys-tem. The annotators are free to use this contex-tual information when guessing the meaning or re-viewing the monolingual edits. Each “annotation HIT” consists of 24 sentences, i.e. 8 snippets of 3 consecutive sentences.
4.1 Basic Statistics on Editing
In total, 21 annotators took part in the exercise, 20 of them contributed to monolingual editing and 19 contributed to the reviews.
Connecting each review with the monolingual edit (some edits received multiple reviews), we ob-tain one data row. We collected 4887 data rows (i.e. sentence revisions) for 3538 monolingual ed-its, covering 1468 source sentences as translated by 12 MT systems (including the reference).
Not all MT systems were considered for each sentence, we preferred to obtain judgments for more source sentences.
Based on the annotation instructions, each data row has one of the four possible statuses: GOOD, ALMOST, BAD, and EMPTY. GOOD rows are those where the reviewer accepted the monolin-gual edit without changes, ALMOST edits were modified by the reviewer but they were marked as ‘OK’. BAD edits were changed by the reviewer and no ‘OK’ mark was given. Finally, the sta-tus EMPTY is assigned to rows where the mono-lingual editor refused to edit the sentence. The EMPTY rows nevertheless contain the (“regular”) post-edit of the reviewer, so they still provide a new reference translation for the sentence.
Figure 3:In this screen, the annotator is expected to correct the MT output given only the context of at most two neighbouring machine-translated sentences.
ALMOST Pairwise
treated Comparisons Agreement κ
inter separateas BAD 26902690 56.067.9 0.2700.351
as GOOD 2690 65.2 0.289
intra separateas BAD 170170 65.369.4 0.4100.386
[image:11.595.77.290.327.408.2]as GOOD 170 71.8 0.422
Table 8:Annotator agreement when reviewing monolingual edits.
4.2 Agreement on Understandability
Before looking at individual system results, we consider annotator agreement in the review step. Details are given in Table 8. Given a (non-EMPTY) string from a monolingual edit, we would like to know how often two acceptability judgments by two different reviewers (inter-) or the same reviewer (intra-) agree. The repeated ed-its remain in this analysis because we are not in-terested in the origin of the string.
Our annotation setup leads to three possible la-bels: GOOD, ALMOST, and BAD. The agree-ment on one of three classes is bound to be lower than the agreement on two classes, so we also re-interpret ALMOST as either GOOD or BAD. Gen-erally speaking, ALMOST is a positive judgment, so it would be natural to treat it as GOOD. How-ever, in our particular setup, when the reviewer modified the sentence andforgot to add the label ‘OK:’, the item ended up in the BAD class. We conclude that this is indeed the case: the inter-annotator agreement appears higher if ALMOST
is treated as BAD. Future versions of the review-ing interface should perhaps first ask for the yes/no judgment and only then allow to post-edit.
The κ values in Table 8 are the Fleiss’
kappa (Fleiss, 1971), accounting for agreement by chance given the observed label distributions.
In WMT09, the agreements for this task were higher: 77.4 for inter-AA and 86.6 for intra-AA. (In 2010, the agreements for this task were not re-ported.) It is difficult to say whether the differ-ence lies in the particular language pair, the dif-ferent set of annotators, or the difdif-ferent user in-terface for our reviewing task. In 2009 and 2010, the reviewers were shown 5 monolingual edits at once and they were asked to judge each as accept-able or not acceptaccept-able. We show just one segment and they have probably set their minds on the post-editing rather than acceptability judgment. We be-lieve that higher agreements can be reached if the reviewers first validate one or more of the edits and only then are allowed to post-edit it.
4.3 Understandability of English→Czech
Figure 4:In this screen, the annotator is expected to validate the monolingual edit, correcting it if necessary. The annotator is expected to add the prefix ‘OK:’ if the correction was more or less cosmetic.
Rank System Total Observations % Understandable Overall incl. ref. 4082 46.7±1.6 Overall without ref. 3808 44.2±1.6
1 Reference 274±31 80.3±4.8
2-6 CU-ZEMAN 348±34 51.7±5.1
2-6 UEDIN 332±33 51.5±5.4
2-6 ONLINE-B 337±34 50.7±5.3
2-6 CU-BOJAR 341±35 50.7±5.2
2-7 CU-DEPFIX 350±34 48.0±5.3
6-10 COMMERCIAL-2 358±36 43.6±5.2 6-11 COMMERCIAL-1 316±34 41.5±5.5
7-12 CU-TECTOMT 338±34 39.4±5.2
8-12 MES 346±36 38.4±5.2
8-12 CU-PHRASEFIX 394±40 38.1±4.8 10-12 SHEF-WPROA 348±32 34.2±5.1
2009 Reference 91
2009 Best System 32
2010 Reference 97
2010 Best System 58
Table 9:Understandability of English→Czech systems. The
±values indicate empirical confidence bounds at 95%. Rank ranges were also obtained in the same resampling: in 95% of observations, the system was ranked in the given range.
2010, the best systems or system combinations reached 55%–58%. The test set across years and the quality of references and judgments also play a role. In our annotation setup, the references appear to be correctly understandable only to 80.3±4.8%. To estimate the variance of these results due to the particular sentences chosen, we draw 1000 random samples from the dataset, preserving the dataset size and repeating some. The exact
num-ber of judgments per system can thus vary. We report the 95% empirical confidence interval after the ‘±’ signs in Table 9 (the systems range from
±4.8 to±5.5). When we drop individual blind
ed-itors or reviewers, the understandability judgments differ by about±2 to±4. In other words, the de-pendence on the test set appears higher than the dependence on the annotators.
The limited size of our dataset allows us only to separate two main groups of systems: those ranking 2–6 and those ranking worse. This rough grouping vaguely matches with WMT13 ranking results as given in Table 6. A somewhat surpris-ing observation is that two automatic corrections ranked better in WMT13 ranking but score worse in understandability: CU-DEPFIX fixes some lost negation and some agreement errors ofCU-BOJAR andCU-PHRASEFIX is a standard statistical post-editing of a transfer-based systemCU-TECTOMT. A detailed inspection of the data is necessary to explain this.
5 More Reference Translations for Czech
[image:12.595.60.292.382.576.2]Refs 1 2 3 4 5 6 7 8 9 10-16 Sents 233 709 174 123 60 48 40 27 25 29 Table 10:Number of source sentences with the given number of distinct reference translations.
In total, our edits cover 1468 source sentences, i.e. about a half of the official test set size, and pro-vide 4311 unique references. On average, one sen-tence in our set has 2.94±2.17 unique reference translations. Table 10 provides a histogram.
It is well known that automatic MT evalua-tion methods perform better with more references, because a single one may not confirm a correct part of MT output. This issue is more severe for morphologically rich languages like Czech where about 1/3 of MT output was correct but not confirmed by the reference (Bojar et al., 2010). Advanced evaluation methods apply paraphras-ing to smooth out some of the lexical divergence (Kauchak and Barzilay, 2006; Snover et al., 2009; Denkowski and Lavie, 2010). Simpler techniques such as lemmatizing are effective for morphologi-cally rich languages (Tantug et al., 2008; Kos and Bojar, 2009) but they will lose resolution once the systems start performing generally well.
WMTs have taken the stance that a big enough test set with just a single reference should compen-sate for the lack of other references. We use our post-edited reference translations to check this as-sumption for BLEU and NIST as implemented in
mteval-13a(international tokenization switched
on, which is not the default setting).
We run many probes, randomly picking the test set size (number of distinct sentences) and the number of distinct references per sentence. Note that such test sets are somewhat artificially more diverse; in narrow domains, source sentences can repeat and even appear verbatim in the training data, and in natural test sets with multiple refer-ences, short sentences can receive several identical translations.
For each probe, we measure the Spearman’s rank correlation coefficient ρ of the ranks pro-posed by BLEU or NIST and the manual ranks. We use the same implementation as applied in the WMT13 Shared Metrics Task (Mach´aˇcek and Bo-jar, 2013). Note that the WMT13 metrics task still uses the WMT12 evaluation method ignoring ties, not the expected wins. As Koehn (2012) shows, the two methods do not differ much.
[image:13.595.308.524.281.448.2]Overall, the correlation is strongly impacted by
Figure 5: Correlation of BLEU and WMT13 manual ranks for English→Czech translation
Figure 6: Correlation of NIST and WMT13 manual ranks for English→Czech translation
the particular choice of test sentences and refer-ence translations. By picking sentrefer-ences randomly, similarly or equally sized test sets can reach dif-ferent correlations. Indeed, e.g. for a test set of about 1500 distinct sentences selected from the 3000-sentence official test set (1 reference trans-lation), we obtain correlations for BLEU between 0.86 and 0.94.
Figure 5 plots the correlations of BLEU and the system rankings, Figure 6 provides the same pic-ture for NIST. The upper triangular part of the plot contains samples from our post-edited reference translations, the lower rectangular part contains probes from the official test set of 3000 sentences with 1 reference translation.
0.6 0.65 0.7 0.75 0.8 0.85 0.9 0.95 1
10 100 1000
Correlation of BLEU and manual ranking
Test set size
Refs: official 1 Refs: postedited 1 Refs: postedited 6 Refs: postedited 7 Refs: postedited 8
Figure 7: Projections from Figure 5 of BLEU and WMT13 manual ranks for English→Czech translation
0.6 0.65 0.7 0.75 0.8 0.85 0.9 0.95 1
10 100 1000
Correlation of NIST and manual ranking
Test set size
[image:14.595.82.283.67.215.2]Refs: official 1 Refs: postedited 1 Refs: postedited 6 Refs: postedited 7 Refs: postedited 8
Figure 8: Projections from Figure 6 of NIST and WMT13 manual ranks for English→Czech translation
BLEU and NIST, resp. The projections confirm that the average correlations grow with test set size, the growth is however sub-logarithmic.
Starting from as few as a dozen of sentences, we see that using more references is better than using a larger test set. For BLEU, we however already seem to reach false positives at 7 references for one or two hundred sentences: larger sets with just one reference may correlate slightly better.
Using one reference obtained by post-editing seems better than using the official (independent) reference translations. BLEU is more affected than NIST by this difference even at relatively large test set size. Note that our post-edits are in-spired by all MT systems, the good as well as the bad ones. This probably provides our set with a certain balance.
Overall, the best balance between the test set size and the number of references seems to lie somewhere around 7 references and 100 or 200 sentences. Creating such a test set could be even cheaper than the standard 3000 sentences with just
one reference. However, the wide error bars re-mind us that even this setting can lead to correla-tions anywhere between 0.86 and 0.96. For other languages, data sets types or other MT evaluation methods, the best setting can be quite different and has to be sought for.
6 Quality Estimation Task
Machine translation quality estimation is the task of predicting a quality score for a machine trans-lated text without access to reference translations. The most common approach is to treat the problem as a supervised machine learning task, using stan-dard regression or classification algorithms. The second edition of the WMT shared task on qual-ity estimation builds on the previous edition of the task (Callison-Burch et al., 2012), with variants to this previous task, including both sentence-level and word-level estimation, with new training and test datasets, along with evaluation metrics and baseline systems.
The motivation to include both sentence- and word-level estimation come from the different po-tential applications of these variants. Some inter-esting uses of sentence-level quality estimation are the following:
• Decide whether a given translation is good enough for publishing as is.
• Inform readers of the target language only
whether or not they can rely on a translation.
• Filter out sentences that are not good enough for post-editing by professional translators.
• Select the best translation among options from multiple MT and/or translation memory systems.
Some interesting uses of word-level quality es-timation are the following:
• Highlight words that need editing in
post-editing tasks.
• Inform readers of portions of the sentence
which are not reliable.
• Select the best segments among options from multiple translation systems for MT system combination.
• To explore various granularity levels for the task (sentence-level and word-level).
• To explore the prediction of more objective
scores such as edit distance and post-editing time.
• To explore the use of quality estimation
tech-niques to replace reference-based MT evalua-tion metrics in the task of ranking alternative translations generated by different MT sys-tems.
• To identify new and effective quality
indica-tors (features) for all variants of the quality estimation task.
• To identify effective machine learning
tech-niques for all variants of the quality estima-tion task.
• To establish the state of the art performance
in the field.
Four subtasks were proposed, as we discuss in Sections 6.1 and 6.2. Each subtask provides spe-cific datasets, annotated for quality according to the subtask (Section 6.3), and evaluates the system submissions using specific metrics (Section 6.6). When available, external resources (e.g. SMT training corpus) and translation engine-related re-sources were given to participants (Section 6.4), who could also use any additional external re-sources (no distinction between open and close tracks is made). Participants were also provided with a software package to extract quality esti-mation features and perform model learning (Sec-tion 6.5), with a suggested list ofbaselinefeatures and learning method (Section 6.7). Participants could submit up to two systems for each subtask.
6.1 Sentence-level Quality Estimation
Task 1.1 Predicting Post-editing Distance This task is similar to the quality estimation task in WMT12, but with one important difference in the scoring variant: instead of using the post-editing effort scores in the [1-5] range, we use HTER (Snover et al., 2006) as quality score. This score is to be interpreted as the minimum edit distance between the machine translation and its manually post-edited version, and its range is [0, 1] (0 when no edit needs to be made, and 1 when all words need to be edited). Two variants of the results could be submitted in the shared task:
• Scoring: A quality score for each sentence translation in [0,1], to be interpreted as an HTER score; lower scores mean better trans-lations.
• Ranking: A ranking of sentence translations
for all source test sentences from best to worst. For this variant, it does not matter how the ranking is produced (from HTER predic-tions, likert predicpredic-tions, or even without ma-chine learning). The reference ranking is de-fined based on the true HTER scores.
Task 1.2 Selecting Best Translation This task consists in ranking up to five alternative transla-tions for the same source sentence produced by multiple MT systems. We use essentially the same data provided to participants of previous years WMT’s evaluation metrics task – where MT eval-uation metrics are assessed according to how well they correlate with human rankings. However, ref-erence translations produced by humans are not be used in this task.
Task 1.3 Predicting Post-editing Time For this task systems are required to produce, for each translation, the expected time (in seconds) it would take a translator to post-edit such an MT output. The main application for predictions of this type is in computer-aided translation where the predicted time can be used to select among dif-ferent hypotheses or even to omit any MT output in cases where no good suggestion is available.
6.2 Word-level Quality Estimation
Based on the data of Task 1.3, we define Task 2, a word-level annotation task for which participants are asked to produce a label for each token that indicates whether the word should be changed by a post-editor or kept in the final translation. We consider the following two sets of labels for pre-diction:
• Binary classification: a keep/change label,
the latter meaning that the token should be corrected in the post-editing process.
• Multi-class classification: a label specifying the edit action that should be performed on the token (keep as is, delete, or substitute).
6.3 Datasets
quality estimation dataset: 2,254 English-Spanish news sentences extracted from previous WMT translation task English-Spanish test sets (WMT09, WMT10, and WMT12). These were translated by a phrase-based SMT Moses system trained on Europarl and News Commentaries cor-pora as provided by WMT, along with their source sentences, reference translations, post-edited translations, and HTER scores. We used TERp (default settings: tokenised, case insensitive, etc., but capped to 1)10 to compute the HTER
scores. Likert scores in [1,5] were also provided, as participants may choose to use them for the ranking variant.
As test data, we use a subset of the WMT13 English-Spanish news test set with500sentences,
whose translations were produced by the same SMT system used for the training set. To com-pute the true HTER labels, the translations were post-edited under the same conditions as those on the training set. As in any blind shared task, the HTER scores were solely used to evaluate the sub-missions, and were only released to participants after they submitted their systems.
A few variations of the training and test data were provided, including a version with cases re-stored and a version detokenized. In addition, we provided a number of engine-internal informa-tion from Moses for glass-box feature extracinforma-tion, such as phrase and word alignments, model scores, word graph, n-best lists and information from the decoder’s search graph.
Task 1.2 Selecting best translation As training data, we provided a large set of up to five alter-native machine translations produced by different MT systems for each source sentence and ranked for quality by humans. This was the outcome of the manual evaluation of the translation task from WMT09-WMT12. It includes two language pairs: German-English and English-Spanish, with 7,098 and 4,592 source sentences and up to five ranked translations, totalling 32,922 and 22,447 transla-tions, respectively.
As test data, a set of up to five alternative ma-chine translations per source sentence from the WMT08 test sets was provided, with 365 (1,810) and 264 (1,315) source sentences (translations) for German-English and English-Spanish, respec-tively. We note that there was some overlap be-tween the MT systems used in the training data
10http://www.umiacs.umd.edu/˜snover/terp/
and test datasets, but not all systems were the same, as different systems participate in WMT over the years.
Task 1.3 and Task 2 Predicting post-editing time and word-level edits For Tasks 1.3 and 2 we provides a new dataset consisting of 22 English news articles which were translated into Span-ish using Moses and post-edited during a CAS-MACAT11field trial. Of these, 15 documents have
been processed repeatedly by at least 2 out of 5 translators, resulting in a total of 1,087 segments. For each segment we provided:
• English source and Spanish translation.
• Spanish MT output which was used as basis
for post-editing.
• Document and translator ID.
• Position of the segment within the document. The metadata about translator and document was made available as we expect that translator perfor-mance and normalisation over document complex-ity can be helpful when predicting the time spend on a given segment.
For the training portion of the data we also pro-vided:
• Time to post-edit in seconds (Task 1.3).
• Binary (Keep, Change) and multiclass (Keep, Substitute, Delete) labels on word level along with explicit tokenization (Task 2).
The labels in Task 2 are derived by comput-ing WER between the original machine translation and its post-edited version.
6.4 Resources
For all tasks, we provided resources to extract quality estimation features when these were avail-able:
• The SMT training corpus (WMT News and
Europarl): source and target sides of the cor-pus used to train the SMT engines for Tasks 1.1, 1.3, and 2, and truecase models gener-ated from these. These corpora can also be used for Task 1.2, but we note that some of the MT systems used in the datasets of this task were not statistical or did not use (only) the training corpus provided by WMT.
• Language models: n-gram language models of source and target languages generated us-ing the SMT trainus-ing corpora and standard toolkits such as SRILM Stolcke (2002), and a language model of POS tags for the target language. We also provided unigram, bigram and trigram counts.
• IBM Model 1 lexical tables generated by
GIZA++ using the SMT training corpora.
• Phrase tables with word alignment informa-tion generated by scripts provided by Moses from the parallel corpora.
• For Tasks 1.1, 1.3 and 2, the Moses
config-uration file used for decoding or the code to re-run the entire Moses system.
• For Task 1.1, both English and Spanish
re-sources for a number of advanced features such as pre-generated PCFG parsing models, topic models, global lexicon models and mu-tual information trigger models.
We refer the reader to the QUESTwebsite12for
a detailed list of resources provided for each task.
6.5 QUESTFramework
QUEST (Specia et al., 2013) is an open source framework for quality estimation which provides a wide variety of feature extractors from source and translation texts and external resources and tools. These range from simple, language-independent features, to advanced, linguistically motivated fea-tures. They include features that rely on informa-tion from the MT system that generated the trans-lations (glass-box features), and features that are oblivious to the way translations were produced (black-box features).
QUEST also integrates a well-known machine learning toolkit,scikit-learn,13and other
algo-rithms that are known to perform well on this task (e.g. Gaussian Processes), providing a simple and effective way of experimenting with techniques for feature selection and model building, as well as parameter optimisation through grid search.
From QUEST, a subset of 17 features and an
SVM regression implementation were used as baseline for Tasks 1.1, 1.2 and 1.3. The software was made available to all participants.
12http://www.quest.dcs.shef.ac.uk/ 13http://scikit-learn.org/
6.6 Evaluation Metrics
Task 1.1 Predicting post-editing distance
Evaluation is performed against the HTER and/or ranking of translations using the same metrics as in WMT12. For the scoring variant of the task, we use two standard metrics for regression tasks: Mean Absolute Error (MAE) as a primary metric, and Root of Mean Squared Error (RMSE) as a secondary metric. To improve readability, we report these error numbers by first mapping the HTER values to the [0,100] interval, to be read
as percentage-points of the HTER metric. For a given test setS with entriessi,1 ≤ i ≤ |S|, we denote by H(si) the proposed score for entry si (hypothesis), and byV(si)the reference value for entrysi(gold-standard value):
MAE=
PN
i=1|H(si)−V(si)| |S|
RMSE=
sPN
i=1(H(si)−V(si))2 |S|
Both these metrics are non-parametric, auto-matic and deterministic (and therefore consistent), and extrinsically interpretable. For instance, a MAE value of10 means that, on average, the
ab-solute difference between the hypothesized score and the reference score value is 10 percentage
points (i.e.,0.10difference in HTER scores). The
interpretation of RMSE is similar, with the differ-ence that RMSE penalises larger errors more (via the square function).
For theranking variant of the task, we use the DeltaAvg metric proposed in the 2012 edition of the task (Callison-Burch et al., 2012) as our main metric. This metric assumes that each reference test instance has an extrinsic number associated with it that represents its ranking with respect to the other test instances. For completeness, we present here again the definition of DeltaAvg.
The goal of the DeltaAvg metric is to measure how valuable a proposed ranking (which we call a hypothesisranking) is, according to the true rank-ing values associated with the test instances. We first define a parametrised version of this metric, called DeltaAvg[n]. The following notations are
used: for a given entry sentences,V(s)represents
Intuitively,V(S)is a quantitative measure of the “quality” of the setS, as induced by the extrinsic
values associated with the entries inS. For a set
of ranked entriesSand a parametern, we denote byS1the first quantile of setS(the highest-ranked
entries), S2 the second quantile, and so on, forn
quantiles of equal sizes.14 We also use the
nota-tion Si,j = Sjk=iSk. Using these notations, we define:
DeltaAvgV[n] =
Pn−1
k=1V(S1,k)
n−1 −V(S)
When the valuation function V is clear from the
context, we write DeltaAvg[n]for DeltaAvgV[n]. The parametern represents the number of
quan-tiles we want to split the setS into. For instance, n= 2gives DeltaAvg[2] =V(S1)−V(S), hence it
measures the difference between the quality of the top quantile (top half) S1 and the overall quality
(represented byV(S)). Forn= 3, DeltaAvg[3] = (V(S1)+V(S1,2)/2−V(S) = ((V(S1)−V(S))+ (V(S1,2−V(S)))/2, hence it measures an average
difference across two cases: between the quality of the top quantile (top third) and the overall quality, and between the quality of the top two quantiles (S1 ∪S2, top two-thirds) and the overall quality.
In general, DeltaAvg[n]measures an average
dif-ference in quality across n−1 cases, with each
case measuring the impact in quality of adding an additional quantile, from top to bottom. Finally, we define:
DeltaAvgV =
PN
n=2DeltaAvgV[n]
N−1
whereN =|S|/2. As before, we write DeltaAvg for DeltaAvgV when the valuation function V is clear from the context. The DeltaAvg metric is an average across all DeltaAvg[n] values, for those
nvalues for which the resulting quantiles have at
least 2 entries (no singleton quantiles).
We present results for DeltaAvg using as valu-ation functionV the HTER scores, as defined in
Section 6.3. We also use Spearman’s rank correla-tion coefficientρas a secondary metric.
Task 1.2 Selecting best translation The perfor-mance on the task of selecting the best transla-tion from a pool of translatransla-tion candidates is
mea-14If the size|S|is not divisible byn, then the last quantile
Snis assumed to contain the rest of the entries.
sured by comparing proposed (hypothesis) rank-ings against human-produced rankrank-ings. The met-ric used is Kendall’sτrank correlation coefficient,
computed as follows:
τ = |concordant pairs| − |discordant pairs| |total pairs|
where a concordant pair is a pair of two transla-tions for the same source segment in which the ranking order proposed by a human annotator and the ranking order of the hypothesis agree; in a dis-cordant pair, they disagree. The possible values of
τrange between 1 (where all pairs are concordant)
and−1 (where all pairs are discordant). Thus a
system with ranking predictions having a higher
τ value makes predictions that are more similar to human judgements than a system with ranking predictions having a lowerτ. Note that, in general,
being able to predict rankings with an accuracy of τ = −1 is as difficult as predicting rankings
with an accuracy ofτ = 1, whereas a completely
random ranking would have an expected value of
τ = 0. The range is therefore said to be
symmet-ric.
However, there are two distinct ways of mea-suring rank correlation using Kendall’sτ, related
to the waytiesare treated. They greatly affect how Kendall’sτ numbers are to be interpreted, and es-pecially the symmetry property. We explain the difference in detail in what follows.
Kendall’sτ with ties penalised If the goal is
to measure to what extent the difference in qual-ity visible to a human annotator has been captured by an automatically produced hypothesis (recall-oriented view), then proposing a tie between t1
andt2 (t1-equal-to-t2) when the pair was judged
(in the reference) ast1-better-than-t2 is treated as
a failure-to-recall. In other words, it is as bad as proposing t1-worse-than-t2. Henceforth, we call
this recall-oriented measure “Kendall’sτ with ties
penalised”. This metric has the following proper-ties:
• it is completely fair when comparing differ-ent methods to produce ranking hypotheses, because the denominator (number of total pairs) is the same (it is the number of non-tied pairs under the human judgements).
1(simply proposing only ties gets aτ =−1); hence, the sign of theτ value matters.
• the expected value of a completely random ranking is not necessarilyτ = 0, but rather
depends on the number of ties in the refer-ence rankings (i.e., it is test set dependent).
Kendall’s τ with ties ignored If the goal
is to measure to what extent the difference in quality signalled by an automatically produced hypothesis is reflected in the human annota-tion (precision-oriented view), then proposingt1
-equal-to-t2 when the pair was judged differently
in the reference does no harm the metric.
Henceforth, we call this precision-oriented measure ”Kendall’s τ with ties ignored”. This metric has the following properties:
• it is not completely fair when comparing dif-ferent methods to produce ranking hypothe-ses, because the denominator (number of to-tal pairs) may not be the same (it is the num-ber of non-tied pairs under each system’s pro-posal).
• it is symmetric, in the sense that a value of
τ = −1 is as difficult to obtain as τ = 1;
hence, the sign of theτ value may not
mat-ter.15
• the expected value of a completely random ranking isτ = 0(test-set independent).
The first property is the most worrisome from the perspective of reporting the results of a shared task, because a system may fare very well on this metric simply because it choses not to commit (proposes ties) most of the time. Therefore, to give a better understanding of the systems’ perfor-mance, for Kendall’sτ with ties ignored we also
provide the number of non-ties proposed by each system.
Task 1.3 Predicting post-editing time Submis-sions are evaluated in terms of Mean Average Er-ror (MAE) against the actual time spent by post-editors (in seconds). By using a linear error mea-sure we limit the influence of outliers: sentences that took very long to edit or where the measure-ment taken is questionable.
15In real life applications this distinction matters. Even
if, from a computational perspective, it is as hard to getτ
close to−1as it is to get it close to1, knowing the sign is the difference between selecting the best or the worse translation.
To further analyse the influence of extreme val-ues, we also compute Spearman’s rank correlation
ρcoefficient which does not depend on the
abso-lute values of the predictions.
We also give RMSE and Pearson’s correlation coefficientrfor reference.
Task 2 Predicting word-level scores The word-level task is primarily evaluated by macro-averaged F-measure. Because the class distribu-tion is skewed – in the test data about one third of the tokens are marked as correct – we compute precision and recall andF1for each class
individ-ually. Consider the following confusion matrix for the two classesKeepandChange:
predicted (K)eep (C)hange expected (K)eep(C)hange 10 20
30 40
For the given example we derive true-positive (tp), true-negative (tn), false-positive (fp), and false-negative (fn) counts:
tpK = 10 f pK= 30 f nK = 20
tpC = 40 f pC = 20 f nC = 30
precisionK = tpK
tpK+f pK
= 10/40
recallK =
tpK
tpK+f nK
= 10/30
F1,K =
2·precisionK·recallK
precisionK+ recallK
A single cumulative statistic can be computed by averaging the resulting F-measures (macro av-eraging) or bymicro averagingin which case pre-cision and recall are first computed by accumulat-ing the relevant values for all classes ( ¨Ozg¨ur et al., 2005), e.g.
precision = tpK+tpC
(tpK+f pK) + (tpC+f pC)
The latter gives equal weight to each exam-ple and is therefore dominated by performance on the largest class while macro-averaged F-measure gives equal weight to each class.
The same setup is used to evaluate the perfor-mance in the multiclass setting. Please note that here the test data only contains4%examples for
ID Participating team
CMU Carnegie Mellon University, USA (Hildebrand and Vogel, 2013) CNGL Centre for Next Generation Localization, Ireland (Bicici, 2013b)
DCU Dublin City University, Ireland (Almaghout and Specia, 2013) DCU-SYMC Dublin City University & Symantec, Ireland (Rubino et al., 2013b)
DFKI German Research Centre for Artificial Intelligence, Germany (Avramidis and Popovic, 2013)
FBK-UEdin Fondazione Bruno Kessler, Italy & University of Edinburgh, UK (Camargo de Souza et al., 2013)
LIG Laboratoire d’Informatique Grenoble, France (Luong et al., 2013)
LIMSI Laboratoire d’Informatique pour la M´ecanique et les Sciences de l’Ing´enieur, France (Singh et al., 2013)
LORIA Lorraine Laboratory of Research in Computer Science and its Applications, France (Langlois and Smaili, 2013)
SHEF University of Sheffield, UK (Beck et al., 2013)
TCD-CNGL Trinity College Dublin & CNGL, Ireland (Moreau and Rubino, 2013)
TCD-DCU-CNGL Trinity College Dublin, Dublin City University & CNGL, Ireland (Moreau and Rubino, 2013)
UMAC University of Macau, China (Han et al., 2013)
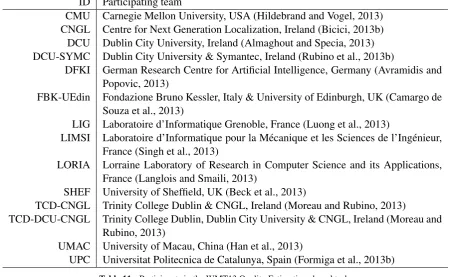
[image:20.595.73.524.67.344.2]UPC Universitat Politecnica de Catalunya, Spain (Formiga et al., 2013b) Table 11: Participants in the WMT13 Quality Estimation shared task.
6.7 Participants
Table 11 lists all participating teams submitting systems to any subtask in this shared task. Each team was allowed up to two submissions for each subtask. In the descriptions below participation in specific tasks is denoted by a task identifier: T1.1, T1.2, T1.3, and T2.
Sentence-level baseline system (T1.1, T1.3):
QUEST was used to extract 17
system-independent features from the source and translation files and the SMT training cor-pus that were found to be relevant in previous work (same features as in the WMT12 shared task):
• number of tokens in the source and tar-get sentences.
• average source token length.
• average number of occurrences of the target word within the target sentence.
• number of punctuation marks in source
and target sentences.
• Language model probability of source
and target sentences using language models provided by the task.
• average number of translations per source word in the sentence: as given by IBM 1 model thresholded so that
P(t|s)>0.2, and so thatP(t|s)>0.01
weighted by the inverse frequency of each word in the source side of the SMT training corpus.
• percentage of unigrams, bigrams and tri-grams in frequency quartiles 1 (lower
frequency words) and 4 (higher
fre-quency words) in the source side of the SMT training corpus
• percentage of unigrams in the source sentence seen in the source side of the SMT training corpus.
These features are used to train a Support Vector Machine (SVM) regression algorithm using a radial basis function kernel within the SCIKIT-LEARN toolkit. The γ, andC
re-sults, however, the baseline for Task 1.2 is simpler than that: it proposes random ranks for each pair of alternative translations for a given source sentence, as we will discuss in Section 6.8.
CMU (T1.1, T1.2, T1.3): The CMU quality estimation system was trained on features based on language models, the MT sys-tem’s distortion model and phrase table fea-tures, statistical word lexica, several sentence length statistics, source language word and bi-gram frequency statistics, n-best list agree-ment and diversity, source language parse, source-target word alignment and a depen-dency parse based cohesion penalty. These features were extracted using GIZA++, a forced alignment algorithm and the Stanford parser (de Marneffe et al., 2006). The pre-diction models were trained using four clas-sifiers in the Weka toolkit (Hall et al., 2009): linear regression, M5P trees, multi layer per-ceptron and SVM regression. In addition to main system submission, a classic n-best list re-ranking approach was used for Task 1.2.
CNGL (T1.1, T1.2, T1.3, T2): CNGL systems are based on referential translation machines (RTM) (Bic¸ici and van Genabith, 2013), par-allel feature decay algorithms (FDA) (Bicici, 2013a), and machine translation performance predictor (MTPP) (Bic¸ici et al., 2013), all of which allow to obtain language and MT system-independent predictions. For each task, RTM models were developed using the parallel corpora and the language model cor-pora distributed by the WMT13 translation task and the language model corpora pro-vided by LDC for English and Spanish. The sentence-level features are described in MTPP (Bic¸ici et al., 2013); they include monolingual or bilingual features using n-grams defined over text or common cover link (CCL) (Seginer, 2007) structures as the basic units of information over which sim-ilarity calculations are made. RTMs use 308 features about coverage and diversity, IBM1, and sentence translation performance, retrieval closeness and minimum Bayes re-trieval risk, distributional similarity and en-tropy, IBM2 alignment, character n-grams, and sentence readability. The learning
mod-els are Support Vector Machines (SVR) and SVR with partial least squares (SVRPLS). The word-level features include CCL links, word length, location, prefix, suffix, form, context, and alignment, totalling 511K fea-tures for binary classification, and 637K for multiclass classification. Generalised lin-ear models (GLM) (Collins, 2002) and GLM with dynamic learning (GLMd) were used.
DCU(T1.2): The main German-English submis-sion uses six Combinatory Categorial Gram-mar (CCG) features: CCG supertag lan-guage model perplexity and log probability, the number of maximal CCG constituents in the translation output which are the highest-probability minimum number of CCG con-stituents that span the translation output, the percentage of CCG argument mismatches be-tween each subsequent CCG supertags, the percentage of CCG argument mismatches be-tween each subsequent CCG maximal cate-gories and the minimum number of phrases detected in the translation output. A second submission uses the aforementioned CCG features combined with 80 features from QUEST as described in (Specia, 2011). For the CCG features, the C&C parser was used to parse the translation output. Moses was used to build the phrase table from the SMT training corpus with maximum phrase length set to 7. The language model of supertags was built using the SRILM toolkit. As learn-ing algorithm, Logistic Regression as pro-vided by theSCIKIT-LEARNtoolkit was used. The training data was prepared by converting each ranking of translation outputs to a set of pairwise comparisons according to the ap-proach proposed by Avramidis et al. (2011). The rankings were generated back from pair-wise comparisons predicted by the model.
DCU-SYMC (T1.1): The DCU-Symantec team