University of Warwick institutional repository:
http://go.warwick.ac.uk/wrap
A Thesis Submitted for the Degree of PhD at the University of Warwick
http://go.warwick.ac.uk/wrap/73983
This thesis is made available online and is protected by original copyright.
Please scroll down to view the document itself.
A thas i.s submitted by
S.O .. HARROLD, B.Sc.J~ng., A.C.G.I.
for the degr.ee of Doctor of l'hilosopby l.n
BEST COpy
AVAILABLE
TEXT IN ORIGINAL·
IS CLOSE TO THE
PAGE
. NUMBERS
CUTOFF
Abstract
The developm.e·ntand performance of a transistor scanned solid state ultra.sonic image conver-ter are described and the results of investigations into various applicable signal processing techniques t.o produce visible pictures are presented, The general requirements of an ultrasonic imaging system are considered and this is f'o11ml'ed by a critical survey of the more sensitive ultrasonic image conversion methods. The operation and basic performance of the transistor
scanned conver-ter are di scuased and its resolution and sensitivity Lnves ti.gat.ed , resulting in an apparent practi cal limit to the
reso-1
lution in. the image plane of 3'
mm,
and an estimated limiting sensi-tivity of approxima.tely 10-13 Wcm-2• Possible methods for the fabrication of a multielement converter are suggested and d.i.sous sed . Three sig!"ls.l process} ng techniques are investigated and compared; that using an acoustic lens in a conventional camer-a arrangement, an on-line computer which effectively performs electrically the f'unct.ion of El. lens, and a scanned array Doppler syst-em on which only a feas-ibility study was carried out. It is argued that if flexibility is important then the comput e r "lens" is the most fitting met.hcd , andresults for both near field focusing and far field beam deflection are presented) although at the moment.in I-dimension only , A relat-i vely s imp'Le extension to the pToe;ram will make 2-dimensional image reconst.ruc+i on possi.b.Le. The Doppler system descrd'bed pr'ovidea a simple eLectirica'l met.hod of determining the range and bearing of f'ar
Acknowledgement
-Theauthor is indebted to Dr. D.L Crecraft for his
understand-,ing and patient Gupervision, much of which has been carried out under
difficult circumstances, and also to Dr. H.V. Bhurmer- without whose invaluable support in the final stages this thesis would not have
been presented. Thanks are due to Dr. N.G. Meadowsand Mr. F. Dellow
for "their encouragement and assistance, and to Dr. D.S. Harris whose
helpful advice and interest in the last stages have provided the
necessary impetus to complete the work.
The author wishes to acknowledge the assistance of the Science
Research Council who financed the major part of the project, Lanchest.er
College of Technology (now Lanchester Polytechnic), and Portsmouth
Polytechnic, in particular the Department of Electrical and ElectronIc
Engineering, who supplied all the necessary facilities.
Special thanks are due to Mr. R.C. West whose except.Lonaf,
under--graduate project contributed greatly to the success of the work
des-cribed in Chapter
7.
Thanks are also due to Miss S.G. Westmore fortyping this thesis, and to the photographic section for reproducing
the Dlanyoscilloscope photographs, etc.
Above all the author wishes to thank his wife for her patience
Abstract.
Table of Contents
1
Acknowledgement. 2
6
List of figures, tables and programs.
Chapter 1. Chapter 2. 2.1 2.2 . 2.3
2.4
2.5 Chapter 3. 3.1 3.2 3.2.1 3.2.2 3.3 3.3.1 3.3.23.4
3.5 Chapter l~.4.1
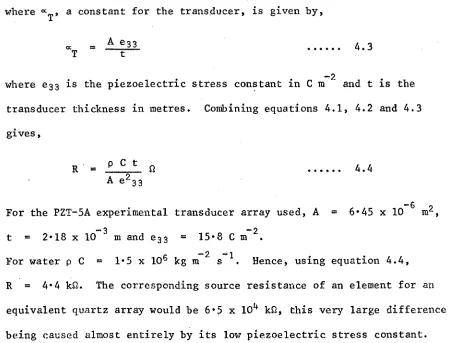
4.2
4.3
4.4
4.4.1
4.4.2
4.4.3
Introduction. 11Ultrasonic Imaging Techniques. 15
Introductory Review. Electron Tube Converters.
Solid State Transistor Scanned Converters. Surface Aeons tic vlave Scanned Transducer. Discussion. 15 17 19 21 22
Signal Processing Methods ~lied to Ultrasonic Imaging.
24
Acoustic Lenses and Mirrors. Acoustic Holography.
Princip les.
Practical Considerations.
Image Reconstruction by Computer, General Principles.
Experimental Systems.
Scanned Array Doppler System.
Comparison of Processing Techniques.
24
25 25 28 29 2930
32 33The Solid State Converter. 36
Converter Development.
General Prindples of t.he FET Scanned Converter. Constructional Details.
The Transducer.
Choice of Transducer Material.
Source Resistance of Tuned Receiver Element. Acoustic Element to Element Cross-Coupling.
4.5 4.5.1 4.5.2 4.6 4.7 4.7.1 4.7.2 4.8
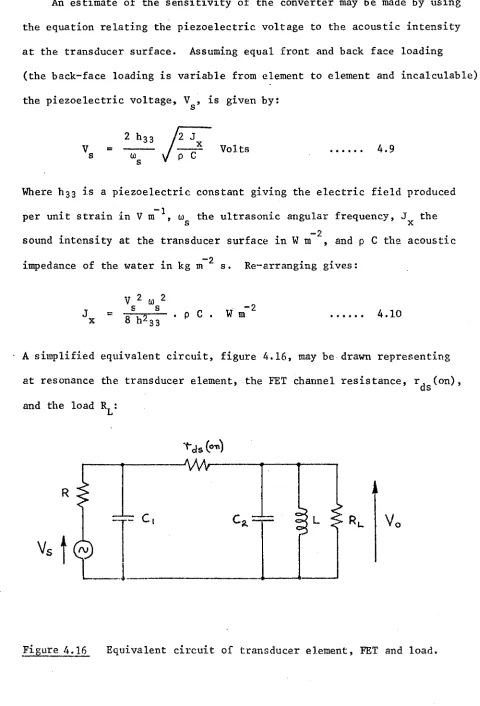
4.9
Chapter 5. 5.1 5.2 5.2.1 5.2.2 5.2.3 5.3 5.3.1 5.3.2 5.3.3 5.3.4 5. '. 5.5 5.6 Chapter 6. 6.1 6.2 6.2.1 6.2.2 6.2.3 6.3 6.3.1The FET Sampling Gate. Static "on" Characteristics. Dynamic "off" Characteristics. Control Circuits.
Converter Performance. Sys tem Noise.
Sensitivity.
Future Development of the FET Scanned Solid State Converter.
Conclusions.
Ultrasonic Camera Using the FET Scanned Converter with an Acoustic Lens.
System Description. The Acoustic System. Transmitter Units. Acoustic Lens. Reflection Tests. Circuit Details. Timing Unit ,
Bandpass Amplifier.
Transmitter and Receiver Gates and Detector Unit. Staircase Generator.
Results. Discussion. Conclusions.
On-line Computer Lens.
Introduction.
Processing Principles. Focused Operation.
Response of a Focused Continuous Receiving Aperture to a Point SOUTce.
6.3.2 6.3.3
6.4
6.4.1
6.4.2 6.4.3 6.5 6.66.7
6.8 <-'hapter7.7.1
7.2
7.3
7.3.1
7.3.2
7.3.37.4
1.5
References. AppendixA.
Appendix B. Appendjx C. Appendix D. Appendix E. Appendix F. Programming Languages. Interfacing Principles. TI1e Experimental System. General Description. Phase Detector.Analogue to Digital Converters. The Computer Program.
Results. Future Work. Conclusions.
Scanned Array Doppler System.
Introduction. System Principles. Experimental Work.
The Transducer Array aud Sampling Electronics. Measurement of the Characteristic Frequencies. Target Range and Bearing Tests.
Results.
Conclusions and Suggestions for Further Work.
General Conclusions.
Reprint of paper, "Solid state ultrasonic camera".
Ham.:.facturers' data.
Details of pulsed oscillator.
Reprint of letter, "Par-field sector scanning uS1ng a samp led multi-element ultrasonic rec.eLving array".
Reprint of paper to be published, "Control of
acoustic beam angle by harmonic analysis of sequential samples from a 1nulti·-ele.mentlinear ar ray'",
.Figure
1.1
3.2
4.1
4.2
4.3
4.4
4.5
4.6
4.7
4.8
4.9
List of Fig~res, Tables and Programs
A typical ultrasonic imaging system using an acoustic lens.
11
Formation of a hologram. 26
Image reconstruction by computer. 29
Pattern of electrodes on rear face of converter transducer.
37
Converter electrical system. 38
(a) Typical matrix output signal transmitter off. (b) Typical matrix output signal - transmitter on.
39
The FET scanning matrix before encapsulation. 41
Printed circuits for the F'ET scanning matrix. 42
The complete encapsulated solid state converter. 43
Transducer construction for 2nd stage of cross-coupling test.
48
FET scanning matrix circuit. 51
Typical low level drain characteristics for an n-channel junction FE'll.
5';
..
4.10 'l'estcircuit for voltage tr8l1sfer characteristic. 53
4.11 Voltage transfer characteristic for the gate circuit. 54
4.12 'rest circuit for gate breakthrough measurements. 55
4.13 Measurement of COFF• 57
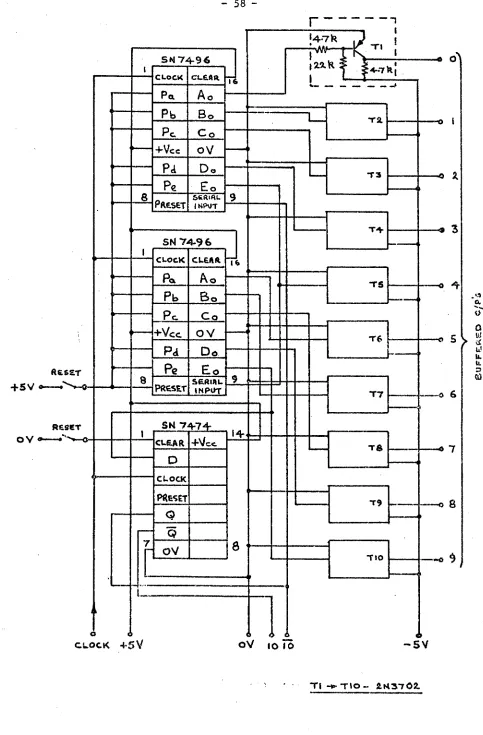
4.14 Shift register control circuit. 58
4.15 Complete 100 element serial output of converter for 61
uniform "il1uminationfl•
l~.16 Equivalent circuit of transducer element, }i'ETand load. 62
5.1 Camera. system with acousti c lens. 68
5.3
5.4
5.5
5.6
5.7
Overall camera system block diagram. 70
Timing waveforms. 71
(a) Typical output of bandpass amplifier (pulsed mode).
(b) Output of detector for above input.
74
The ultrasonic transmitters. 76
(a) Reflections, with lens and test object positioned as for normal imaging. (b) Reflections, w:i.thlens and test object
removed.
80
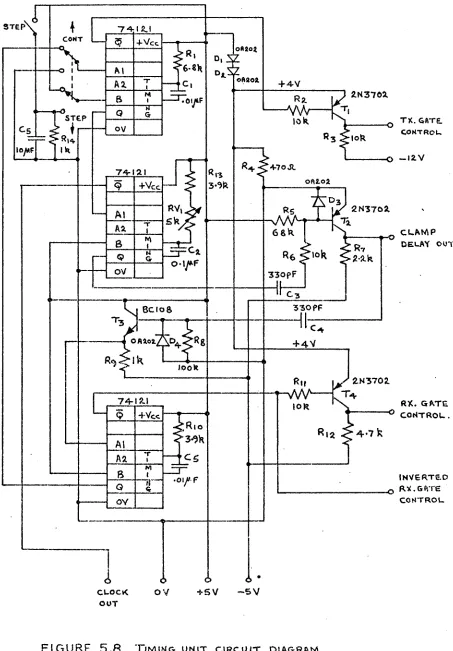
5.8 Timing unit circuit diagram.
82
5.9 Bandpass amplifier circuit diagram. 84
5.10 Frequency response of bandpass amplifier. 85
5.11
Transmitter gate circuit. 855.12
Detector unit circuit diagram. 885.13 Staircase generator circuit. 89
5.14
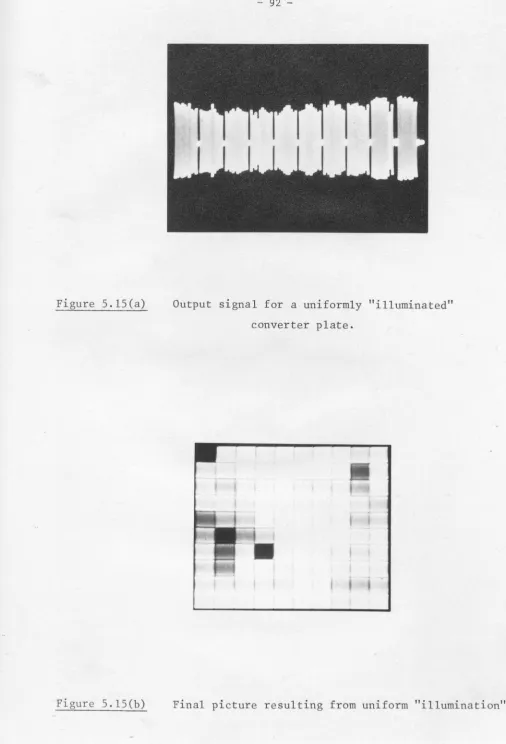
Staircase generator output waveform.5.15
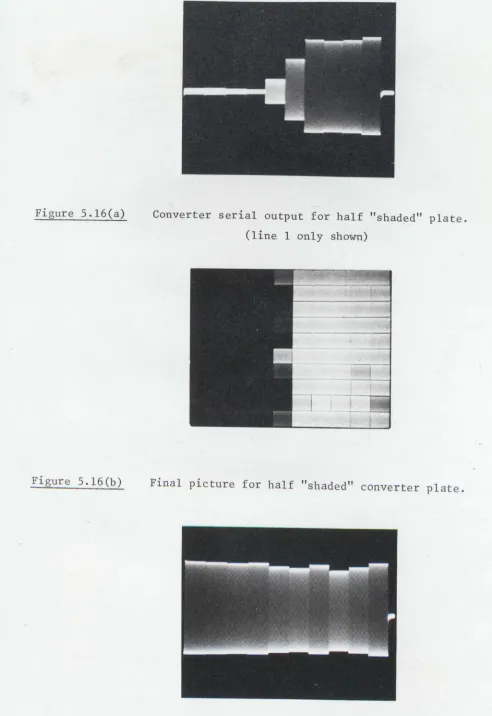
5.16
5.17
5.18
90
(a) Output signal for uniformly "illuminated" converter plate.
(b) Final pi.cture resulting from uniform "illumination".
92
(a) Converter serial output for half "shaded" plate.
(b) Final picture for half "shaded" .converter plate.
(c) Converter serial output for "unshaded" plate.
94
Image of 1·5 nm cross cut through 18 SWG aluminium sheet.
(a) Continuous wave transmission. (b) Pulsed transmission.
96
Image of 1'5 mm cross cut through 18 SWG aluminium sheet.
(a) Offset low.
(b) Offset high.
5.19
5.20
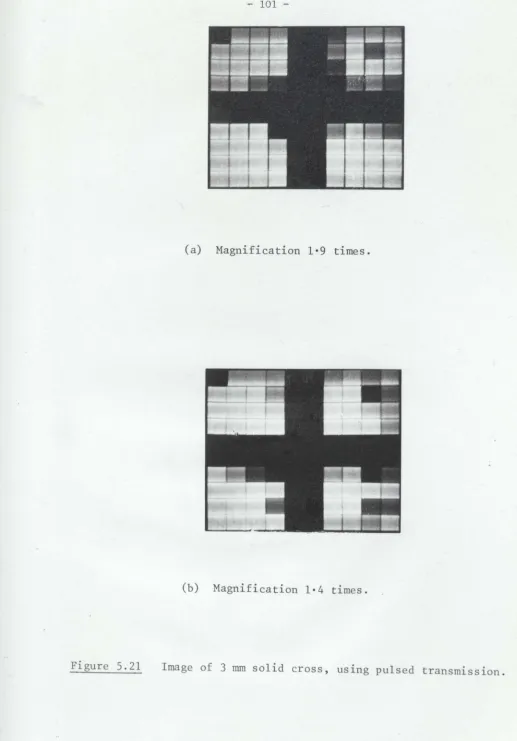
5.21
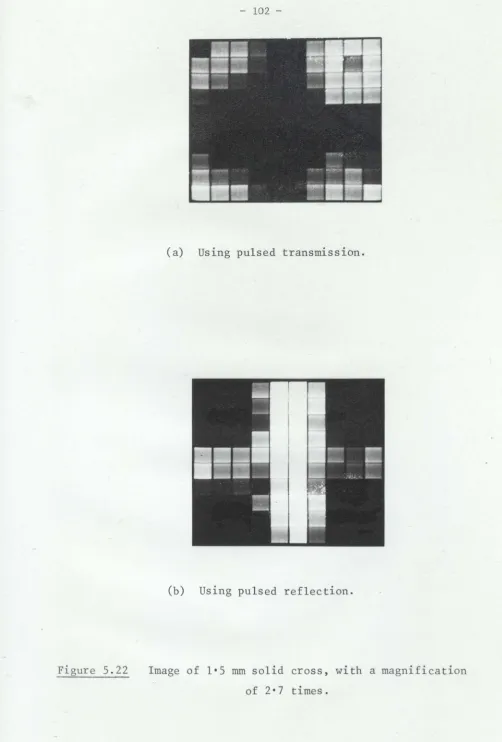
5.22
5.23
Image of 1'5 mm cross cut through 18 SWG aluminium sheet.
98
(a) Offset left. (b) Offset right.
Image of 1'5 mm cross cut through 18 SWG aluminium sheet, with arms at 450 to x-y converter matrix axes.
(a) Centrally placed.
(b) Offset so that one arm only imaged.
99
Image of 3 mm solid cross. (a) Magnification 1'9 times. (b) Magnification 1·4 times.
101
Image of 1'5 mm solid cross. (a) Using pulsed transmission. (b) Using pulsed reflection.
102
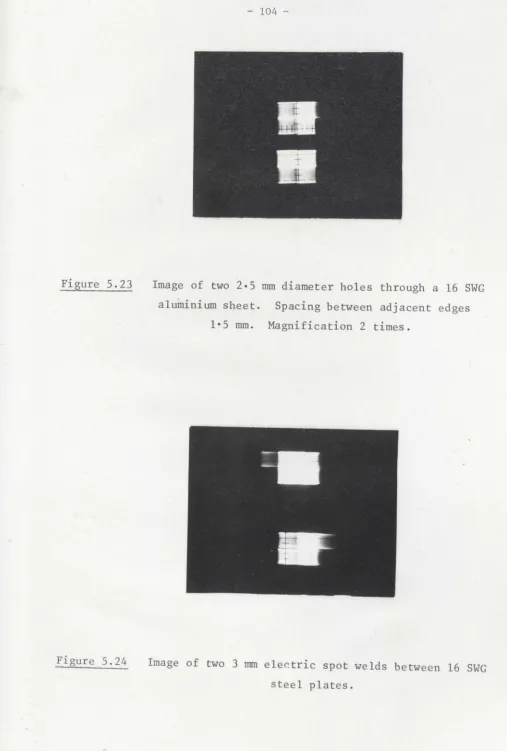
Image of two 2'S mm diameter boles through 16 SWG aluminium sheet. Spacing between adjacent edges
lot~
1·5 mm.
5.24 Image of two 3 mm electric spot welds. 104
5.25 Image of 10 mm diameter brass rod. 105
(a) . By pulsed transmission. (b) By pulsed reflection.
6.1 Path lengths between array and object plane. Ill.
6.2 Focused continuous aperture. 115
6.3 Input peripheral device selection and data transfer 122
logic.
6.4
6.5
6.6
6.7
Peripheral flag logic. 123
Outline of experimental system. 125
Phase detector additional logic. 128
(a) Reference and signal comparator amplifier circuit .:
129
6.8
6.9
ADC interconnections.
Simulated point source compared with real "point" source.
6.10
Computer reconstructed image of10
mm transmitter.6.11
Computer reconstructed image showing effect of maj or si de-lobe.6.12
Focused near field images.6.13
Focused near field lmages.6.14
Images by reflection.6.15
Perspex lens and computer "lens" comparison.7.1
Basic principle of system.7.2
Diagram showing how seq_uential sampling builds up the characteristic freq_uency.7.7
7.8
7.9
7.10
7.11
7.12
Diagram used for derivation of theory.
Plot of f
Re
against target bea~ing.Basic FET switch unit.
Experimental system for measurement of characteristic freq_uencies •
Experimental system for target range and bearing tests.
Positions of transmitters and the receiver array.
Output for transmitter No. 2 at 0°.
Output for transmitter No. 2 at 30•
Output for transmitter No. 2 at
7
0•Output for transmitter No. 1at 0° and :No. 2 at
7°.
7.13
Output using pulsed transmission. for transmitter No.1 at 00 end No.2 at7°.
Results using pulsed transmission with transmitter No.1 at 0° and No.2 at 7°.
Upper trace - ,Output of r'esonarrt filter t.uned to fROo• Lower trace - Input to power amplifier.
7.15 As above but with resonant filter tuned to fR 7°.
7.16 Proposed system to provide a
PPI
display of target positions. Table 2.1 4.1 4.2 5·1 7.2 Program 6.1 6.26.3
6.4List showing the more sensitive ultrasonic image converters.
Useful constants for the common transducer materials.
Cross-coupling test results.
Acoustic impedance and velocity for some common materials.
Experimental and predicted results for characteristic frequencies at s.sempiing frequency of 2 '26 MHz.
Experimental and predicted resUlts fer characteristic frequencies at a sampling frequency of 4'52 MHz.
Harmonic analysis of output signal.
Characteristic frequencies for ultrasonic frequencies of 547 kHz and 528 kHz.
Results for target 1 at 7°, target 2.at 10°.
Results for target 1at 0°
,
target 2 at 10°.Computation for path length phase increments.
Image reconstruction routine.
Phase and amplitude data acquisition.
FOCAL image ;reconstruction for simulated point. source.
1.. Introduction
Imaging, as distinct from other fOrm£ of information display, may be defined as being the formation of a visible image of an object plane or space, the latter lying usually norma1'to the axis of wave propagation and parallel to the converter image plate. The image has height and breadth only, there being no time related dimension except in the special
case of 3 dimensional imaging. Thus the photographic camera, television, radiography and the eye are all imaging systems • A basic ul trasonic imaging system is shown in figure 1.1 in which it is assumed, as is nor-raally the case, that conversion to an electrical signal is performed as an intermediate step between the ultrasonic and optical images. Parts T,
o
L~==B~;:---t--l+'i~
L ~--~
o
A typical ultrasonic imaging system using an acoustic lens.
O; Land C are all innnersed in a liquid (usually ware r) so that they are acoustically coupled. A generator G produces an electrical sinusoi.dal drive signal at the appropriate ultrasonic frequency to the
electro-ac.QUS tic transmitting tr ansduce r T which radiates towards the test object O• ~$'~J~te. "'~1\'3u~££raet~9n d . ... d . 1" • h
object and the acoustic lens L focuses the diffracted rays to form a
diffraction image on the image plate of the acousto~electric converter
e. The output of C is normally in the form of a serial line-by-line
scan of the image plate, being similar to a television video signal.
After amplification by A and, if necessary, detecti.on by D it is
pre-sented to a eRO as an intensity modulating signal. Scanning of both
converter plate and eRO is controlled by unit S. This system uses
through transmission, the transmitter being sited on the opposite side
of the object to the receiving converter. Sometimes it is advantageous
to have the transmitter placed on the same side as the converter so that
the latter collects reflected signals from the test object.
The possibilities of ultrasonic imaging were first pl't1ctically
1
realised by Sokolov in 1937. He successfully produced an €.lectron
scanned piezoelectric plate "camera" system which effectively became the
• 2, 3 I.
prototyp? for development by other workers in RUSSla , Germany s
5,6 7
Britain and the
U.S.A.
over many years. Although improvements arE'still being made, these converters possess some serious inherent
short-comings, as is evi dent when it is realised that they are still ill the
main used only.as laboratory research instruments.
The requirements of a flexible ultrasonic image conversion system
may be listed as follows:
(i) High sensitivity.
(ii) Image plate dimensions equivalent to at least
100 x 100 vave Iengths in the transmission medium.
(iii) Linear resolution equal to or better than 1
wave-length in thetransmi.ssion medium.
(iv) Retention in the output electrical signal of the
(v) Pulsed operation possible.
(vi) High reliability and minimal setting up
procedure.
The objectives of this research progrannne may be-divided into two
clear sections:
(a) The production of an ultrasonic image converter to satisfy
as many of the above requirements as possible, and,
(b) To investigate and compare various ways of processing the
signals to produce a visible image using the converter
developed in (a).
Chapter 4 deals in detail with (a) and chapters 5, 6 and 7 with (b). The
objective of section (a) h?s been achieved by effectively fonning the
converter image plate into a matrix of piezoelectric elements which are
then sequentially sampled by arrays of field effect transistors. The
result is a highly sensitive and reliable system with potentially none of
the inherent limitations of the Sokolov type tube converters. Three
forms of signal processing have been considered for section (b), an
acou-stic lens, a form of holographic reconstruction using an on-line computer
and a scanned ar ray technique based on the change in Doppler frequency
shift associated with target bearing. The techniques are compared and
their limitations and those of the solid state image converter discussed,
together with suggestions for further work, in chapter 8.
Ultrasonic imaging has important applications in two widely difierent
_areas, underwat er visualisation for ranges of up to 10 m or so, and
medi-cal diagnosis and associated work. Television is preferable for
under-water viewing in clear water, but most requi.rementis are for coastal or
conditions ultrasonic wave propagation, although suffering increased
30
attenuation, is still possible Medical uses would include amongst many
others, observation of the foetus, where X-rays are damaging, and heart
surgery where continuous visualisation is .an advantage. Short pulsed
31
operation is essential ,however, if the image converter Ls ever to
be-come a useful medical tool. Non-destructive flaw detection of solid
mate-rials, although a very desirable and much sort after application, is
inhe-rently a more difficult problem. The ima.ge converter requires virtually
perfect homogeneous coupli.ng between its whole frontal surface and the
object to be viewed. In the unlikely situation where this has an
appro-priate and large enough flat surface, then coupling may be achieved
direc-tly using a thick oil or grease, but for most applications immersion in a
coupling fluid (water or oil) is necessary. This introduces a reduction
in the system sensitivity due to impedance mismatch, and loss of defillition
due to ref raction caused by the irregular or non-coplanar face of the
ob-ject through which the ultrasound passes.
It is evident that there is an as yet unsatisfied need, over a very
, wide field, for a suitable ultrasonic image converter. It is hoped that
the FET scanned solid state converter may, after further development, prove
2. Ultrasonic Imaging Techniques
2.1 Introductory Review
Although many forms of ultrasonic image converters have been
devised, all but the electron tube and solid state types would appear
to be either too slow or to possess insufficient sensitivity. Table 2.1
lists for comparison some of the more sensitive forms of converter that
have been developed, giving their measured sensitivities, resolutions
and image formation times. The list has been restricted to those wi.th
-3 2
sensitivities greater than 10 W/cm. The first two provide direct
conversion to a visual image whereas the rest are all acousto-electric
and therefore require some form of electro-optical converter in order
to complete the imaging process. There are other solid state conve rte rs
whose send tivi ties have not as yet been pub lished and are t'he'ref or'e not
included in table 2.1.. Details of these are given in sections 2.3 and
2.4.
There have been several comprehensive reviews of ultrasonic imaging 12, 13, 1~
methods This review will be limited to electron tube and solid
state converters since the former is the only type with a comparable
Technique Limiting sensitivity W/cm Resolution Image formation Time. Seconds.
Optical detection of liquid surface
deformations.
Mechanical alignment of flakes in liquid -Pohlman CeU9•
Soko1ov tube:-Quartz face p1ate6• Ba Ti 03 face p1ate3
Cathode stabilised
tube:-Quartz face plateS.
Mechanically scanned quartz plate10•
Solid
state:-Bipolar transistor scanned PZT p1ate11
(20S MHz)
FET scanned PZT plate (the product of this
research programme)
-3
10Sx10 A few mm < 1
2°Sx10-3 several wavelengths < 1
Depends upon intensity
-7
1\
7xlO -S
I'
103xlO
-7
104x10
3x10-12 )
1 + 2 times thickness of plate.
,1\
loS wavelengths j < 002
)
< ·02
)
I
3 + 120
I
I)
2.2 Electron Tube Converters
Sokolov in 1937 pioneered the ultrasound camera with his ultrasonic 1,15
microscope ,although he gave very few details at the time. He was
the first to realise that a liquid damped. piezoelectric plate, rather
than vibrate as a whole, responds point by point to the incident local
sound intensity. This fact was vital to the satisfactory operation of
the image converter, which used a single homogeneous piezoelectric plate
as the first stage in the co.nversio.nprocess. Cameras later develo.ped
2, 3 It 6 7
in Russia , Germany ,Britain and America are all based on the same
principle of operation. A piezoelectric plate forms the end wall of a
cathode ray electron tube· so that its back face may be scanned by an
electron beam, whilst its front face is subjected to the ultrasound
pressure image. At equilibrium, the piezoelectric plate being a geod
insulator, the primary e1ectro.n beam current will equal the secondar.y
electron current passing back to what is termed the collector. However,
the ultrasonic pressure variations on the front of the plate change the
voltage on the back face, and the equilibrium voltage therefore requires
reestablishing~ This means that the secondary electron current will
reduce as the piezo voltage tends to rise and increase as it tends to
fal1. The output from the collector, consequently, takes the form of
an amplitude modulated wave at the ultrasonic frequency, the mo.dulation
representing the line-by-line spatial distribution of ultrasound Lnt
err-si.ty across the piezo plate. In order to produce a visible image this
electrical signal may be fed to the grid of a conventional display
cathode ray tube whose scanning is synchronised to. that of the converter.
This form of e1ec.tron scanned tube is termed collector stabilised.
5,16 17,18
Smyth and Sa.yers between 1954 and the early 1960's
which Sokolov had published on his tube. Its operation differs in one
major respect; the output is not coupled to the piezoelectric plate
voltage via a secondary electron current. Instead a signal plate is
included on the outer surface of the transducer and there is no
collec-tor ring within the tube. Acoustic to electric conversion is
effecti-vely completed in two separate electron scans. First, with the
ultra-sound off, a low velocity primary electron beam scans the target so that
no secondary emission takes place. Conse.quently, in order to satisfy
the equilibrium conditions, the target surface potential will be reduced
to that of the cathode at which stage no further electrons will reach
the target. The ultrasound is then switched on, a pressure image focused
onto the front face of the transducer, and the target once more scanned.
More electrons may now arrive at every point on the target surface where
the ultrasound impinges, but only during the positive half cycles of the
piezoelectric potential excursions. A charge distdbution is thus built.
up over the surface of the target which will be directly proportional to
the ultrasound intensity at any point. The build up of this charge ld11
induce corresponding currents in the signal plate, which is earthed to
the ultrasonic frequency, and these are used to provide an electrical
output signal. With the ultrasound off the first electron scan is then
repeated and now performs a discharging process in order to remove the
negative charge distributed over the target face.· The low velocity
electron beam contains a sufficient number of positive ions to make this
possible, and consequently the target potential is raised to that of the
cathode in the time available. The target is then ready for the next
charging or imaging scan. The output of this converter is a serial video
signal corresponding to the line-by-line distribution of sound intensity
the Soko10v tube. Because the target potential is maintained-at that of
the cathode, this type of tube converter is known as cathode stabilised.
2.3 Solid State Transistor Scanned Converters
Two bipolar transistor scanned ultrasonic image converters were
developed quite independently between 1966
11
under the direction of Knollman ,and the
and 1968, one in America
19
other in Britain, forming
the early pa-rt of this research programme (see Appendix A).
The former consisted of a 2·5 MHz half-wave thickness resonant
piezoelectric plate having on its uninsonHied face a 10 x 10 matrix of
square silver electrodes, and with overall dimensions of approximately
0·7 x 0·7 inches.
A
10 x 10 matrix of transducer gates controlled inrows and columns effectively scans the transducer element s and connect them sequentially to a common load. In order to overcome the capacitive
signa.1 feedthrough in the "off" gates at 2'5 MHz, frequency conversion
is carried out within the "on" gates creating a relatively low (500 ~Hz)
intermediate frequency. By selectively amplifying only this Lntermediat.e frequency, the feedthrough signals which will be at 2·5 HHz are rejected.
Mixing is performed by interrupting the gating signa.ls at the local
osci-Llat.or frequency so that a time varying switell conductance results. The sensitivity of thds vconverte'rbased on initial tests was approximately
-12 20,21
5 x 10 W/cm2, but later publications claimed figures of around
10-11 and better than 10-10 W/cm2•
The transistor scanned converter developed here at the start of
this
project, although basically ve.ry similar to the couver t.er described above ,
did not employ mixing to reduce the cross+coup ling problems. For this
reason it was limited to operating frequencies of 1 HHz or less. A
compo-site clamp-series switch a.:rr~~llgenent was investigated in an attempt to
10 mV or so. Since the clamp transistor had an inherent offset voltage,
signals of lesser amplitude than this were not affected and the circuit
therefore offered little advantage over that using a single series
transistor. Matrix drive signals were derived from two shift registers
rather than decade counters and decoders. Results were marred by
unreliable connections to the transducer elements and by the high level
of cross-talk or breakthrough signal (typically 50% of the total output
sign.al).
No
meaningful sensitivity tests were therefore made, andfurther work on this converter was quickly abandoned in favour of one
using FET gates. These gates showed great promise, with an "on" to "off"
signal output ratio of greater than 50 dB's at 6 MHz compared with less
than 30 dB's at 1 MHz using the bipolar transistor gate. This lead to.
the development of the FET scanned piezoelectric plate image converter
which has formed the basis of most of the experimental work carried out
under this research programme.
A detailed description of the FET scanned converter is given in
chapter 4. Operating at an ultrasonic frequency of 1 MHz it uses a
PZT.5A ceramic disc transducer, the rear face of which is formed into a
10 x 10 matrix of separate square silvered areas. Each of these areas
is connected to a common output line via two FET linear gates, one t.o
locate the row and the other the column. Two shift registers control
the gates so that the transducer elements are scanned sequentially line
by line. The output thus takes the form of an amplitude modulated wave
at the ultrasonic frequ.ency, the modulation representing the ultrasound
intensity distribution across the front face of the trrulsduceT. For
unity signal to noise ratio at the electrical output, an ultrasound -13
22
The principle has been further developed by Maginness at the
University of Stanford in 1973. A transmit-receive mode of operation
at an ultrasonic frequency of 3-5 MHz is used in conjunction with an
acoustic lens. The scanning both for transmitting an? receiving employs
special FET integrated MOS arrays. These are bonded directly to a thin
interconnecting layer which carries the necessary address and signal
conductors and wh:i.chis buHt up on the back face of the transducer
mat-rix. The result is an extremely compact and reliable arrangement, and
although at the time only a 10 x 10matrix had been produced, extension
to a 32 x 32 was considered quite feasible. The production of such a
device using modern solid state technology has been the long term aim
of this project (see Appendix A). Realisation of this objective has
been prevented by the problem associated with reliably bon-l i.ng the many required electrical connections on the underside of a silicon chip to
the appropriate signal and addressing conductors on the back face of the
transducer. With this overcome the solid state ultrasonic image
conver-ter should at last become the viable tool which to date no other
ultra-sonic image converter may claim to be.
2.4 Surface Acoustic Wave Scanned Transducer
23
A new type of ultrasonic imaging device which uses a-coustic
sur-face wave delay lines in.conjunction with FET mix~rs to scan a trans-23
ducer matrix in two dimensions was proposed by Havlice et a~. at the
University of Stanford in 1973. A one dimensional version had at that
stage been constructed, and, in conjunction with mechanical scanning in
the other dimension, produced. acceptable visual images on a eRO. The
single delay line has taps evenly distributed along its length, each tap
signal, at the ultrasonic frequency 00 , from the appropriate transducer
s
element. The mixer outputs are commoned so that as a short pulse of
frequency 001· is sent up the delay line and successively passes the taps,
transducer elements are effectively scanned to produce a serial output
at an intermediate frequency of 00 + 001' In addition to linear scanning
s
it is relatively easy by using a suitable frequency modulated linear
chirp as the input to the delay line to create a focusing action and
hence remove the necessity for an acoustic lens. '£Wo dimensional
scan-ning was to be achieved by using two acoustic delay lines, one to scan
the x direction and the other the y, forming a rastor scan of the
trans-ducer elements which lies at 450 to the x and y axies.
2.5 Discussion
The primary requirement of the ultrasonic image converter, in order
that the signal processing detailed in chapter 6 might be carried out,
was that it should retain in its electrical output the phase of the ultra-·
sonic signals. The Smyth cathode stabilised tube did not fulfil thi,s ,
and at the beginning of the research programme the Sokolov collector
7 24
stabilised tubes improved by Jacobs and Kennedy were not yet
commer-cially available. In any case these tubes which included an electron
multiplier, although more reli.able, did not have a significantly improved
general perform.ance. The inherent limitations which are brought about by
the necessity for a vacuum and the fact that the signal path includes a
low conductivity secondary electron current section were still present.
The former limits the maximum safe image plate diameter, although there
24-29
have been numerous attempts to overcome this , and the latter limits
the sensitivity due to both its noise content and the attenuation it
A new form of image converter, therefore, was required and with the concept of the solid state transistor scanned transducer it became a
worthwhile aim in itself. This converter, later developed to an FET
scanned version (see chapter 4), does not·have an inherent limitation on
image plate diameter, although in a non-integrated form the cost becomes
a prohibitive factor. Sensitivity measurements indicate this to be
possibly 5 orders higher than that claimed experimentally by Sokolov.
This comparison, however, takes no account of the "noisell introduced by
the transducer element to element output variations, which in the present
converter for even image plate insonification may be as high as 20%.
Image resolution across the piezoelectric image plate could be somewhat
better, since the transducer's rear face may be acoustically damped.t.o
further reduce the mechanical
Q.
The solid state converter developed by22
Maginness has greatly improved the prospects of this form of convert~r,
since its unique transmit-receive capability may be used with both lenses
and electrical signa.l processing techniques. The surface acoustic wave
delay line scanned converter by Havlice, a completely new method, although
23
up to the present only briefly described ,could prove to be an extremely
flexible and efficient arrangement, providing the proposed 2 di.mensional
scanning is practically feasible. Capacitive cross-coupling between the
effective x and y strip electrodes placed on each side of the transducer
3. Signal Processing Methods Applied to Ultrasonic Imaging
3.1 Acoustic Lenses and Mirrors
Acoustic waves in almost all respects behave in the same manner as
light waves; they are refracted, diffracted, reflected and absorbed, but
show little dispersion. There is an important ~ifference however;
acous-tic waves are subject to mode changes, particularly at liquid solid
inter-faces, where a proportion of the longitudinal wave energy (if that is the
original mode of transmission) is converted into shear waves (there is
also some conversion to surface waves). These increase as the angle of
incidence of the longitudinal waves to the interface increases.
On the basis of refraction and reflection it is clearly possible to
focus acoustic waves using both acoustic lenses or mirrors, and to thereby
form acoustic images. The resolvable detail of these will, in the main,
be limited by the same criteria as those applicable to optical Lmages .
Irr~ge aberrations will occur, particularly if a simple spherical design
is used, and the best achievable resolution in the image plane will be the
Airy disc of diameter 1·12
A
!,
whereA
is the wavelength in water (thetransmission medium), f is the focal length and d the diameter of the lens
or mirror.
The material of an acoustic lens should have an acoustic i.mpedance as
near as possible to that of the surrounding medIum in order to minimise
reflections) and should have a significantly different acoustic
longitu-dinal wave velocity. The r'eEl.ected energy increases with the angle of incidence, and therefore it is advantageous for the lens material to have
a. high refractive Lndex, since this results in a larger radius of curvature for a given focal length. The processing action performed by a convergent
lens may be considered as being a spadal spherical phase advance function
greater phase advance than those on the axis. This is achieved by formlng
the lens into a spherical shape such that, in the case of a lens material
where the acoustic velocity is higher than the surrounding medium, it is
concave, and for the reverse situation it is convex.
Acoustic mirrors have the advantage that complete reflection is ideal
and in practice is more easily achieved than the perfect impedance match
required by a lens. Where very large apertures are acceptable, for examr 32
pIe underwater imaging ,mirrors are very successful, but for the
visual-isation of small objects at short range a short focal length is needed,
resulting in an aperture limitat.ion. In the latter case, the converter
may seriously obscure the mirror, since the mirror is necessarily on the
same side as the incident waves to the converter. The problem becomes
clearly impossible if unity magnificatio~ is r.equired; the object and image
planes are physically in the same place. The signal processing action of
the spherical mirror is almost identical to that of the spherical lens;
non-paraxial rays are reflected before paraxial and a spatial sphe rical
phase advance function thus operates on the reflected rays so that they
are brought to a focus in the image plane.
3.2 Acoustic Holography 33,35 Principles 3.2.1
In order to establish a simple physical pict ure of the principles
involved in the formation of acoustic holograms and their image reccns
truc-tion, a 2-dimensional system will be considered using geometric ray theory.
No loss of generality results from the consideration of only t\V'0 dimensions.
Consider a ray, defined as a narrow beam which nevertheless is a
at z
=
z and meeting the Z-axis at z , as shown in figure 3.1.o
PLANE.
Re.FE.RENCE. SE-AM
z
Acovs rtc RAYS
'- HOL.OGRAPH IC. PLAKe:..
Figure 3.1 Formation of a hologram.
In the region of zl this wave may be represented by the expression:
A(zo) cos
[wt
+ Hzo) +2:
sin • zJ ...3.1
where
w
and A are the acoustic angular frequency and wavelength respec-tively, t the time, ex: the angle the r ay makes with the X-'axis, A(z ) the
0
amplitude of the ray, z a point on the Z-axis near zb and
q,
(zo) t.hephase of the ray. Similarly the reference beam may be represented at the
Z-axis, assuming unity amplitude, by the expression:
cos
[wt
- T
2w s m• 3.2where 0 is the angle of the reference beam to the x·-axis. Now consider
S\l'W\'MQd.J
• •• • o.'II\Q
the effect of tbese two waves be1ng malt1~11eft together on the Z-aX1S ~ $~u.fY\I::I!t ~u. ..TG.d.
9R t1.::te~=plaQ9. The relevant term of the result would be:
Note that this expression is independent of time and may thus be recorded
for various values of z to form an intensity pattern or hologram.
Assuming that the hologram has been recorded· on an optical
trans-parency, image recons t.ruct i.on is carried out by means .of a beam of coherent light, and if this is considered to be plane, then, in the plane of the
If
hologram may be represented by the expression:
cos
[WI
t - (~:)(~) sin 0.z ]3.4
where
wI
andAl
are respectively the angular frequency and wavelength ofthe Li.ght , The inclination of the light beam to the X-axis is a function
of the ratio of the optical to acoustica'lwavelengths, and is given by:
sin-I
[(¥)
sine ]
...
3.5
It is therefore approximately the angle
e
reduced by the ratio of the wavelengths.The rays passing through the hologram will have their amplitudes
multiplied by the intensity patterns recorded by the origina.l object rays.
For the light rays passing t.hrough the region around Zl of the hologram the wavefront emerging is obtained by multiplying together expressions 3.3
and
3.4,
resulting in:1
A(z ) coso [ Wj t + ~(Z 0) + (27T)
Al
(4t)
sin u:.z]
[ wI t
- Hz )
(27T) (b.) (2 sine
+ sin")J...
3 '.00
Al
A
+
1
A(z ) coso
Comparing the first term of expression 3.6 with expression 3.1 it will be
seen that they are identical except that the former is inclined to the
X-axis, or hologram norma}, at an angle of:
3.7
A
at an approximate distance of (-)x from the hologram, where x , as 'vill
Al 0 0
be seen in figure 3.1, is the original object Z-axis distance. Similarly
\
the second term of expression 3.6 represents a real image of the object
at the same distance from the hologram as, the virtual image, but angularly
separated.
3.2.2 Practical Considerations
33, 34, 36
Most successful experimental systems use an electrical square
law detector or multiplier to perform the essential reference signal
multiplication. If a multiplier is used then it is possible to introduce
the reference as an electrical signal whose phase is automatically
control-led by the mechanical scanning of the Z-plane by the a.coustic probe. At
present almost all Z-plane sensing is carried out by using a mechanically
controlled probe which scans the required'area at a suitable pitch. The
application of an electrical/electronic acousto-electric image converter
to this problem would offer a tremendous advantage, but the resolution
required, and in particular the aperture, is too great for any device
available at the moment. In order to correct for the vast difference in
the wavelengths of the acoustical and optical waves the hologram i.s
reduced by a. certain factor (around 10), and whilst this reduces thein~ge size by the same factor, the distance that the image lies from the
ho10-gram is reduced by the square of this factor. rrhi.~effect may be corrected
in practice by optically magnifying the image before viewing. 33
Aldridge used in his system 1 llS pulses and an ultrasonic frequency
1
of 10MHz, and this gave him a limiting resolution of about
6
mm in water and, with range gating, provided a resolution in depth of around 1·5 mm,A facsimile recorder synchronised "to the probe scanner produced the
ori-ginal i.ntensity plot, and this was then photographed and reduced in size 37
used in conjunction with a computer to perform simulated holographic
functions and it is claimed that the process is superior to the normal 38
area holograms. The application of a scanned linear array has been
considered, where a transistor scanned linear array of transducers is
moved mechanically to create the second dimension.
The striking 3-dimensiona1 visuaHsation afforded with optical
holo-grams is not in practice possible with acoustic holograms. Because of
the effectively very large apertures readily attainable with light, the
viewer may look at the image through only a small part of the aperture
and in so doing may view the image from different directions. In
prin-ci.pLe the same is possible in the acoustic case, bu.t in practice the
apertures are sma11 (a relatively small number of wavelengths across) and
the loss of resolution resulting from using only a small portion of the
aperture is usually unacceptable.
3.3 Image Recons.truction ~ Computer
3.3.1 General Principles
Figure 3.2 shows the basis of an imaging system comprised of an
electro-acoustic image converter and an insonified object situated in the
object plane. The 8.rrangement is 1ensless, the computer providing the
necessary signal processing to image the object.
£.L.e.CTRO-AeOIJSTIc:. COM PU'T ER .--\
r
C.ONVG.RTE.R •r---...;:..-- ...~
oSJe:.c,:r
r
PL.f,NE..p
IMAG-E.
AMPL.fTI.IOE DELAYS OF POINT ooC1l-¥---- ,\1'10
P, SUMIV.A'rlol'll.
The action of a lens, as described previously, would be to focus
the divergent IIrayslleminating from the object so that only at one point
in the image plane was the energy from this source concentrated. It may
be considered to do this by imposing a spherical phas~or time delay
function on the incident "raysll so that, as they leave, their phases are
such that the resulting signals are only in phase at one point, the focus.
There are thus three regions where spatial time variations occur; between
object and lens, within the lens itself, and between lens and image.
The computer must provide the last two in order to perform the analogous
function. It must arrange that the phases of all the received signals
radiating from the object point are equalised before a summation is made
to produce the image magnitude of the point. The computer delay function
for a given situation, although apprQltimately spherical, is therefore not identical to that of the lens.
3.3.2 Experimental Systems
A system using very short pulses and in consequence possessing a·wide 39,41,42
bandwidth was developed by Maginness , and this resulted in
provi-ding the additional facility of being able to Image over a range of harmond>
cally related frequencies. Transmitted signals consisted of pulses of
approximately 2 cycles duration of a 5 HHz wave, and recordings were made
of the signals reaching the receiving aperture by means of a mechanically
scanned transducer matrix. The signals were sampled at an effective rate
of 24 MHz before quantisation and conversion into a paper tape format.
After completing the recording of all 144 matrix element signals, the
tape:; were fed into a large computer, programmed to perform the necessary
processing. The latter took the form of a fast. Fourier transform. The
output, in the form of a 2-dimensional graded intensity print out,
slices through the material being viewed (an aluminium block) by calling
up the various object planes and frequencies as desired. The result was
a very satisfactory and flexible processing system, the l~eak link being
the long time involved in both the mecharri.cal scanning of the transducer
matrix and the production of and inputting to the computer of the paper
tape records. 40
Shondhi developed an experimental system in air at an audio
fre-quency of 6·7 kHz, again using mechanical scanning and off-line computer.
Results, showing the images of simple objects, are impressive.
Both the systems described suffer from the one major disadvantage;
the long delay between the acoustic image formation and the production of
the final visual image. The wide-band system, if it was to use its
wide-band properties, had a further problem; it requir.ed very large immediate
access computer word storage. These two factors encouraged the
investi-gation into an on-line narrow band single frequency system, described in
detail in chapter 6, and which forms one of the main applications of the
solid state ultrasonic image converter. For most anticipated practical
applications of any imaging system, real time working is almost essential,
a few seconds being at the most acceptable. Thus an essentially simple
approach was considered in order to minimise computer time and storage
requirements. Hence the processing performed by the computer is basically
as outlined in section 3.3.1 and consists of the addition of appropriate
phase increments to the digitised transducer element signals so that on
summation they appear to eminate only from the point in the object plane
being imaged. The elements of a 10 x 10 Uk~trix are scanned electronically
(see chapter 4) and the phase and amplitude of each measured, converted
into a digital form, and transferred to the computer store within the.
the computer modifies the phases of the element signals to "focus" a
particular point in the object plane. The modified signals are summed
to complete the "focusing" action for the point, and a repetition of this
process for all the other points in the oQject plane produces, after
suitable digital to analogue conversion, a visual picture.
3.4 Scanned Array Doppler System
An echo. returning from an insonified target situated in the far fie.ld
of an array of ultrasonic transducers will strike this array at an angle
dependent on the target bearing. If the array is linear and consists of
equally spaced elements which are sampled sequentially at a known and fast
enough rate, then the resultant electrical samples after demodulation will
produce a sinusoidal signal whose frequency is a function of the angular
bearing,
e,
of the target. This resultant frequency is given by theDoppler expression:
[
C]
fR fT 1
s
sin
e
:.:
Cl
where C
=
f d is the sampling velocity across the array,s s
3.8
fT is the frequency of the incident wave,
d the distance between adjacent element centres,
Cl the velocity of sound in the transmission medium,
and f the sampling frequency. s
In order to satisfy the sampling theorem f must clearly always be
s
greater than 2fR thus giving a boundary to the range of
e
for a given is'In practice with a finite array, and where sampling is continuous,
only certain discrete characteristic frequencies corresponding to discrete
For a continuous resultant sine wave to be produced the phase of the
signal from the last e.1ement should be l1e1>behind the phase of the first,
where 11~ is the phase difference between adjacent elements. The discrete
bearings caused by this limitation are given by:
e
=
S1n• -13.9
~lere q is an integer,
and n the total number of elements.
The Hmi tat ion expressed by this equation is brought about only by
the manner in which information is extracted from the resulting signal.
A s~ngle set of n samples across the array contains all the required
bearing information.
43, 44
A practical system was developed to establish the validity of
the theory and details of this will be found in chapter 7. It proved to
be a successful preliminary investigation and showed that further more.
detailed work would be useful. Although not: referred to at the time a
48
similar scheme had been attempted in 1962 using a scanned line hydrophone
The electronics used was not at the time good enough, it would seem, to
encourage further work, and although some useful results were obtained
particularly regarding noise performance, no publications since that date
have, as far as is known, been produced.
3.5 Comparison of Proc~ssing Techniques
The use of the signal phase infonnation forms a common thread which
runs through all the t't:chniquesdiscussed above. In the case of lenses
beam, and for the scanned array Doppler system the instantaneous amplitude
of the incident wave is sampled and the samples analysed for a phase
coherence at certain frequencies.
By far the simplest processing method is that using lenses or mirrors.
If carefully designed these can produce results which are difficult to
improve upon by other processing techniques using comparable aperture
dimensions. They are, however, somewhat inflexible in that the field of
view and magnification may not be rapidly changed when desired. They
require an intermediate coupling medium between the converter and the
object to be viewed, and whereas in an immersion system this presents no
problems, where imaging within the human body or within relatively large
solid objects is required, direct coupling of the converter to the body
is advantageous. With the other three processing methods discussed this
is possible, although it is not suggested that this could be usefully
applied to the scanned array Doppler sy'stem where far field operation is
required at present (although a focusing action should be possible).
TIle holographic technique provides excellent results, probably the
best that have .been produced by any method so far, but the apertures used
are relatively large and these are essentially part of the image conversion
section of the system, rather than part of the processing technique. If
the same apertures were used with the other processing methods, then they
would also be expected to produce comparable results. The imaging system
is more flexible than that provided by a lens, since the field of view
may be varied at will. This advantage is heavily outweighed by the long
processing time required for the scanning and photographic copying.
The most inherently flexible technique is that provided by computer
processing, and if a real time on-line system is considered, all imaging
r.equirements could be provided for. There are problems, however, one of
computation time increases approximately as the square of the aperture
dimensions. Another problem, which is shared with all systems where the
aperture is scanned before processing takes place, is that operation with
short pulses in conjunction with large apertures necessarily leads to a
long data collection time. A lens, on the other hand, does not have this
problem because processing of all the image points is effectively done in
parallel, i.e. at the same time.
The scanned array Doppler system has the same correlation between
resolution and aperture. Although an inherently very simple processing
method, in its present form it suffers from lack of sensitivity since only
one element of the array is acting as a receiver at anyone time. It
should be possible to overcome this, but at the expense of increased
complexity. Much further work is required to be done investigating this
technique before a proper asse.ssment on its qualities, or otherwise, can
be made.'
To sunnnarise, it wou'ld seem that lenses and mirrors offer the simplest
and most effective method of image construction for applications where
immersion is possible and where rapid changes of the field of view are not
required. Where flexibility in conjunction with reasonable speed is
required, computer processing offers distinct advanta8es, and where
4. The Solid-State Converter
4.1 Converter DevelopmeE!
By 1968 the highly reliable and relatively high frequency silicon
planar transistor was fast becoming a readily availabi~ and inexpensive
component. This fact and the expectation of a rapid advance in
integra-ted circuit technology, particularly in fabrication techniques, decided
consideration should be given to the feasibility of us:i.ngtransistor
ana-logue gates as a means of sampling the electrical signals developed on 5 the back face of a piezoelectric transducer. It had been shown by Smyth
and others that electron beam scanning of a piezoelectric plate transducer
was currently the most sensitive method of conversion, so that the
sensi-tivity of the proposed method was confidently expected to be at least equal
to and probably better than this. A ten element bipolar transistor (2N706)
scanned transducer array was constructed and results from underwater tests
with this were very encouraging. As a consequence of this initial success
a complete ten by ten transducer matrix, scanned by bipolar transistors
with shift register control was built. Full details, including results, of
this converter are given ill Appendix A. This simple system proved to be
highly reliable and within the limits of the inherent picture "grain" size
(0')' inch square on transducer plate), produced easily recognisable
pic-tures of simple objects. However, it was clear that serious image
de,gracl.a-don was being caused by the capacitive coupling of signals across cut+off
transistors. This cross-talk problem has been virtually overcome :tn the
present converter by the use of field effect transistors which possess a
very low OFF capacitance (typically around 0'1 pf) between their input and
output terminals. The following sections provide details of the design,
11111111111111111111
11111111111111111111
111111111111111111.
11111111111111111111
111111111111111111111
••••••••••
11111111111111111111
11111111111111111111
••••••
11•••
111111111111111111.
~t-v ':)
o
0. ..:J Z V -Cl) lIJr
l"
r.
-
.
.
(1 I.lI i-ll).
a
V) ~ lL.I ~z
er:
uJt- Cl 0 ~
I..L.. tU
-
W 0 _j::t: ::>
...
1Ll
tI)
\!1
cr
..J9
<t
~ "'Z ul<C
:i
U
z
:z
o, :>0 <t:
'2.
0!:!
«
U')ex:
l-:
tI)-z.
0 l1.I
«
:l: le. 0: ILl
I-~ ~ Cl)---~t-
.-wL
• S3J..\f-9 ~NI~3"d IJ...,olN iV?IJ..'tl"3A
..
j_
--{l
. ):f31.S'.g'3~•
.L.::fIHS , \l-J'.L~" '3-9U'.1..S ,II
-v,
'--0-s
uJ
\-(/) )0-ul tf)='
~ _J 0 ~ _JV
et: 7:11) 0:'CCl-r'
.l~v
~\-
OJz
:>_J
§O
l1.Jer
.0:
0:c
ut
l-a::
w
>
z, 0uJ
UI ::>e
c-il
0 -' t-<=, • Zo..t
<\-z::>
UJo 0 er:
~ ';)
~
e
0
Lt:
Figure 4.3(a)
Figure 4.3(b)
Typical converter output-transmitter off.
. I I I I I
4.2 General Principles of the FET Scanned Converter
The transducer, a lead-zirconate-titanate disc, has its front face
(Le. that upon which the ultrasonic waves impinge) completely silvered
and its rear face partially silvered to form a ten by ten matrix of one
hundred equal area but electrically isolated squares (figure 4.1). The
electrical signals ~rom the one hundred effective transducer elements so
formed are each passed through an FET analogue gate, their outputs being
commoned in ·such a way as to form ten separate lines representing the ten
horizontal lines of the matrix (figure 4.2). A ten stage shift register
is connected to these gates so that a single "0" shifted through the stages
causes vertical columns of gates to be successively opened. Thus a
hori-zontal scan of the transducer matrix is performed, but the output appears
on ten lines and vertical mUltiplexing has yet to be carried out. These
ten lines are then vertically scanned by a further ten FET gates controlled
in the same manner by a second ten stage shift register so that after each
horizontal scan is completed, the vertical scan is shifted one line down.
The resulting output becomes a single line on which the complete trans ducer
matrix signals in a multiplexed serial form appear. Since the analogue
gates do not perform any demodulation process, this output signal is an
amplitude modulated carrier at the ultrasonic frequency, the peak amplitude
of which at any instant is proportional to the ultrasonic intensity on the
transducer element being sampled at that instant (see· figure 4.3).
4.3 Constructional Details
The FET converter matrix was constructed in two parts, the transducer
assembly and the FET scanning matrix, these being electrically connected
before final encapsulation. A third part, the control circuitry, is remote
from the converter matrix and twenty-three wires connect this to the first
ULTRASONIC CAM EllA 10 le 10 HT MATRIX
C')
0
0 0 0 0 0 0
• • • •
--'01• • •
0 Gor
0•
•
•
•
••
••
• • 0 0 0 -0• •
0 0 0• 0
0 0
" • 0
•
0·
o 0 0 0•
-
-0• •
..
0• •
w •
0 G •
•
•
• • • •
o to·
0"
•
•
0• •
0" 0
•
0•
•
•
• •
• 0 .. 0 • 0 0 -0~ • 0
•
0 o 0 • • G•
• •
0 0 e•
e 0 0 0"
• • • • •
• Q 0•
0
•
•
0 •" • 0
..
0• •
0•
e•
0 0 " 00 0 0 0 0 0
• •
0 0 ....l_ 00
•
•
c..
•
•
0 ••
•
" 0
"
•
0 0 0• •
u-c
•
Cl 0 • 0 0 0 0:1
•
•
• ••
• ••
0• • • • • •
"•
e0 0
---.-
-,
The transducer assembly consists of a PZT5 (manufactured by Vernitron
Ltd.) disc of 50 mm diameter, thickness resonant at 1MHz. Both faces
have a double layer of fired on silver, but, by request, the special
prim-ing layer between ceramic and silver had been omitted so that etching
cou.ld be carried out. Using a photo-resist technique a pattern of elect··
rodes (figure
4.1)
was etched with a ferric nitrate etchant. The patternincludes a small circular electrode to be used as a transmitter for pulse-:
echo work. The main area consists of a square matrix of one hundred
ele-ments, each 80 mil by 80 mil with overall dimensions of one inch hy one
inch. Low temperature silver loaded solder and a temperature controlled
iron enabled one inch long unscreened 32 SWG wires to be attached to each
matrix electrode without fear of exceeding the Curie temperature. To
in-sure adequate mcchanic al strength after soldering a potting epoxy resi.n was
applied to a depth of approximately
!
inch around the wires.The FET scanning matrix was constructed (figure 4.4) using a
multi-layer printed circuit (figure 4.5) to form the electrical int.erconnections
between the 110 FET's. The 100 FET source leads to be connected to the
transducer electrodes were arranged to project on the under surface so thnt
by positioning the scanning matrix over the transducer assemLly the
appro-priate \li.reson one could be soldered to those on the other.
Finally, when a supporting frame and all the necessary control and
signal wires had been attached, the combined assembly was encapsulated in
silicone rubber (Silastoner 70). The final unit measures approximately
90 x 115 x 50 mm (see figure 4.6).
4.4 The Transducer
if,4. 1 Choice of Transducer Material
whether the choice, if unrestricted, wou ld have re.mained "Tith-the
lead--zirconate-titanate ferro-electric ceramic PZT-SA used. Three properties
of the material are important in relation to its application to the image
converter. Namely:
(i) its Curie point temperature should preferably
allow soldering direct to the transducer metal
coating,
(ii) it should have a high receiving sensitivity coupled with a low output resistance in relation
to the electrical load,
(iii) the lateral spreading of waves wi thin the
trans-ducer should be as small as possib le.
Piezoelectric canst. e33
C m-2
,_J~5Xl~~L
Table 4.1
0'17
Quartz
x cut.
Curie point temp.
°c
573Receiving const. g33
10-3 V m N-1 57'8
Mechanical Q
,---,---'7T-4 PZT-5A PZT-5H PZT-7A PZT··
--
f----,--,-328 365 193 350 3
26'1 24'8 19'7 39'9
24-15'1 15'8 23'3 9'5 13'
500 75 65 600 > 1
--
---'---1
I
8
I
i
._--.1
00
I
8 P,-,
8
03 .
_j
Consideration of the various constants given t.n table fr.l for quartz and the available PZT materials would immediately exclude PZT-5H owing to its
low Curie point temperature. With the except.ion of PZT-8 it can be seen,
have high receiving constants and are therefore more sensitive. In this
respect quartz is clearly the best, with PZT-7A next. However it has
40
been suggested that a greater lateral spreading of the waves occurs 1n
materials which possess high mechanical Q's, and on tI:isbasis PZT-5A
would be the choice, PZT-5H already having been excluded. Further
invE:s-tigation of the lateral spreading phenomenon is needed but it is
under-stood to be closely connected with mode conversion to shear and surface
waves within the transducer material (and possibly also within the backing
material, if solid). The effective electrical source resistance of the
transducer is also an important consideration, since some finite lORding
due to the amplifier input resistance must be present. The piezoelec.tric
constant e33 determines the mechanical to electrical transformation ratio and calculations for both quartz and PZT-5A are given in section 4.4.2
following. They show quartz as having a source resistance more than 4
orders larger than that for PZT-5A.
4.4.2 Source Resistance of Tuned Receiver Element
The back face loading of the transducer elements is virtually
incal-culable since the depth of solder, araldite and silicone rubber is not
accurately kaown, and in any case varies from element to element. It:will
therefore be assumed that the element is symmetricalLy loaded. The mechanical resistance R is given by,
m
R
=
peAm
4.1
-3
where p is the density of the wat er in kg In ,C is the velocity of sound
-1
in water in ms, and A is the transducer element cross-·sectional area in ffi2. The transformaticn factor 0::1 converts the mechanical resistance into the effective electrical source resistance, R ohms, so that,