ORIGINAL RESEARCH
INTERVENTIONAL
Nonsphericity Index and Size Ratio Identify Morphologic
Differences between Growing and Stable Aneurysms in a
Longitudinal Study of 93 Cases
X A. Chien,XM. Xu,XH. Yokota,X F. Scalzo,XE. Morimoto, andXN. Salamon
ABSTRACT
BACKGROUND AND PURPOSE: Recent studies have strongly associated intracranial aneurysm growth with increased risk of rupture. Identifying aneurysms that are likely to grow would be beneficial to plan more effective monitoring and intervention strategies. Our hypothesis is that for unruptured intracranial aneurysms of similar size, morphologic characteristics differ between aneurysms that continue to grow and those that do not.
MATERIALS AND METHODS: From aneurysms in our medical center with follow-up imaging dates in 2015, ninety-three intracranial aneurysms (23 growing, 70 stable) were selected. All CTA images for the aneurysm diagnosis and follow-up were collected, a total of 348 3D imaging studies. Aneurysm 3D geometry for each imaging study was reconstructed, and morphologic characteristics, including volume, surface area, nonsphericity index, aspect ratio, and size ratio were calculated.
RESULTS:Morphologic characteristics were found to differ between growing and stable groups. For aneurysms of⬍3 mm, nonsphericity index (P⬍.001); 3–5 mm, nonsphericity index (P⬍.001); 5–7 mm, size ratio (P⫽.003);⬎7 mm, volume (P⬍.001); surface area (P⬍.001); and nonsphericity index (P⫽.002) were significant. Within the anterior communicating artery, the nonsphericity index (P⫽.008) and, within the posterior communicating artery, size ratio (P⫽.004) were significant. The nonsphericity index receiver operating characteristic area under the curve was 0.721 for discriminating growing and stable cases on the basis of initial images.
CONCLUSIONS: Among aneurysms with similar sizes, morphologic characteristics appear to differ between those that are growing and those that are stable. The nonsphericity index, in particular, was found to be higher among growing aneurysms. The size ratio was found to be the second most significant parameter associated with growth.
ABBREVIATIONS:ACA⫽anterior communicating artery; BA/VA⫽basilar artery/vertebral artery; ICH⫽intracerebral hemorrhage; NSI⫽nonsphericity index; PcomA⫽posterior communicating artery
B
ecause part of the population has asymptomatic, unruptured intracranial aneurysms (1%–3%), they are regularly inciden-tally detected with medical imaging.1,2An appropriate course ofmonitoring or intervention must then be decided. While this
de-cision is relatively straightforward for larger intracranial aneu-rysms (⬎7 mm), the best approach for smaller aneurysms is less clear. Recent studies have found a positive correlation between aneurysm growth and rupture.3-6Therefore, it would seem
ben-eficial to identify small aneurysms likely or unlikely to grow and plan treatment/monitoring strategies accordingly.
An unruptured aneurysm may be detected at any size when it becomes symptomatic or incidentally detected through imaging. Currently, from such a snapshot, it is difficult to guess the natural history of an aneurysm: Is it relatively new and rapidly growing or has it gradually increased in size; is it still growing or relatively stable? At present, there is no clear information to predict whether an aneurysm will continue to grow, while certain fac-tors, such as anatomic location, correlate with significantly increased rupture risk.7The objective of this research was to
address whether aneurysm morphologic characteristics, size and shape, may provide an additional means of identifying future growth.
Received August 13, 2017; accepted after revision November 13.
From the Departments of Radiological Science (A.C., M.X., H.Y., E.M., N.S.) and Neurology (F.S.), David Geffen School of Medicine at the University of California, Los Angeles, Los Angeles, California.
This work was supported, in part, by a Brain Aneurysm Foundation Research Grant; a Society of Interventional Radiology Foundation Dr. Ernest J. Ring Academic De-velopment Grant; and a University of California, Los Angeles Radiology Exploratory Research Grant.
Paper previously presented, in part, at: Annual Meeting of the American Society of Neuroradiology, Washington, DC; May 21–26, 2016.
Please address correspondence to Aichi Chien, PhD, Department of Radiological Science, David Geffen School of Medicine at UCLA, 10833 LeConte Ave, Box 957350, Los Angeles, CA 90095; e-mail: [email protected]
Indicates article with supplemental on-line table.
During the past decade, many imaging-derived indices have been proposed for assessing aneurysm risk, primarily focused on identifying differences between ruptured and unruptured aneu-rysms.8-12These indices include a broad variety of metrics, some of
which, like wall shear stress or the pulsatility index, are calculated through computational simulation.13-16 However, to date, there
have been few studies of aneurysm growth that focus on imaging-derived indices.17,18For this research, we focused on morphologic
characteristics, which, as a group, are directly calculated from 2D/3D images without simulation. As a result, these types of indices are simpler to use and more easily applied to larger sample sizes.
The simplest morphologic characteristic describing an aneurysm is its size, typically represented by its maximum diameter.2Indices
investigated in this study include volume, surface area, the nonsphe-ricity index (NSI), aspect ratio, and size ratio.9,19,20While these
rep-resent a small selection of previously published indices, they all have previously been identified as having some predictive value for dis-criminating ruptured/unruptured aneurysms; therefore, because
there is an association between aneurysm growth and rupture, these indices were chosen for this study.3,5,6 Because this
study analyzed longitudinal data, in addi-tion to comparing morphologic indices for aneurysms at diagnosis and grouped by location, aneurysm imaging studies were segregated by size.
MATERIALS AND METHODS
Case InformationThis study was performed the with ap-proval of the institutional review board. It was a retrospective analysis of intracranial aneurysm cases with follow-up imaging in the data base of our medical center. All the CT angiograms were acquired on the basis of an established clinical imaging protocol for brain aneurysm follow-up, to ensure consistency for clinical aneurysm man-agement.21,22 Ninety-three intracranial
aneurysms (23 growing, 70 stable) from 2010 to 2015 with at least 1 imaging fol-low-up were selected. An aneurysm was classified as growing if it exhibited a
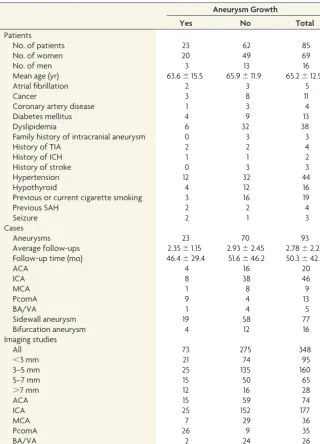
[image:2.594.54.375.54.499.2]⬎0.6-mm increase in diameter measured in all subsequent imaging studies. CTA images at each time point for aneurysm diagnosis and follow-up were collected. A total of 348 CTA volumetric imaging sets were included. Aneurysms were followed for a mean of 50.3⫾42.6 months, with a mean of 2.78⫾2.21 follow-up imaging dates, for a mean of 3.35⫾1.35 imaging studies per aneurysm case. Patient infor-mation and aneurysm characteristics, in-cluding location, aneurysm type, and im-aging study numbers, are summarized in
Table 1.
Image Processing and Analysis
For each aneurysm, 3D geometry for each imaging study was re-constructed and basic morphologic characteristics such as vol-ume and surface area were calculated.23,24From these, the NSI
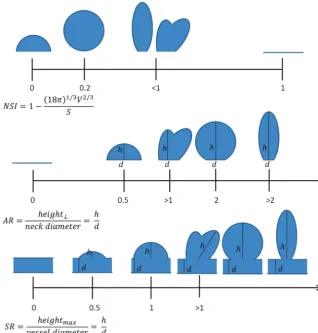
was calculated. Aspect ratio and size ratio were based on manual measurements made by a skilled radiologist who was blinded to whether aneurysms were growing or stable.Figure 1shows the formulas used for calculation of the indices as well as a depiction of where various shapes fall within the range of values, because this is sometimes difficult to decipher from the formula. As men-tioned above, for analysis, the imaging studies were divided into 4 categories (⬍3 mm, 3–5 mm, 5–7 mm, and⬎7 mm). Growing and stable aneurysms were also grouped for analysis by general anatomic location (anterior communicating artery [ACA], ICA, MCA, posterior communicating artery [PcomA], or basilar ar-tery/vertebral artery [BA/VA]) and type of aneurysm (sidewall or bifurcation).
Table 1: Case information
Aneurysm Growth
Yes No Total
Patients
No. of patients 23 62 85
No. of women 20 49 69
No. of men 3 13 16
Mean age (yr) 63.6⫾15.5 65.9⫾11.9 65.2⫾12.9
Atrial fibrillation 2 3 5
Cancer 3 8 11
Coronary artery disease 1 3 4
Diabetes mellitus 4 9 13
Dyslipidemia 6 32 38
Family history of intracranial aneurysm 0 3 3
History of TIA 2 2 4
History of ICH 1 1 2
History of stroke 0 3 3
Hypertension 12 32 44
Hypothyroid 4 12 16
Previous or current cigarette smoking 3 16 19
Previous SAH 2 2 4
Seizure 2 1 3
Cases
Aneurysms 23 70 93
Average follow-ups 2.35⫾1.15 2.93⫾2.45 2.78⫾2.21
Follow-up time (mo) 46.4⫾29.4 51.6⫾46.2 50.3⫾42.6
ACA 4 16 20
ICA 8 38 46
MCA 1 8 9
PcomA 9 4 13
BA/VA 1 4 5
Sidewall aneurysm 19 58 77
Bifurcation aneurysm 4 12 16
Imaging studies
All 73 275 348
⬍3 mm 21 74 95
3–5 mm 25 135 160
5–7 mm 15 50 65
⬎7 mm 12 16 28
ACA 15 59 74
ICA 25 152 177
MCA 7 29 36
PcomA 26 9 35
Statistical Analysis
Statistical comparisons between growing and stable groups were made using a 2-tailedttest with an assumption of unequal vari-ance (Welch ttest). The Pearson2test was used to compare
patient information between groups (Table 1). For all statistical analyses, a significantPvalue was .01. Statistical analysis was per-formed and figures were prepared in SPSS 24 (IBM, Armonk, New York) and Excel (Microsoft, Redmond, Washington).
RESULTS
Aneurysm Size versus Morphology
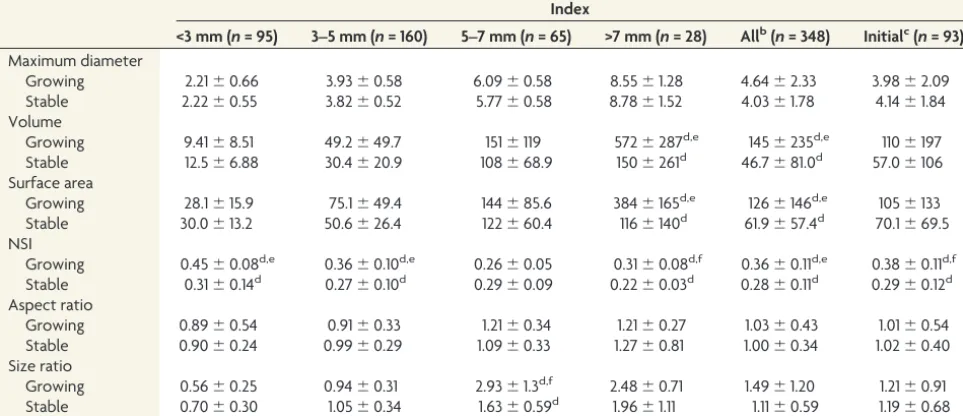
No significant differences in patient information were found be-tween growing and stable aneurysm groups (Table 1). Statistical analysis identified different morphologic indices as significant when examining different groups of images. Measurements for growing and stable aneurysm images segregated by size are sum-marized inTable 2. For very small aneurysms (⬍3 mm), the NSI (P⬍.001) was significantly different between growing and stable groups. For aneurysms of 3–5 mm, only the NSI was significant as well (P⬍.001). For aneurysms of 5–7 mm, only the size ratio was significant (P⫽.003). For large aneurysms (⬎7 mm), volume (P ⬍.001), surface area (P⬍.001), and NSI (P⫽.002) were significantly different among the groups. When we considered all
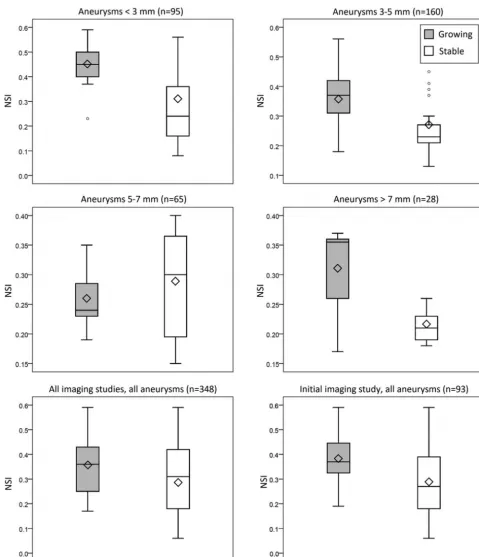
diagnoses and follow-up time points to-gether, volume (P⬍.001), surface area (P⬍.001), and the NSI (P⬍.001) were significant. Finally, when considering only the initial imaging study for each aneurysm, effectively examining all an-eurysm cases at diagnosis, only the NSI (P⫽.003) was significant for growing versus stable. In all analyses in which the NSI was significant, it was consistently higher in the growing group versus the stable group.Figure 2presents boxplots of the NSI for the growing and stable groups segregated by size.
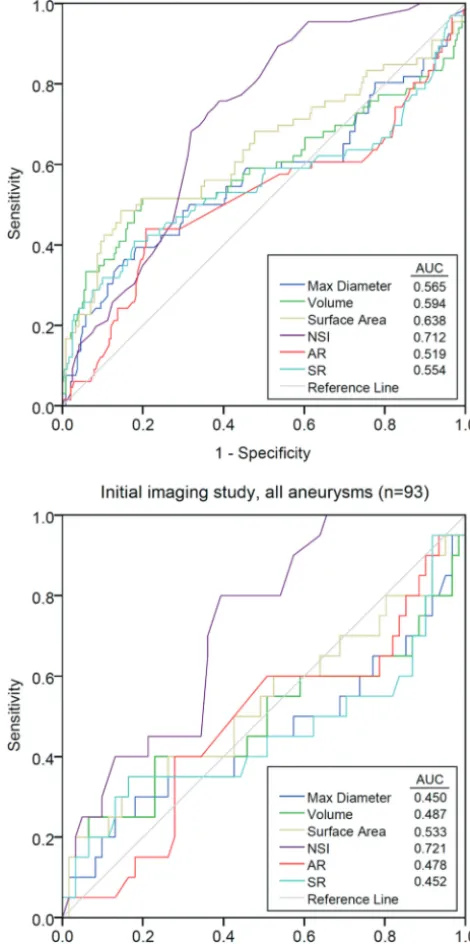
Receiver operating characteristic curves were plotted for the various indi-ces for growing versus stable (Fig 3). When all imaging studies for all aneu-rysms were included, the NSI provided superior discrimination between groups, with the area under the curve of 0.712 versus indices such as surface area (area under the curve⫽0.638). When only the initial imaging study from all aneurysms was included, the NSI was again superior to the other indices (area under the curve⫽0.721).
Aneurysm Location versus Morphology and Aneurysm Type versus Morphology
Results from comparing growing and stable aneurysms by location are sum-marized inTable 3. Within the ACA, the NSI (P⫽.008) was significantly differ-ent between growing and stable aneurysms. Although no signifi-cant differences were found among ICA aneurysm groups, a trend toward a difference in the NSI (P⫽.014) was observed. The size ratio (P⫽ .004) was significantly different between groups of aneurysm images within the PcomA. MCA and BA/VA imaging studies were excluded from the location analysis because of insuf-ficient growing aneurysms. In the analysis of growth in bifurca-tion and sidewall aneurysms (17% and 83% of total cases, respec-tively;Table 1and On-line Table), the NSI was the only significant factor between growing and stable in sidewall aneurysms (P⫽
.006) (Table 4).
DISCUSSION
Several common morphologic indices for describing aneurysms are highly dependent on diameter, such as volume, surface area, aspect ratio, and size ratio (aspect ratio and size ratio calculate a ratio on the basis of the aneurysm neck and parent artery diame-ter, respectively, characteristics typically much less variable than aneurysm height) (Fig 1).19,20Indices such as the NSI are
inde-pendent of aneurysm diameter and, while slightly more compli-cated to calculate, in exchange provide more robust shape char-acterization and, on the basis of this study, appear to provide
[image:3.594.54.373.49.382.2]more consistent growth prediction.8,9For all except the smallest
aneurysms, volume and surface area were larger for growing an-eurysms than stable anan-eurysms, though this was only significant among large (⬎7 mm) aneurysms and when all aneurysm imag-ing studies were considered. These indices not beimag-ing significant among smaller aneurysms may indicate that differences in aneu-rysm morphology are more pronounced for larger aneuaneu-rysms (Table 2).
When the NSI was significantly different between growing and stable groups, it was consistently higher in the growing group. Referring toFig 1, this higher NSI corresponds to the growing aneurysms having a more irregular shape. If one considers the association previous studies have found between growth and rup-ture, a higher NSI among growing aneurysms is consistent with previous findings of a higher NSI among ruptured aneu-rysms.9,10,25 When we further considered morphologic
differ-ences among aneurysm sizes, aneurysms of 5–7 mm were found, in general, to be less irregular (more spheric) than smaller or larger aneurysms, as indicated by the NSI values. A plausible ex-planation for this finding is that aneurysms in this size range are close to the treatment threshold and the more irregular cases were treated instead of being followed with imaging. Among the loca-tions, MCA aneurysms were the least irregular, with PcomA an-eurysms having the most convoluted and complex shapes (Table 3). This finding might be due to fewer cases in these locations and the influence of treatment preferences. Because bifurcation aneu-rysms are usually considered to have a high rupture risk, in our study, 83% of the cases were sidewall aneurysms. Previous work by Baharoglu et al12showed the NSI to be associated with rupture
in bifurcation aneurysms. In this study, we found the NSI to be significantly higher in growing sidewall aneurysms, while it was not significantly different in bifurcation aneurysms, possibly due to the relatively small percentage of bifurcation cases. This finding
may also be because the current study investigated the growth of a low-risk group of aneurysm cases with an average size of 4 mm, while the study of Baharoglu et al12was focused on aneurysms with
high rupture risk, on average 7 mm. The NSI values recorded in this study were higher than values previously reported by other research-ers for intracranial aneurysms.9,10,17The reason is unclear but may be
due to the smoothing of reconstructed aneurysm geometry, or a lack thereof, before calculation of aneurysm volume and surface area.
Because aneurysms may be detected at any point during their natural history, when one considers longitudinal data, each imag-ing study may contribute additional information. From the per-spective of natural history, there is not anything special about the initial images of an asymptomatic unruptured aneurysm versus images obtained at follow-up. There may, however, be differences among the longitudinal images, due to growth or simply the de-tails of the image acquisition. In the current research, the rationale for performing most of the statistical analyses at the level of the imaging study instead of the aneurysm case was to better identify predictors that might be applied to evaluate initial diagnostic im-ages in combination with size, currently a major criterion for treatment/follow-up decisions. This research supports aneurysm growth being predicted by the same morphologic characteristics previously shown to be significant for rupture, specifically NSI.
The results of this study contrast with a previous, multicenter prospective study that investigated the ability of various indices to predict subsequent aneurysm growth.17Beyond the
prospective-versus-retrospective study design and single time point versus multiple time point image analysis, there are several differences that might explain the apparent discrepancy. First and foremost, the criteria for growth were different between the 2 studies, with the current study relying on a fixed size threshold (0.6 mm) con-firmed by subsequent images and Ramachandran et al17using
expert clinician review. Second, the follow-up duration was
con-Table 2: Index values for growing and stable aneurysms segregated by sizea
Index
<3 mm (n= 95) 3–5 mm (n= 160) 5–7 mm (n= 65) >7 mm (n= 28) Allb(n= 348) Initialc(n= 93)
Maximum diameter
Growing 2.21⫾0.66 3.93⫾0.58 6.09⫾0.58 8.55⫾1.28 4.64⫾2.33 3.98⫾2.09
Stable 2.22⫾0.55 3.82⫾0.52 5.77⫾0.58 8.78⫾1.52 4.03⫾1.78 4.14⫾1.84
Volume
Growing 9.41⫾8.51 49.2⫾49.7 151⫾119 572⫾287d,e 145⫾235d,e 110⫾197
Stable 12.5⫾6.88 30.4⫾20.9 108⫾68.9 150⫾261d 46.7⫾81.0d 57.0⫾106
Surface area
Growing 28.1⫾15.9 75.1⫾49.4 144⫾85.6 384⫾165d,e 126⫾146d,e 105⫾133
Stable 30.0⫾13.2 50.6⫾26.4 122⫾60.4 116⫾140d 61.9⫾57.4d 70.1⫾69.5
NSI
Growing 0.45⫾0.08d,e 0.36⫾0.10d,e 0.26⫾0.05 0.31⫾0.08d,f 0.36⫾0.11d,e 0.38⫾0.11d,f Stable 0.31⫾0.14d 0.27⫾0.10d 0.29⫾0.09 0.22⫾0.03d 0.28⫾0.11d 0.29⫾0.12d Aspect ratio
Growing 0.89⫾0.54 0.91⫾0.33 1.21⫾0.34 1.21⫾0.27 1.03⫾0.43 1.01⫾0.54
Stable 0.90⫾0.24 0.99⫾0.29 1.09⫾0.33 1.27⫾0.81 1.00⫾0.34 1.02⫾0.40
Size ratio
Growing 0.56⫾0.25 0.94⫾0.31 2.93⫾1.3d,f 2.48⫾0.71 1.49⫾1.20 1.21⫾0.91
Stable 0.70⫾0.30 1.05⫾0.34 1.63⫾0.59d 1.96⫾1.11 1.11⫾0.59 1.19⫾0.68
aData are presented as mean⫾SD. b
The “All” column includes all imaging studies for all cases. cThe “Initial” column includes the first imaging study for all cases. d
Significant difference between groups. eP⬍.001.
[image:4.594.54.536.59.267.2]siderably longer in the current study (an average of approximately 4-versus-2 years). Given the growth rates observed in our popu-lation sample, many of the aneurysms in the current study would have been incorrectly classified as stable with only a 2-year follow-up. In some combination, these differences in study design may be responsible.
As the receiver operating characteristic curves illustrate (Fig 3), for our population sample, the NSI was able to more
consistently discriminate growing and stable aneurysms on the basis of the initial imaging study than aneurysm diameter or other shape indices. The NSI therefore appears to be a useful metric for identifying aneurysms likely to continue to grow, and we hope to eventually see it incorporated into aneurysm management decisions. Growth studies require longitudinal datasets and consequently require the analysis of many more sets of images. Because morphologic characterization of
[image:5.594.52.532.43.600.2]rysms is relatively rapid, such assessments can be scaled for multicenter studies or clinical practice. Future work will com-bine morphologic indices like the NSI with more detailed epi-demiologic analysis.
Limitations
Because this was a single-center retrospective study, it has bias, including existing treatment preferences, such as anatomic loca-tion and type, which results in censoring of data. In addiloca-tion, the
sample is likely biased against aneurysms⬎7 mm and of irregular shape because these are more frequently treated, except in cir-cumstances such as advanced age. Such bias is likely to be present in a prospective study as well, to not endanger patient safety. Re-garding the measurement method, as aneurysm size decreases, the accuracy of measurements does as well. Examination of how dif-ferent CTA imaging protocols affect such measurements would be beneficial.26Finally, as expected on the basis of the frequency of
intracranial aneurysm growth after diagnosis, there are signifi-cantly more stable aneurysms than growing aneurysms in the study. This finding is further exacerbated in some of the size/ location groups and may make it more challenging to generalize the findings to the broader population. A larger, multicenter ret-rospective study including several years of data could address most of these issues.
[image:6.594.51.286.62.534.2]FIG 3. Receiver operating characteristic curves for each of the indices included in the study, for all imaging studies, and the initial imaging study only. Area under the curve values are listed in the legends. The NSI provides the best discrimination between growing and stable aneurysms (area under the curve⫽0.712 for all imaging studies, and area under the curve⫽0.721 for the initial imaging study). AR indicates aspect ratio; SR, size ratio; max, maximum.
Table 3: Index values for growing and stable aneurysms segregated by locationa
Index ACA ICA PcomA
Maximum diameter
Growing 4.66⫾2.63 3.86⫾1.45 5.20⫾2.85 Stable 3.76⫾1.77 4.36⫾1.88 4.05⫾1.30 Volume
Growing 71.8⫾69.6 85.5⫾175 260⫾324 Stable 47.2⫾45.8 51.9⫾99.7 82.6⫾102 Surface area
Growing 75.2⫾60.7 87.5⫾116 202⫾192 Stable 57.3⫾38.9 68.5⫾65.4 105⫾91.8 NSI
Growing 0.31⫾0.11b,c 0.38⫾0.12 0.39⫾0.08 Stable 0.22⫾0.07b 0.31⫾0.12 0.45⫾0.08 Aspect ratio
Growing 0.95⫾0.25 0.90⫾0.40 0.98⫾0.29 Stable 1.17⫾0.39 0.96⫾0.33 0.73⫾0.25 Size ratio
Growing 1.53⫾1.09 0.93⫾0.55 1.40⫾0.86b,c Stable 1.48⫾0.75 1.03⫾0.50 0.81⫾0.33b a
Data are presented as mean⫾SD. b
Significant difference between groups. c
[image:6.594.300.533.63.259.2]P⬍.01.
Table 4: Index values for growing and stable aneurysms segregated by aneurysm typea
Bifurcation (n= 16) Sidewall (n= 77) Max diameter
Growing 4.19⫾1.68 3.93⫾2.21
Stable 3.96⫾2.16 4.18⫾1.79
Volume
Growing 54.8⫾52.5 122⫾214
Stable 51.0⫾57.1 58.2⫾114
Surface area
Growing 68.9⫾42.9 113⫾145
Stable 62.7⫾51.8 71.7⫾73.0
NSI
Growing 0.31⫾0.10 0.39⫾0.11b,c
Stable 0.22⫾0.07 0.31⫾0.12b
Aspect ratio
Growing 1.00⫾0.33 1.01⫾0.57
Stable 1.02⫾0.32 1.02⫾0.41
Size ratio
Growing 1.71⫾1.45 1.11⫾0.77
Stable 1.37⫾0.91 1.15⫾0.62
Note:—Max indicates maximum. aData are presented as mean⫾SD. b
[image:6.594.301.532.316.511.2]CONCLUSIONS
This study identified a significant relationship between aneurysm morphologic characteristics and growth. Specifically, the NSI was relatively consistently associated with growth in various analyses, in which it tended to be larger for aneurysms that would continue to grow. Additional shape indices such as size ratio were found to be associated with growth for particular size ranges and locations. Morphologic analysis appears to be a powerful means of identify-ing aneurysms likely to grow as well as a useful tool to investigate aneurysm growth, suitable for studies with many cases.
Disclosures: Aichi Chien—RELATED:Grant: Brain Aneurysm Foundation Research Grant and Society of Interventional Radiology Foundation Dr. Ernest J. Ring Academic Development Grant.* *Money paid to the institution.
REFERENCES
1. Brown RD. Unruptured intracranial aneurysms. Semin Neurol
2010;30:537– 44CrossRef Medline
2. International Study of Unruptured Intracranial Aneurysms Investi-gators.Unruptured intracranial aneurysms: risk of rupture and risks of surgical intervention. N Engl J Med 1998;339:1725–33 CrossRef Medline
3. Villablanca JP, Duckwiler GR, Jahan R, et al.Natural history of asymptomatic unruptured cerebral aneurysms evaluated at CT angiography: growth and rupture incidence and correlation with epidemiologic risk factors. Radiology2013;269:258 – 65 CrossRef Medline
4. Chien A, Liang F, Sayre J, et al.Enlargement of small, asymptomatic, unruptured intracranial aneurysms in patients with no history of subarachnoid hemorrhage: the different factors related to the growth of single and multiple aneurysms.J Neurosurg2013;119: 190 –97CrossRef Medline
5. Backes D, Rinkel GJ, Laban KG, et al.Patient- and aneurysm-specific risk factors for intracranial aneurysm growth: a systematic review and meta-analysis.Stroke2016;47:951–57CrossRef Medline 6. Brinjikji W, Zhu YQ, Lanzino G, et al.Risk factors for growth of
intracranial aneurysms: a systematic review and meta-analysis.
AJNR Am J Neuroradiol2016;37:615–20CrossRef Medline 7. Bijlenga P1 Ebeling C, Jaegersberg M, et al; @neurIST Investigators.
Risk of rupture of small anterior communicating artery aneurysms is similar to posterior circulation aneurysms. Stroke 2013;44: 3018 –26CrossRef Medline
8. Chien AC, Sayre J, Vin˜uela F.Comparative morphological analysis of the geometry of ruptured and unruptured aneurysms. Neurosur-gery2011;69:349 –56CrossRef Medline
9. Raghavan ML, Ma B, Harbaugh RE.Quantified aneurysm shape and rupture risk.J Neurosurg2005;102:355– 62CrossRef Medline 10. Dhar S, Tremmel M, Mocco J, et al.Morphology parameters for
intracranial aneurysm rupture risk assessment.Neurosurgery2008; 63:185–96; discussion 196 –97CrossRef Medline
11. Xiang J, Natarajan SK, Tremmel M, et al. Hemodynamic-morpho-logic discriminants for intracranial aneurysm rupture.Stroke2011; 42:144 –52CrossRef Medline
12. Baharoglu MI, Lauric A, Gao BL, et al.Identification of a dichotomy in morphological predictors of rupture status between sidewall-and bifurcation-type intracranial aneurysms.J Neurosurg2012;116: 871– 81CrossRef Medline
13. Cebral JR, Castro MA, Burgess JE, et al.Characterization of cerebral aneurysms for assessing risk of rupture by using patient-specific computational hemodynamics models. AJNR Am J Neuroradiol
2005;26:2550 –59Medline
14. Patti J, Vin˜uela F, and Chien AC.Distinct trends of pulsatility found at the necks of ruptured and unruptured aneurysms.J Neurointerv Surg2014;6:103– 07CrossRef Medline
15. Chien A, Castro MA, Tateshima S, et al.Quantitative hemodynamic analysis of brain aneurysms at different locations.AJNR Am J Neu-roradiol2009;30:1507–12CrossRef Medline
16. Cebral JR, Mut F, Weir J, et al.Quantitative characterization of the hemodynamic environment in ruptured and unruptured brain an-eurysms.AJNR Am J Neuroradiol2011;32:145–51CrossRef Medline 17. Ramachandran M, Retarekar R, Raghavan ML, et al.Assessment of image-derived risk factors for natural course of unruptured cere-bral aneurysms.J Neurosurg2016;124:288 –95CrossRef Medline 18. Chien A, Lau V, Yi Q, et al.Posterior communicating artery
aneu-rysms demonstrate faster interval growth than other growing an-eurysms.Neuroradiol J2017 Jan 1. [Epub ahead of print]CrossRef Medline
19. Ujiie H, Tachibana H, Hiramatsu O, et al.Effects of size and shape (aspect ratio) on the hemodynamics of saccular aneurysms: a pos-sible index for surgical treatment of intracranial aneurysms. Neu-rosurgery1999;45:119 –29; discussion 129 –30Medline
20. Tremmel M, Dhar S, Levy EI, et al.Influence of intracranial aneu-rysm-to-parent vessel size ratio on hemodynamics and implication for rupture: results from a virtual experimental study.Neurosurgery
2009;64:622–30; discussion 630 –21CrossRef Medline
21. Villablanca JP, Hooshi P, Martin N, et al.Three-dimensional helical computerized tomography angiography in the diagnosis, charac-terization, and management of middle cerebral artery aneurysms: comparison with conventional angiography and intraoperative findings.J Neurosurg2002;97:1322–32CrossRef Medline
22. Villablanca JP, Jahan R, Hooshi P, et al.Detection and characteriza-tion of very small cerebral aneurysms by using 2D and 3D helical CT angiography.AJNR Am J Neuroradiol2002;23:1187–98Medline 23. Dong B, Chien A, Mao Y, et al.Level set based surface capturing in 3D medical images.Med Image Comput Comput Assist Interv2008; 11:162– 69Medline
24. Lederman C, Vese L, Chien A.Registration for 3D morphological comparison of brain aneurysm growth.In: Bebis G, Boyle B, Parvin D, et al, eds.Advances in Visual Computing: 7th International Sympo-sium, ISVC 2011, Las Vegas, NV, USA, September 26 –28, 2011, Pro-ceedings. Part I. Berlin: Springer-Verlag; 2011:392–99
25. Chien A, Sayre J.Morphologic and hemodynamic risk factors in ruptured aneurysms imaged before and after rupture.AJNR Am J Neuroradiol2014;35:2130 –35CrossRef Medline