Rothamsted Repository Download
A - Papers appearing in refereed journals
Mattingly, G. E. G., Chater, M. and Poulton, P. R. 1974. The Woburn
Organic Manuring Experiment II. Soil Analyses, 1964-72, With Special
Reference to Changes in Carbon and Nitrogen. Report - Agricultural
Research Council and Ministry of Agriculture Rothamsted Experimental
Station. 1973 (2), pp. 134-151.
The publisher's version can be accessed at:
•
https://dx.doi.org/10.23637/ERADOC-1-8
•
http://www.era.rothamsted.ac.uk/eradoc/OCR/ResReport1973p2-136-153
The output can be accessed at:
https://repository.rothamsted.ac.uk/item/8wq8w
.
© Please contact [email protected] for copyright queries.
document has been scanned from original documents. If you find this document is not readible, or you suspect there are some problems, please let us know and we will correct that.
Rothamsted Experimental
Station Report for 1973 Part
2
Full Table of Content
The Woburn Organic Manuring Experiment II. Soil Analyses,
1964-72, With Special Reference to Changes in Carbon and
Nitrogen
G. E. G. Mattingly, Margaret Chater and P. R. Poulton
The Woburn Organic Manuring Experiment II. Soil Analyses, 1964-72, With Special Reference to Changes in Carbon and Nitrogen , G. E. G. Mattingly, Margaret Chater and P. R. Poulton (1974) Rothamsted Experimental
Station Report For 1973 Part 2, pp 134 - 151 - DOI: https://doi.org/10.23637/ERADOC-1-34636
The
Wobun
OrganicManuiry
Experimert
II.
Soit Analyses, 7964-7i2,with
SpecialReferene to Chuges
in
Carton
and NitrogenG.
E.G.
MATIINGLY,
MARGARET CIIATER and P.R.
POULTONThe experiment described in Part
I
(Mattingly, 1974) occupies most of Series B on Stack-yard Field, Woburn, which was croppedfrom
193G{0 in a six-course rotation of sugar beet, barley, clover, wheat, potatoes, rye (Yates&
Patterson, 1958; Rothamsted Experi-mental Station, 1970). Barley was grown over the whole areain
1961-63 and the land was fallowedin
1964.Soil samples (0-23 cm) were taken
from all
plotsat
the startof
the experinentin
Aprit
1964, and againin
autumn, 1968 and 1971 after the winter wheat and winter ryecrops respectively. Samples were also taken
to
53 cmin
April
1964 and when the firstphase
of
the experiment was completed after the leys had beea plonghed up. BlocksI
andIII
were sampled in spring 1972 and BlocksII
andIV
in
spring 1973,This paper describes changes in the composition of the surface soils, and the sub.soils
to 53 cm with spocial rcference to (i) changes in carbon and nitrogen contents, including mineralisable
N
and(ii)
effects of the different amounts and types of organic matter on the distribution, movement and possiblefxation,
of residues of P,K
andMg
fertilisers.Mechrnical
ualysis
and epparent decdty of soilsMechanicrl
analysis.
The soil is a sandy loam (Cottenham Series) derived from Lower Greensand.The
mean mechanical compositionis
about801
coarseand fine
sand(2000-20 pm),
5.51silt
QV2
pm)nd
l0l
clay(<2
pm). Appendix TableI
gives the mechanical analysis of soils from all main plots, which are parallel and run from SW toNE
and slopein
this direction. The proportions of coarse and fine sand decrease fromover
801on
plots at the SW end of the experimentto
751
or less at the NE end. The silt and clay contents show minima, 3,2 and 7.81
resptl
ely, in plot 8 near the junctionof
BlocksI
andII
and similar, though larger minimum values, 5.1 and5.31
and 9.9and 9.3 % respectively, in plots 24 and 25 at thejunction of Blocks
III
andry.
The largestsilt and clay contents
(7-8%
andl2-l3l)
werein
plots 3G-32 at theNE
corner of the experiment. Theinitial
C
andN
contentsof
the soilsfollow a
similar pattemto
thef
clay, with minimain
plot 8. The linear regression%c
:0.32(+
0.058)+
0.044(+ 0.005ef
clay a@ountsfor
66\
of the vaiance in carbon contents in the 32 plotsin
1964.Applrent
densityof soils.
Crowther (193Q givesthe
weights/acrefor
surface soils (0-9in.) from
Stackyard as 1370 tons air-dry soi[acre andl4X
tons air-dry soi|acrefor
sub-surface soils (9-18in.).
The air-dry soilsnow
contala 0,7-1,2%, rnoisture andthese weights, which correspond to apparent densities of
l.5l
and 1.56 g air-dry soit/cms, have been usedby
several other workers@olton
&
Penny, 1968; Chater&
Gasser, 1970) and are usedin
this paperfor all
soils othertlan
those ploughed outfrom
leys.Bulk
densitiesof
soils under leys were calculated fromtle
weightsof
soil removedto
THE YALUE OF
ORGANIC MANURES
AT
WOBURN.
II
mqrsure roots weighs of the leys before ploughing @art
I,
p.
103). The mean apparcnt density was 1.38 g air-dry soifcms, correspondingto
1300 tons/acre for surface soils.The following metric equivalents are used
to
calculate gains and lossesof
organic matter (Table 2) and nutrients (Table 4).Depth of samplilrg
(crD) o-22.9 0-15.2 15.2-22.9 22.9-10.5 )
30.5-38.1I
38.1-4s.?
I
4s.1-$.3
)
All
tr€atm€ots
L
and Lnexcept
leys
plots3.44
3.142.29
2.@I
.15
t .051.19
1.19
Soil analyses in 1961
Appendix Table 2 gives mean analyses
of
all
surface soils (G-23 cm) sampledin
1964,1968
and
1971.h
1964, before different organic matter treatments were applied, the soils (averaged over four blocks) containedlittle
organic C and values, measured by the Walkley (1947) method, using 1.3for
the correction factor, were 0-73-{.81%. Nitrogencontents were O'O824.@l % and the soils contained moderate amounts
of
NaHCOs-soluble P (2,1-30 g.g P/g) but little exchangeableK
(71-79 pg Klg) or M^g(1220peMgld.
The variations in C, N and total P contents within blocks are given in Appendix Table
l.
Organic C
ad
N.
The organic C andN
contents of soils from all sections of StackyardField have diminished steadily since 1876 when the soils were first analysed.
No
carbonor
nitrogen analyses are availablefor
Series B before 1964 but the mean C contentsof
soils from the adjacent SeriesA
and C decreasedfrom
l.5l
to
0.90/" andfrom l'32
to0.701
respectively b€tween 1876and
1959. The mean annual rateof
lossis
about0'007 % C, equivalent
to
0.42 tonnes/haof
soil organic matter, assuming a conversion factorof
1,724 g organic matter/g C.pH
and exchangeablecations
Unlike
other partsof
Stackyard, SeriesB
was limed regularly between l93G-60. The meanpH
values ranged onlyfrom
5.7H.m
in
0'0lM
CaClz. The pH, measured
in
water, was related to values in 0.01M CaClz by pH (warcr):
0.52(+0.183)1
0.96({0.032) pH(CaClz)Exchongeable
K.
The mean valuein
1964 was 75 pgK/9,
which is less than Williams(1973) calculated would be present (108 pg K/g)
in
soils from Stackyard Field when the amounts ofK
removed by crops were balanccd by the amounts appliedin
K
fertilisers. The crops fromtie
six-course rotation (1930-60), which preceded the Wobum Organic Manuring experiment, were not analysed. The evidence here suggests that they removedmore than
the
average amountsof
K
(52 kg/ha) appliedto
them each year so thatexchangeable
K
values on S€ction B on Stackyard Field were lessin
1964 thanin
1930.Exchangeable
Mg.
The mean value (15 pg Mg/g) is typical of other Stackyard soilsin
the 1960s (Bolton
&
Penny, 1968; Williams, 1973) and much smaller thanin
the 1930s(Crowther, 1936). Magnesium deficiency slmptoms and yield responses to Mg fertilisers occur at these soil Mg levels (Bolton
&
Penny, 1968).ROTHAMSTED
REPORTFOR
1973,PART
2Soluble
P
in
themils.
In
coDtrastto
exchangeableK
and
Mg
the
soils contained moderate amounts of NaHCOa-soluble P. The mean value (28 pg P/g) exceeds the valuefor Stackyard (22 pg Pig) quoted by Williams (1973) and which he caiculated in
tie
sameway as for potassium. The amounts of P added
in
the six-course rotation (16.5 kg p/haeash year) were, therefore, more on average than the crops removed.
Water-soluble
B
in tte soils.
The
soils werenot
analysedfor
water-solubleB
until
symptoms of heart-rot were detected in sugar beet grown
in
I 969 (Ro thamsted Reportfot
1970,Part
I,
pp. 5G57). The values (0.4-O.6 pg B/g) are ryithin the range where sensitive crops may show visual symptoms of boron deficiency.Chrnges in soil andyses,
DA-71
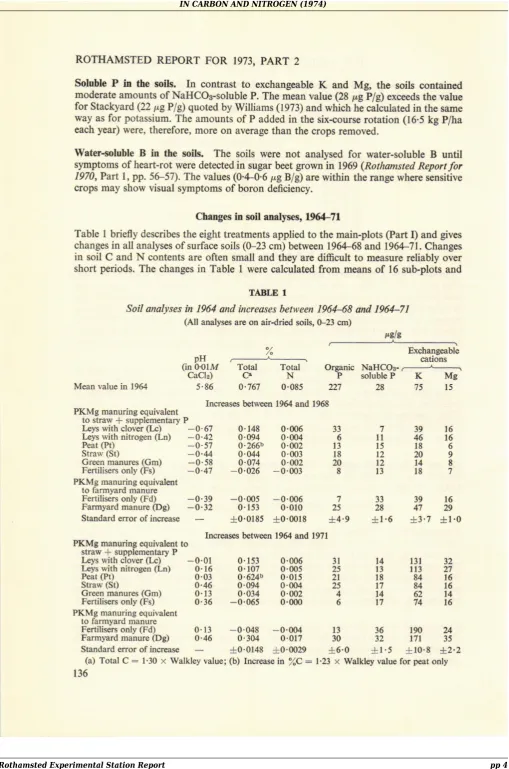
Table
I
briefly describes the eight treatments applied to the main-plots (Part D and gives changes in all aaalyses of surface soils (0-23 cm) between 1964-68 andl9U-71.
ChaaBesin
soil C andN
contents are often small and they are difficult to rneasure reliably over short periods. The changesin
TableI
were calculated from meansof
16 sub.plots andMean value in 1964
TABLE 1
Soil analyses in 1964 and increases between 196448
oul
196,{-71(All analyses are or airdried soils, 0-23 cm)
o/
pH
Gno.olM
Total Totsl
OrgsnicCaCl,
Cr
N
P5.86 0.767 0.085
227Iocrras6 betc/Eca 1964 ard 1968
ErchadgEable
@tioos
NaHCOs-.----i-soluble
P
K
Ms28
75
t5PKMg manuring equivalent
to straw
+
supplementary PlJys with clover
(Lc)
-0.67I-€ys wilh nitrosen
(Ln)
-O.42Itat
(Pt) Straw (St)0.lil8 0.006 3t
7
39
,60-094
o.fix
6
ll
6
160.266b
0.002 13
15
t8
60.044
0.m3 fi
t2
m
9o-g74
o.o2
m
l2
M
t
-0.06 -0.m3
8
13
l8
7-0-005
-0.006
7
x3
39
160.t53 0.010 25
x
4
D
+0.0t85
+o-ml8 +4.9 +1.6
+3.7
+t.0
-0.57 -0.44
Green matrures
(Gm)
-0.58Fertilisers only
(Fs)
-0.41PI(Mg manuring equivalcnt
to famyard manurc
Fertilis€rs only
(Fd)
-0.39
FarmFrd manue
(Dg)
-0.32
Staadard error of incleas€
Iocrease betw€en 1964 and 1971 PKMg maoudrg equivaleDt to
stBw + supple-seotary P
tays with clover
(Lc)
-0.01
0.153
0.006Irys with nitrogeo
(Ln) 0.16 0.107
0-005Peat
(Pt)
0.03
O'62y'.b 0'015Straw
(St)
0.46 0.0&l
0.m4Greer manures
(Gm)
0.13 0.034
0.m2Fe.tiliscrs only
(Fs)
0,36 -0.065
0.000PKMg manuring equivalent
to famyard manu.e
Fertilis.rs only
(Fd)
0.t3
-0.048
-o.UN
Fam)rald maoule
(Dg) 0.46 0.304
0.017t3l
323n
84
1684
1662
l414
163t
1425
t321
1825
t7414
617
13
36
190
U
30
32
t1t
35StaDdard €rto. of
increas€
+0.01,18+0.0029
+6'0 +1.5
+10.8
+2.2(a) Total C
:
1'30x
Walkley value; (b) Ircrease id %C:
1,23x
Walkley value for pcat onlyTIIE
YAIUE
OF ORGAMC
MANURES
AT
WOBURN.
II
the standard errorc tvere derived from analyses of variance of these differences and not from the errors of the separate soil analyses given
in
Appendix Table 2.Changes in C rtrd N contetrts of
soils.
The carbon contentsofthe
soils increasedsigni-ficantly between 1964-{8
in all
treatments which included organic manures(p"ut
@),
straw (SQ and farmyard manure (Dg)) green mamres (Gm) or leys
with
cloverflr)
or
leys._giyetr _'Nitro-Chalk'
(Ln).
Carbon contents decreased slightiyin
soils given onlyfertilisers (Fs and
Fd).
Betwem 1968-71 organicC
further increased wherJfarmyardmanure, _peat
or
straw were applied cumulatively,but not
where leys were grown. Carbon decreased slightly in soils where only one green manure crop (in l-97t) was [rown.The mean loss
ofsoil
carbon from plots given only fertilisers was-d.OSO 1-O.Ott-t
7
C, correspondingto
an annual rate of loss of0.N8\
C. This value is very similarto
the average loss between 1876and
1959from
arable soilsin
experimentson
other parts(Series
A
and C) of Stackyard Field.. The changes
in
I
total Cin
surface soils from all main-plots between 1964_71 weresimila_r.
in
all _four blocks, despite the variationsin
the mechanical compositionof
the soils (Appendix Tablel).
Covariance analyses confirmedthat
the changesin
carbon contents_were unrelated
(-0.0033
+
0.00624)to
%
clay and adjusting the changesin
lC
to
allowfor
variationsin
clay contents slightly increased the residual varian-ceof
the mcas.re,ments.
Within
this experiment,ther;foie,
variationsin
clay contents from 7 .8-13.1 % did not afect either the loss or accumulation of soil carbon in seven years.Changes in the
N
content oftie
soils closely followed changesin
soil carbon 6ut they were more difficult to measure reliably because they were very small; only the increasesoll
plotsgowing
leys or given farmyard manure were significant betwe€n19ffig.
At
the end
of
l97l
theN
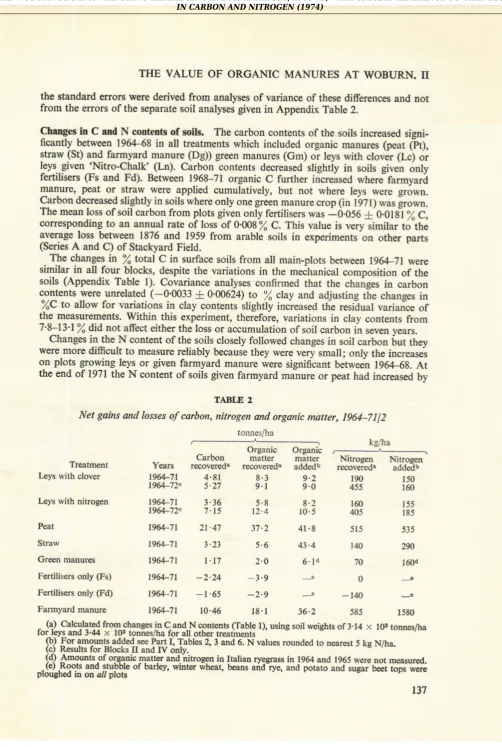
content of soils given farmyard manure or peat had increased byTABLE 2
Net gains and losses of carbon, nitroget, o1d otga ic matter, 196+7112
Treatrrcnt
Lcys with clover
I-eys with oi&ogen
Itat
Straw
Grcen manurcs
Fcrtitisers only (Fs)
FertiliseB ody (Fd)
Farmyard maoure
Carbon
Years
rccovercd.t9a-71
4.8tBA-72c
5.271964-7t r.x
19&-72.
7.15t 4-7t
21.47l9&-:
3.23t9g-71
l.t7
t9a-71 -2.a
1964-71
-
1.651964-1t
10.46 18. t 36.2Orgadc matter rccovercd. 8.3 9.1 5.8 t2-4 matter addedb 9.2 9.0 8-2 10.5 NitrogEo
rovlned.
l90 455 I@ ,()5 5t5l&
70 o-l4o
585 NirogeD add€db I50 160 155 185 535 2X l60d t5m torlnes/ha kp/haOreaaic
,-=ji-=-37.2
4r.85.5
43.42.O
6.td3.9
-2.9
(a) Calculated from chenses in a ,nd N contenis
Cfabb 1), usitrg soil weights of 3.14
x
IoE tootrG/hafor leys atrd 3.,14
x
tos too;es/ha for all other reatinents"
-(b) For amoults added see Part I, Tabbs e 3 aDd 6. N values rouoded to oearest 5 kg N/la-(c) R6ults for Blocks II and
w
6ntv-(d) Amoutrts -of organic matt"' aod lit'ogeo in Italian ryegrass ia 1964 aod 1965 were not measurcd.
(c) Roots and stubblc of barley, wioter wheat, b€ans a;a'rye, ind potat.-.,ia
Lie;di i;;'ffi
plough.d
h
o! arlplots
ROTIIAMSTED
REPORTFOR
1973,PART
20.017
and
0.015+0,N29%
respectively.The
C :N
ratio
of
all
soils given organic manures, green manures or growing leys increased between 196,1-71 but decreased from 8'9to
8.1-8.5on
soilswithout
organic manures (Appendix Table2).
Proportionallymore C than
N
was also lost from land fallowed between arable crops on the adjacentgreen manuring site (Series A) betlveen
193ffi6
(Chater&
Gasser, 1970), and the C :N
ratio
decreasedfrom
9.5to
9'1. The evidence here (Tablel)
suggeststhat
the plantresidues (roots and stubble
of
barley, winter wheat and winter rye and potato haulms and sugar beet tops) which were ploughedin
b€tween 196G71 did not provide enough organic matter to balancc losses.Table
2
shows net gains and lossesof
C,N
and organic matter&lvef-n
1964-7112in
relationto
the amounts addedin
organic manures. The amountsof
soil carbon and nitrogen measured by analysisin
1971 agree wellwith
the amounts presentin
the leyswhich were estimated
from the
weights (PartI,
Table6) ploug}ed
dowt
in
191112.Soil analyses made
on two
blocks(II
andIV)
in
1972 appearedto
overestimate the amountsof
nitrogen (but not carbon) which accumulated under the leys. Muchof
the differencr (220 kg N/ha) betweenN
recovered by analysis ('105 kg N/ha) and the 185 kgN/ha in the tops and roots of the ley given
'Ntro-Chalk'
(Ln) can be explained.'Nitro-Chalk' ( I 26 kg N/ha) was given on 8 March for the first cut of grass and again on 26 June
for
a second cut, which was not taken because there waslittle
rainin
July-Septcmber.Much of the fertiliser nitrogen applied appeared to remain in the surface soil (G-23 cm).
It
is more difficult, however, to account for the diference (295 kg N/ha) between the Nin
soils under the clover ley (455 kg N/ha) and the amounts measured
in
the roots of the clover and grass (160 kg N/ha).In
1972, much mineral N may have accumulated under the clover ley during a long dry summer but was lost when the roots were washed before analysis. These discrepancies, which may also be due to sampling and analltical errors,emphasise the difficulties of measuring unambiguously the amounts of N that accumulate
in
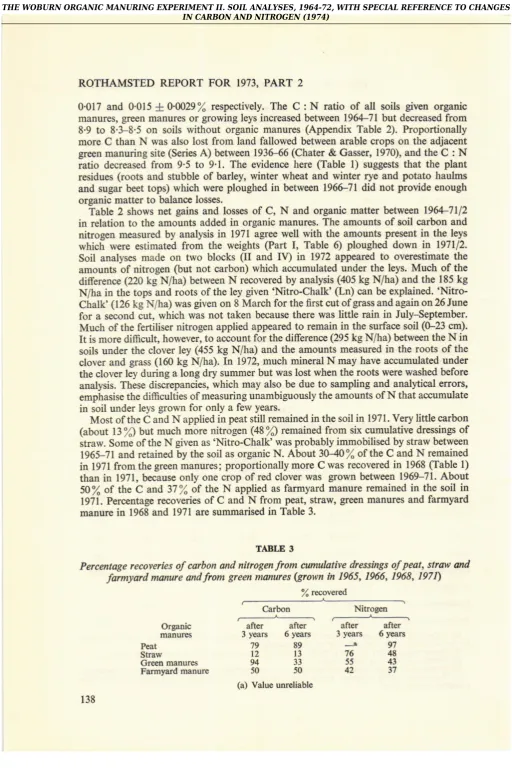
soil under leys grown for only a few years.Most ofthe C and N applied in p€at still remained in the soil
in
1971. Very little carbon (aboutt37J
but much more nitrogen (zEl)
remained from six cumulative dressingsof
straw. Some of the N given as 'Nitro-Chalk' was probably immobilised by straw between 1965-71 and retained by the soil as organic N. About 3G{0
f
ofthe
C andN
remainedin
1971 from the green manures; proportionally more C was recoveredin
1968(Iable
1)than
in
1971, because only one crop of red cloverwas
grown between 1969-71' About50%
of
theC
arLd371of
theN
applied as farmyard manure remainedin
the soilin
197i. Percentage recoveries of C and
N
from peat, straw, green manures and farmyard manurein
1968 and 1971 are summarised in Table 3.TABLE 3
Percentdge recoveries of carbon and nilrogm
from
ctanulative dressings ol peat, strcw @dfarmyard marune atd
from
green rnanures (gtownin
1965, 1966, 1968, 1971)Carbon Nitrogen
OrSaoic
manrll6
Pcat
Slras
Gree! maDures
Farmyard manure
after
alter3
yeals
6 yeals79
89l2
1194
3350
50(.)
value ureliablcafter
after3
years
6 years 9776
,1855
4342
37I
r*oteredTHE
Y
-
E o l.\[-.
qrr*
i6\Lo9.E I
,Eel$au,
grJ"
rrui
.!-
l.E
""$9
*
lI
eae*
[
^-^o
li I .\ NiFO
v^l
q'
E€i
$
r_l$;;i:
O\/
\l
a
o
"B
l"'g=89
-
s=.i
n:ogl.Er:qrr
*
E
-
[]*aai
E!
r
-^--'
I'H
'l*==o"
s B t
E{
E
:
E
'I$;;;?
S
E
[.."*uv
t I -
1"'=="-i
€ *l$;;rs
\
t-b;
^ I ohFo\
!' ilx*;;o
t
EIe---o
n<
o
lE
*x=o
[ *-o.,,
a
lx;F;:.
-t
.t l-e
,==o,
"
[]
=n:*
ALUE
ORGANIC MANURES
AT
WOBURN.a9
FFoo
:Y
n&
8
E6
.F
4
?
99196,0
gg F::=.-
gg
B
---
-
g
@rf !1666 F\o H6\6\6iN C.l F
^
irra{alc{-: st al a{N G
-al o
Fo-(iF6 oo
\oo
^---o-
c{iFi<
-o
Fo
EE
r.:1YT9
"
-t
itf<a.lE0a o\o @ooo\o- € a{ k (iNalalFi 6 al FN F cl ",;
.i|
t
E
g:rF-^
€g
n:=:=-
ae;
i-t-+oror
,o
6No\o€.{F
vr-
a;;+;+ +o
B r+rl\otF (- ttFFF 6o a
6e
5 @o\:-o\h 6 H
.r@o..,6\o
ooo
5
&r.cinn+;o
?
"Et
Ie
..ar.'F{c{
eg !
=a=:-*
gS
il
{
--o.-- .
E_tlro\..r6.oo
no
Eooirario
oro A-ERh6to.ac{ 6A E {---
go' H;
laE
e
E'i
Rh@o\\o..'
gg
.:
-r..--o.,
33
7
E- r
--Eg
s'lggr:: r
iE
<\o-N..lO.lN 2..ri-r|Foh 6o v6 @-rc)€66
== rF-F o\o = O. <\o-N..lO.lN 2..ri-r|Foh 6o v6
^ex3
:€
eFFo-l
E8
RRK..r
ss
!$
exF*-
I
Eg
RRK..T
$8
EE
--_-.- -- €;
N6..rF..r.er k, !t -<itilooJ' aa
P-sFl-- e8 r-.l.r
I
:g
gE
8a
.98 6.n.r\F6N 60 a*s-a- -- 5E NHq FO i6.l ..r 6 O,
9.8
: c-NO\h-F..r O= -it U
;^a;;;
8 EH-
T'I"?TTT
:'
ohN666 oQ -.166t FF
o..,--._ -
*.E$5gex=
p5
+nr;--
3e E$
'83
.
9..
-ee
og
.E B9E
TE
g:
a{o\h-F6 o= a{o\hFtr- it= !6
;&o;;; BE ;nA;;;
8d9S
'Jd"\JJ
EE
rJJ;JJ
??
.ax
oncro&n
Fc{..r..r!F.E
FFoncro,ir-
-6 -6sE
-N6.4{ FF iti
ROTHAMSTED
REPORTFOR
1973,PART
2Changes in orgonic P
co
entsofsoils.
OrganicPin
soils increased significantly between196,168 where organic or green manures were applied or a clover ley was grown
(fable
l).
Between 1968-71 organic P increased slightly in soils given peat, straw or farmyard manure but much more under the ley given 'Nitro-Chalk'. The plots growing green manures lost organic P between 1968-71 (a result parallel to changes
in
organic C) because only onegreen manure crop (red clover) was grown. Organic P contents did not change siCnfficantly between 1964-71
in
plots without organic manures (Fs and Fd) despite net gains of 220and 550 kg P/ha respectively
from
superphosphate. Other evidence (Oniani, Chater&
Matringly, 1973) shows that much more superphosphate (up
to
3000 kg P/ha), applied over many years,did not
alter the organic P contentsof
arable soilsat
Rothamsted. The increases in organic P, as percentages ofthe net gains in P applied during seven yeani,were 43'%
(l*),
351
@n), 33% (Pt),N%
(St) andl9l
@9.
The increase in organic Pin
soils given peat, which was apparently inert, is surprisingly large and may be mis-leading, because theigxition
methodof
analysis app€arsto
overestimate organic Pin
soils containing much carbon (Oniani, Chater
& Mattingly,
1973).Charges
in pH
and exchargeablecrtiorc.
Some exchangeableK
andMg
(and somesoluble P) moved below the plougtr layer and analyses
of
surface soils (TableI
and Appendix Table 2) donot
show the changesin
the nutrient status of tlle soils between1964-71 adequately. Most of these changes are discussed in relation
to
soils sampledto
53 cm
(fable
4 and Figsl-3).
The mean pH of the soils decreased between 196468 by about 0.5 units. The site was
limed
with
ground limestone (4'8 tonnes/ha)in
February 1969, before the sugar beet crop, and the pHin
l97l
was, on average, 0.2 units higher thanin
1964.Exchangeable
K
in
the
surfac€ soils increasedin all
treatments between 1964-68(fable
l), tle
increases being more on plots growing leys than on the correspondiDgplots under arable crops, although balancing
K
dressings were given (PartI)
to
com-lrnsate for differential renovals. The larger amounts
ofK
given as farmyard manureor
equivalent fertilisers @d) increased the exchangeable
K
in the surface soils only slightlymore (by 20-30 i,g K/g) than the smaller (Fs) dressings. Much
ofthe exra
K
must have leached below 23 cm during this period or been 'fixed'. ExchangeableK
in
the surface soil increased more between 1968-71 than between 1964-68, partly because moreK
was applied @artI,
Appendix Tablel).
Changes in exchangeable Mg followed a similar pattem to those
for
exchangeableK,
more accumulating in surface soils under leys than under arable cropping and more where
farmyard manure
or
equivalent fertilisers were applied.By
1971 exchangeableK
andMg in
the surface soils rangedfrom
14l-267pg
K/g
and 30-49 pgMg/g
(Appendix Table 2). The valuesfor
Mg are adequate for most crops on this soil @olton&
Penny, 1968). ExchangeableK
in
surface soils, from plots given only the smaller amountsof
fertiliser, may be insufficient
for
maximum yieldsof
some crops (e.9. potatoes, sugar beet)gown in
the testing phaseof
the experiment(1972-7,
unless large amountsof
potassium fertilisers are used.Figs
I
and2
show the vertical distributionof
exchangeableK
andMg
in
tie
soils before the experiment startedin
spring 1964 atrd before potatoes, thefirst
test crop, were plantedin
spring 1972 and 1973. Potassium fertiliser (200 kgI(ha)
was broadcastin
theautunl:s
of l97l
and
1972 before ploughing. The distributionin
the followingsprings, shown
in
these Figures, is therefore the resultof
the movement and 'fixation'of K,
applied between 1964 andl97ll2,
togetherwith
the effectsof
ploughing down a large single dressing of potassium fertiliserin
197213. ^Iable 4 g)ves ttre distribution andIrrcentage recovery
of
the residuesof
P,K
and Mg applied as fertilisers, and gained by the soils, between DA-7213.THE VALUE OF
ORGANIC MANURXS
AT
WOBURN.
II
Betvteen 65-:70% of the total
K
gained by plots given peat, straw, green manuresor
fertilisers only (Fs) was recovered as exchangeable
K
in
the top 53 cm of soil so about 250-300 kg K/ha was lost by 'fixation' or leaching. There are no obvious diflerencesin
the distribution of exchangeable K in the presence and absence of organic matter (Fig.l).
About
the same proportion(fi-&%\
of
K
gainedfrom
farmyard manure,or
from300
0t
t
[;
LJ
li
lirl
li
Li
oT-,OL
,.L
..1
..1
,.L
o-,OL
.L
€
.,1---l
.! iol
el
E
sol
3
-
of--c
rol'-3
zol-*L
I
roL
*L
ol-:o l-I
,ol
,NL
..1
uoL
i\
l\
l\.
i\
i)
1/
"---'
l,
i./
i\
t\
i
--'
!/
o
100
200
300 0
100
2oo
300ExchonEeoblc K (FgK/9
soil)'
Fro.
l.
DirbibutioD of crchaog€ablc K io soils saEpled to 53 cu iD 1954(a-a-a)
ad
i!
197213a-a-a).
t4t
26
300St
ROTHAMSTED
REPORTFOR
1973,PART
2equivalent amounts of fertiliser (Fd), Tas present as exchangeable K. About g00 kg
I(ha
were not recovered and the distribution
in
Fig.I
suggests that some had leached beiow 53 cm.All
theK
gained by the all-grass ley(Lt)
ardTB:z
of that gained by the clover ley(k)
was recovered as exchangeableK.
Magnesium gained by plots given peat, stmw, green manures or fertilisers (Fs) between
0
r0 20 30 40 50
0
.t0 20 30 1.0
50r--'r.-r---.--I.---r---.rr--r---I---]-.----T---l
010
20 30 40 50 0l0
20 30 10
50Exchongcobl. Mg (FEM9/g soil)
- -Flc.
2
Distributios of cxchaogeablc Mg in soilseh
.d to 53 cei!
1964(a-O-a)
aDd itr tyDl3(a-a-a).
r42
.l-,or
,ol
,L
..f
toL
'f-10r
,o
1--t
S
rof
!
..1-ol
E
s0L3 or
bl
.
lol-3
,ol-,l_
I
'or
50L
oT-,"L
,.L
,"L
."1
,OL
tl
)/
i/
i\
j!
it
ll
i
,'!
!./
LI
Ii
,\l
?/
sr
at
'lt
i/
I1
t/
l1
rl
il
lt
ii
t/
THE VALUE OF ORGAMC
MANURES
AT
WOBURN.
II
1964-72 rema;irred mostly
within
thetop
53 cmof
soil and its vertical distribution wasindependent of the amounts of organic matter which accumulated
in
the soils. IJssMg
(73-80 %) gained from farmyard manure, or from equivalent fertilisers (Fd) was recovered
(Iable
4) and slightly more remainedin
the top 30 cm of soils given farmyard manurethan
in
soils given fertilisers.In
contrastto
the resultswith
soils from the arable cropo20
405080
0
20 10 60
80o
'10
20
!eo
ur
<40
=
E50
o
oO
o
.lo
e
320
30 40
50
'I
,of i \
lr\
,of i ,/
""1 i
../
-"1
,"1
i!
soL
l,l
f-l- i\
t-i)
l-
.l-/
t{
L.T
I
il
st
t-rr\
t,\
L,i\.
li,/
L'.-/
L !/
LJI
PttI
ti\ ti\
lu/ lr-/
LT
L
TLii
Gm
ln
Fso20406080o20/o6oao
l,lo HCO! -solu ble P (pSP/g soil)
F'tc.3. Dirtributiotr
of
0.5M sodium bicarbonaGsolubleP
itr soils sasplcd to 53 qn itr 1964(a-a-O)
8od in 1Y1213(a-a-a).
143
or-I
t0F
li
20l-
?tl
sol-"oL
I it
i/
ro
L
i,i
ROTHAMSTED
REPORTFOR
1973,PART
2sequenc€,
2A-301
moreMg
was recovered as exchangeableMg
under leysthan
wasgained from fertilisers applied between l96zt-71 (Table +). This discrepancy could arise (i)
from
experimentalerors, (ii)
from the release of non-exchangeable Mg irom the soil,(iii) from underestimating the amounts of Mg removed in cut grasi or (iv) fr-om Mg preseni
in
rain. Bolton and Penny (1968) foundlittle
non-exchangeibleMg
was releaied from Woburn soil during exhaustive croppingwith
ryegrassin
the glasihouse thoughit
is possible, but not proven, that some could be released underleyigrown
fo,
,"u"i
yeao.These results can be explained
if
some Mg, and probablyK,
leached from grasslift
on the plots to dry, after the samples had been cut and removed. They can be more reason-ably explained, however, by the amounts of Mg fallingin
rain. Williams (1973) showed the annual amount of Mg in the rainfall at Woburn between 1960-69 was 2.5 kg Mg/ha.Between spring 1964 and spring 197213, the soils would, therefo re, gain
n-22.5
kgMilha,
which accounts almost completely for the extra 20-30 kg Mg/ha
in
soils under ieys. Thedistribution
of
exchangeableMg
in
arable soils (Pt, St, Gm and Fs), shownin
Fig. 2,suggests, moreover, that some Mg (approximately 20 kg Mg/ha) has leached below 53 cm.
The amounts and distribution
of
exchangeableK
andMg
in
the soils were slightlydiferent
after leys than after arable cropping, despite the balancing dressings @artI)
which ensuredthat
the same net amountsof
K
andMg
were appliedto
both
cropsequences belween 19@-72. Further work is
in
progress on these soilsto
estimate the amounts ofK
and Mg that have been 'fixed'in
non-exchangeable forms.Changes
in
0.5114 NaHCOs-sottbleP.
Fig.
3
showsthe
distribution
of
NaHCOs-soluble Pin
soilsin
1964 andin
1972/3. Superphosphate (100 kg p/ha) was broadcast on the leys and rye stubble in tl.re autumnsof
l97l
and 1972 before ptoughing to provide adequate P for potatoes, ttre fust of the sequenc€ of test crops. Because soil samples were taken in the following spring, muchofthis
P was found in the lower part (15-29 cm)of
the plough layer. Very little P appears to have moved below 30 cm in soils where 220 kg
P/ha accumulated betweetr
l9g-71
but
detectable amounts moved below 30cm
onplots given farmyard manure
or
equivalent fertilisers(Fd)
which gained 550kg
p/ha during the same period. There was no significant diference after seven years between the moyement of P applied as superphosphate or as farmyard manure(fable
4).Recent calculations (Holford, Wedderburn
&
Mattingly, 1974) show that surface soilsat Woburn hold about I 14 pg P/g on high-energy surfaces and about 80 pg p/g much less
strongly. The top 30cm of Woburn soil should, tberefore, retain about 520 kg piha before
detectable amounts leach below this depth and the evidence in Table 4 and Fig. 3 supports this prediction.
-
The percentages of total P applied which remained solublein
0.5M NaHCO3 rangedfrom
2A.4-36.4\ (Iable
4). They were smallestfor
soils under leys (Lc and Ln) and onplots given straw, and largest (34.0 and,
36.41)
on plots given fertilisers only (Fs)or
peat (Pt). The smaller recoveries under leys are consistent with the evidence thai 30-40
f
of
tlteP
appliedto
them accumulated as organic P. The large recoveryof NaHCOi
soluble
P on
plots given peat throws further doubton
the apparent accumulationof
organic P in these soils. The proportions of P which remained NiHCO3-soluble in plotsgrvcn
only
fertilisers were larger than those measured (abont 251'1on
Saxmundham soils given much P (250-500kg
P/ha)for
three years (Maningly, Johnston&
Chater1970), probably because 100 kg P/ha (about one-third of the total applied
to
Fs plots)was ploughed down only four to five months before sampling. Mineralisable nitrogen in the mils
Surface soil samples, taken
in
autumn 1968 and 1971, were usedin
incubation tests toTHE VALUE OF
ORGANIC MANURES
AT
WOBURN.
tr
incubation
in
1971 but notin
1968. Soils were incubated for three or eight weeks withoutor
with
CaCOs(0'21),
which brought the soils abovepH
7.(fhis
amountof
CaCOsis approximately equivalent
to
a field dressing of 7 tonnes/ha.) Appendix Table 3 givesthe NOg-N and inorganic
N
contentsofthe
soils and Table 5 the increases in mineralis-ableN,
calculated as kg N/ha.TIBLE 5
InoeasesL
in
total soilN
od
mineralisable-Nfrom
residuesof
leys, peat, slraw, gteen ntutures andf*myard
mqnurein
1968 and 1971Increases (kg N/,ha) ia
Mineralisable N
Unlimed
Mear" as
'/"iacIfar€ in total
soil N
Total
soil ND 3 weeks 8 weeks 3 weeks 8
weeks
MeaDTr€atmetrt
YearIrys ivith
ctover
{ltrf
Irys with
nitrog.r,
{i|ri
P€at
{itri
stras
{ltri
crEra
ma,uEs
{itri
Farmyardmaou''
{i|fl
22 IO
l7
2
t
3l
6
9
l$
36
4
4l
,r8
4l
190 49
,18 X
38
4l125
I
t7
18
l7
13l@m33m3421
51523
5I53103t58
t&374452444,4.
70
13
3023n
2334s t2
22
29
25
2:2585 37
6t
45
10
53(a) Relative to plots giveo oDly f€rtilis.Es
(b) From Tabl€s I 8nd 2
(c) Itrc.€ases
lot
rcliablsMean increases in mineralisable N (Table 5) were
2l
and 30 kg N/ha on unlimed soils, after three and eight weeks respectively and 26 and 32 kg N/ha on the limed soils. Theaverages
of all
four
values, expressed asa
percentageof
the
increasein
total
N
in
soils, ranged from 2
to
33:z$able
5). Nitrogen residues from peat were inert. Aboutone-third of the residues, accumulated between 1965-71 from straw and green manures, mineralised readily. The absolute amounts of nitrogen that mineralised from residues
of
farmyard manure were 22
kg
N/hain
1968 samples and 53 kgN/ha
in
1971 samples,about 6 and 9
I
respectively of the totalN
accumulated in the soils. More N mineralisedin
both years after the clover ley than after the ley given'Nitro-Chalk',
even though muchN
(126 kg N/ha per cut) was givento
the N-treated leyin
1970-71to
avoid therisk
of
ploughingin
an N-deficient sward. About twice as muchN
mineralisedin
1971as
in
1968from
soils underthe
ley
given'Nilro-Chalf.
These results indicate the extra amounts of nitrogen which are potentially available in these soils after six to sevenyears under regimes which conserve or increase soil organic matter. They also confirm
that
nitrogen added as peat (over 500kg N/ha) is
largelyinert,
whereas aboutl0%
of the residues from farmyard manure (585 kg N/ha) mineralises readily.Conclosions and summary
l.
This paper describes changes in the C, N and organic P in surface soils (0-23 cm) andin
NaHCOa-soluble P and exchangeable cationsin
soils, sampledto
53 cm,from
an experiment on Stackyard Field, Woburn. The soils were croppedfrom
l96Hl,
(a)with-out
organic manures,at
two
levelsof
PKMg
manuring, @)with
additionsof
peat,ROTHAMSTED
REPORTFOR
1973,PART
2straw, green manures
or
farmyard manure,ot
(c) maintained under a grass-+lover ley(without fertiliser
N)
or a grass ley given 'Nitro-Chalk'.2.
The amountsof
organic matterthat
accumulated under the leys rangedfrom
8-l0
tonnes/ha and contained 160-180 kg N/ha.About
9O"/"of
the organic matter addedas peat, and all the
N,
remainedin
the soilin
l97l
; less than2\
of
theN
mineralised in incubation tests. About 13 % of the organic matter added as straw, but nearly one-halfof the
N,
was recoveredin
the soilin
1971. Between3H0y.
of
ihe organic matter andN
from four
green manurc crops remainedin
the soil.About
30f
of
theN
residuesfrom straw and grcen manures mineralised rapidly on incubation. One-half of the organic matter and over one-third of the
N
from farmyard manure remainedin
the soilin
1971.Mineralisable
N
in
soils containing residuesof FYM
morethan
doubled between 1968-71 and exceeded 50 kg N/ha.3.
OrganicP
accumulatedin
soils under leys andin
soils given strawor
FYM.
Its
apparent increase
in
soils given peat, wh.ich was otherwiseinert,
may be an artefactof the ignition method of analysis. Organic P did not change significantly
in
seven yearsin
soils growing green manures or given only fertilisers.4.
ExchangeableK
in
surface soils increasedfrom
75to
152pgKlg
on
arable soils andto
196 g.g K/g under leys on plots which gained 680 kg K/ha, and to 256p.gKlgon
plots which gained 2000 kg K/ha either from
FYM
orK
fertiliser given between 1964-71. Only60-701of
theK
gainedin
the arable crop sequence vas present as exchangeableK
(to 53 cm); 250 and 800 kgI(ha
had been'fixed' or had leached below this depth fromthe small and large dressings respectively. More
K (8G.100f ofthe
net gain by the soils) remaitred in the top 53 cm of soils under leys.5.
ExchangeableMg
in
surface soils increasedfrom
15to
32 pgMglg
on arable soilsand to 46 pgMglgunder leys on plots which gained 90 kg Mg/ha and
to,l{)-50
peMele
on plots which gained 260 kg Mg/ha eitherfrom
FYM
or fromMg
fertilisers.All
Mg
accumulated
from
the smaller dressingsin
the arable crop sequenc€ was recovered asexchangeable
Mg (to
53 cm).About
5G-70kg
Mg/ha from
the larger dressings had leached below 53 cm or was '6xed' by the soil. More Mg (20-30 kg Mg/ha) was present as exchangeableMg
under leys, mostlyin
thetop
30 cmof
soil, than was gained bymanuring. The amounts
of
Mg
addedn
ruia
(20-22kg
Mg/ha)
betwen
1964-:7213account
for
the extra Mgin
soils under leysard
show that about 20 kg Mg/ha leachedbelow 53 cm in arable soils.
6. NaHCOs-soluble P
in
surface soils increasedfrom
28to 43
pgPlg
on plots whichgained 220 kg P/ha ard to 65 y.gPlg on plots which gained 550 kg P/ha between 19&-:71.
Little P moved b€low 30 cm when the smaller amount was applied but soil below 30 cm
was slightly enriched with soluble P from the larger dressings.
7.
Organic matter, accumulated in soils between 1965-71 had little effect on the amountsor vertical distribution of exchangeable
K
or
Mg, or 0.5M NaHCOrsoluble P,in
soils sampled to a depth of 53 cm. More exchangeableK
and Mg, and slightly less NaHCOs-solubleP,
accumulatedin
thetop
30 cm under leys thanin
soilsin
the
arable cropsequence.
In
the second phase of this experiment (1972-76) the effectsof
different t,?es and amounts of organic matter accumulatedfrom
1965-71will,
therefore, be evaluatedon
soilsin
which both the amounts and distributionof
P,K
andMg
are similar but not identical.Ac&rowl€dgenents
We
thank R.
W.
M.
Wedderburn andJ.
Boltonfor
helpful comments,V.
Cosimini, Brenda Messer, R. J. Avery and the late R. A. G. Rawson for some of the chem.ical analysesand other members of
tle
Chemistry Department for help with soil sampling.RrFm.ENcEs
BoLroN, J. & PB{NY, A. (1968) Thc effecls of potassium and Eagnesium fertilisers on yield aad com-poeitioo of successive crops of ryegrass, clover, sugar b€et, potatoes. kale aDd barley oD sa[dy soil
it wobun
Jounal of Agticulrural Science, Cambridge 10, 303-311.Br.Er,$rR. J. M. & JELx${so{ D. S. (1960) Detemination of organic carbon io soils. I. Oxidation
by dichomate of orgadc matter in soil atrd plant malerials. tounal of Soil Science ll,394-4,.2.
Bnnorn, J. M. & KEEN;, D. R.
(l%5)
steam aisdllalion methods for determination of amtnodum,nitrate and nit
ite.
Aralytica chimica Acla 32,$5495.
CH^TER. M- & G^ssER- J- K. R (1970) Efects of geeo manuriDs; farmyard matrule, atrd st aw on the or8aDic maner of soil and of g€eo Datruring on available aitogen. Jounul of Soil Sciencc 21,
127-137.
CRowrHE E. M. (1936)
hi
FiIty Years oI FteA Experinentt at ,he Wobum Exryrinerual Statiotr.Ed, SL E. J. Russell & J. A. Voelcker. Cbap.
)oOI.
The Soils of tbe Wobum Plots. Irndotr: Innclnam cr€en and Co.- DD. 3lt-345.Gorrnn<fu- E. & Por-hro, A. 6: (1952) A 6odi6ed Eocedure for detemioiog boroo itr plant mat€rial atrd soils usios
l.l'
diaDthrimide, lounal of ,he Scieiae of Food and Agricultuft 3, 622-4z..HoLFoRD, L C. R.; WEDDERBTTRN, R. W. M- & MATrDtcLy, G.
E
C. (1974) A Langmuir twosurfaceequation as a model for phosphate adsorption W soils. lournal of SorT scierce. (In the press.)
M^rrINGLy, G. E G. (1970) Total phosphorus contedts ofsoils by percbloric acid diSestion and sodium
carboDate
fusiorl
lounul of Agricultwal Science, Cambridge 14,79'82.M^TrDroLy, G- E. G- (1974) The WoburD Orgadc MaDuriog experiment. I. DesiSrL qop yields and outrient balance, 1964-72. Rorhatnsted Expcrinatal Slorion.
Rew
lot 1973, Pafi 2,98-133.MaTTDJGL! G. E. G., JoBIsroN, A, E. & C'IrarR, M. (1970) The r€sidual value of faimyard maou€
and superphosphate itr lhe Saxmuldham RotatioD Erperimetrt, 1899-196. Patharnsted Experi'
n@ntal Station. Report for
1
9, Part 2,91-112.MErsoN, A. J.
(1950
Methods of chemical analysis for soil survey sanples. New Zealord Soil Bueau-Balletin No. 12.OEEN, S. R., Cor& C. V., WaTANABE, F. S. & DEAN, L. A. (1954) Estimatiotr of available phosphorus
itr soils by extractiotr with sodiun bicarboDate. United Srates DepartnEnl of Agricubure. Cict l@
No. 939, 19 pp.
ONr Nr, O. G.,
Grrm,
M. & MATTNGLY, G. E. G. (1973) Som€ effects of fertilis€N aod farmyard matrBe o! the orgadc phosphorus in soils. lournal of Soil ScienceA,
1-9.Rqm^usrED E)cERrlcN"rAL STATToN (1970) Delails of the Clasical aad Inng4enn Exper'urEnts up ,o
,tM7.
HarpeEden, 128 pp.S^LT. P. D. (1968) The autbmatic determination of phosphorus io extacts of soils madc with 0'5M
aodiub liydrogEo carboDate and 0 olM calcium cblotide- chernisrry @d Industry, 584-586-SAUNDBS"
w:
M. H- & W[u^trs, E. C.095,
Ob6ervatiotrs oo the detemiEatiotr of total orgaaicDhosDhorus io soils. Journol of Soil Sciente 6, 254-267.
Tnisirv.
i.
(1950) The determination of oryaric carbotr itr soils by dichromate mixtures. Tranto.tiont of thc 4th In .narionol Congress of Soil Scieacc, Anstedarn 1, 161 164.WALKTEY. A. (1947) A critical examiiatioo ofa rapid method for de(eroinisg orgadc carbon iE
soils-effeci of variaiions in digestion cooditioos aiLd of itrorgaDic soil coDstitueots. Soil Sckncz @,
251-26/..
V'lIIllAIrrs, R, J. B. (1973) Chaqges in thc nutrieDt r€serves of lhe Rotharnsted a[d wobum RefereDoe
Expeiiment soils. Rothansred Expeririental Sldtion. ReNft for 1972, Pan. 2,86-10l.
Y^TES, F. & ParrERsoN, H. D. (1958i A dote on the six course rotation experimedts at Rothamsted and WoburD. Jourral of Agriculital Science, Canbrfue SO, lO2-10E.
THE VALUE OF
ORGANIC MANURES
AT
WOBURN.
II
ROTHAMSTED
REPORTFOR
1973,PART
2APPENDIx
Totat
ni!9gen
by,-Kjeldahl digestion usinga
Cu-Se catalyst,NHs
in
the digests wasestimated by distillation.
Total carbon was measured on soil ground <0.5 mm by the method described by Walkley (1947);
no
phosphoric acid was added beforetitrating
and z-phenylanthranific acidwas used as the indicator.
Surface soils taken
from all
plotsin l97l
were also analysedby
the Tinsley (1950) method described by Bremaer and Jenkinson (1960). The ratioof
TinsleyC/Wilkley
C rangedfrom
l.28-1.35*
0.026for all
soils other than those given peat,for
which -theratio was 1.23. The correction factors used were 1.30
for
all treatments exc€pt peat.Total
P
was estimated, after fusionwith
sodiurr carbonate(Mattingly,
1970), on the 'Technicon AutoAr:alyzer' using the method described by SaIt(963).
Orgrrfc
P
was measuredby
an ignition method describedby
Saunders andWiliams
(t955). Soil (2 e
<
60 mesh) was ignitedat
500-550"Cfor
2 hours and extractedwith
0.2N HgSOa (100 ml)
for
2 hours at room temperature. Organic P was estimated fromthe diflerence between 0.2N HzSOa-soluble P extracted from ignited and air-dry soil.
Sodiom bicerbomtesoluble
P
was measurd,
after
extractionwith
0.5M
NaHCOs(Ol*a
et a1.,1954), on the 'Technicon AutoAnalyzer' (Salt, 1968).Water+oluble
bomn
Ten grammes air-dry soil(<2
mm) were refluxedwith
20ml
of
boron-free water
for
15 minutesin
silica flasks. Boron was estimated colorimetricallywith l,l'-dianthrimide
(Gorfinkiel&
Pollard, 1952).Exchangeeble
catims
were leachedfrom
soils(<2
mm)
with
.lV ammonium acetate(Metson, 195Q. Aliquots were evaporated
to
dryness, the residue oxidisedwith
0.5ml
conc. HNO3 and dissolved
in
10 ml 0.21{ HCl. Na,K
and Ca were measured by emission andMg
by atomic absorption spoctrophotometry.MDeralisrbh
nitrogeL
Fifty
grammes soil(<2 nm),
air-dried and storedfor
18-20 weeks, were incubated^t
25"Cat
one-halfof
their
water-holding capacity, measuredin
the laboratory. AJter threeor
eight weeks, the soils were extractedfor
i
hours wittr100 mI jV KrSOa, adjusted to
pH
1. NH4-N and NO3-N were determined in the extractsby steam distillation @rem:rer
&
Keeney, 1965); NO3-N was reducedwiti
Devarda'salloy (<300 mesh). Phosphate in the extracts did not interfere with
NOrN
estimations.'
t
o'
c o E le qr' c?
$.:f=xaaxsuEE
EEEE=BB?T
f$Etq$FF:
+$EEIB?g7
q
-iiP oooooooo o oooooooo o oooooooo o oooooooo o
S Y3---t-t-
l----r-
r
r
I
IE,. EEEEEEES
E
EEEETEIS
T
BEEEEEEE
E
EEBTEEBE
E
F oaoaoooo 6 oooooooo o oooooooo o oooooooo o
>,9
'EE
oo.ooroot-t'- 6 coaFao\ooi 6
.I.: :oooooao
o 6oocro-:-
o
o.9
----.r-ot. cl Hoa Nr,6ho..l a2 ..r.la{ar.{ar.{: .{ c.la{Fc{alNei..r c{
E
>,E Fac.c)haoca o \O.to.{ONF(h o ji^. oo\o\o6\€oaF o\ c.ot--o\ioFF or
e\i
-e
o
2.
9
E
- i
6\ooGa6\oo\o.,rh oo\oo.o@to€
..)ca'i hhl<'n!.66
t
o.i{{hr'FF
h
oo
t Ec.rnq-.o..ro\vr oo \oo\Fhho\o:
h
.E
E*
a:*G;i-:.;
i a;;;;;ad
d\ l& BFio 6;6a,|-i.ral..r c.l NFc{-dc{.at arfrg3.E
o..--o+FN o\ :!q..5f
9?
9 :?Yf
+9Y$
i :?99T9?i I
$
6[{
*u+nei
Ge
s
sgs€s}s*
s
ssess+n$
fi
$$s*nn?s
+
THE VALUE OF
ORGANIC MANURES
AT
WOBURN.
II
O:O\O\ O\O c) 6 C .aOF-c)NN.l H FioO(>FFO O oFFF--FF
-b
I
t\
I o\ U .S oi .s\
Elq
,a
-Bil <
la^
<U
xS
ei
6\f,
=o\
a
d
I
5
s
\t B 'EE=
5$€€E8EE
B
BT$BBE$$
B
E$EEETEE
E
TEE9EET$
8
F oooooooo o oooooooo o oooooooo o oooooooo o
\a -€hho66N - -h<Fo-ilo E !9!'.!?FN.r6\O \o
E,,
HsF*NgUg
F
cgBRFFSg
F
gBBirrF€
F
RFF$;sBs
3
F aooooooo o oooooooo o oooooooo o oooooooo o
r, {r+fi.lF ho\o al .l N c.l a.l al.l a{
-N 6:al:o\ri-oo c) 6iF:Fe.t6al
6++\oFF6ca
.t aa.lal a.l a{ c.l N
<a.t<,FoEa.lo\ -OOOoOOo\
oF\o\oo\{s< \oh\orl\o\ofrh
6.+ 6 t- ..tF 6
-FA\a O rf \O i.,l
6\0ooFt\o(\l
a
hr|FF\ot-Fca
\ono+alona{!'o
F6-F6rirtt O 666.lalat6 6 ..r
tsa6a?ifi
-^-O.,-a.-
Ea
c
----^---
6NNNd.r.i6..r >
:
F
g5ffrs,ias
;fi65dEa's
5a*;tlEaE
OE
-9=Se::9
g
I=eRFNRS
*
z
149ROTHAMSTED
REPORTFOR
1973,PART
2o
SG
gl
.,tr-g3*$qqqgs88
s
3i$sHss$
s
>;i} ooocccoo
o oo666ooc
o
hraoo!.Yr.{o 6
= 6 Yr.i.i.'t r,r + 6
oooooooo o
i
I
Aoo.rt- rco-oo\ 6 .E
Ys6..r..r..t!ct trr d e
RSs888sR s
.eFHi:E-.F i ;
F O\rr\O\O\O r) oo
6
E,
33hc=3ES
g
;
.r-FFFFa{N
- o
1
6
16! F<t-a.,ta.,t6 N I
:;6;n+;n ;
gs..r+!c{t\o\o
t
g!
q,
pr
N.r€6\O6 \66 c E vr\0..r\o!r6d:r !+ o
c.r a{ al e{ c,l N a.l.l .{
-i
oa
3
35S3SRss
r
€
o
d
FI
o\FF6C';F:r - a)
;6;G66GG
,i,
Hi -!!
!(3
-roroor--.rt.
c,€
{Joe;d\d;eo o;
:
lo
- '..9
QeqSrEEB
s E*€E
ooooo66o a
6 > >*
1N-DE
5**o
ssfteeR€E
-
S?it
po-oooo:.o
6-3F rt8rr
rr 9-
€qro
i
X
EE?.E=
='9,!E
I
s5;a.ErEa'9
,$ v' rcrn r.
onwr* n
a <iH<iE<H
-.,r
R88RBR39
I
\J 6lart6d.r.4 6
Z o-oror--oor
o
. 6v)NFO+tsh h X Ft- FF ooFFF F
F a.l i\ota,lal 6 6\
o 66rala{N (.l r aj
833838RR
ENO-F-C)F;3
oooo\Nca6r+ o
a:la,lo\o!t<hN 6 E(\rO\O\O\O\i.t O
oo\oh$FFoo t h \ooF. o oal.o tr
n<-h..1F o6 a h:f-h\o6.ir<. <
lilllll|
tvr66hc{an6rG{ 6 vlhl.lhlaqrr|h ro
o\onrar'1oYro o OO\i6O\O\C O\ 6
o\o\o\6coFF@ oij
oooooooo
o
t,
o\ \t \6 o\\f,
.rQ
t{s
?*
e\
A-\ $ ?s
d $ U!^
pE
sssnrsss
s
'i
66
o-o-.---.-
-!$
nnrnrnss
r
z
.BQ
^^
-Fja .r.{.j N 6t (\ N N ..to
.-<- a{hh6o6o+ 6 . -!,/ o\o\F@O\F6c @
836
;.,;;;;c,1
vrz
9?9:999:
9
-. o\o\@o\6.. (. 6 o\
i*
EEEEEEEE
I
€" oooooooo
o
0^..o^".*
-?){ f ?]:?tf t:f i
6v oooooc,oo o
FL-,_J
is
x3
EE
ssro6rra
9
ihr+-FF66 ts
oooooooo
o
S5;a6,iEE
i
THE VALUE OF
ORGANIC MANURES
AT
WOBURN.
II
9?
9-+:
q
T|
-ts-'r
3i.i+ 3
=s
BsFq
.E
RH
'6o
f 9 !
.a<. g
9">
9A
19Y
;no
"s9
"99
$$T
;
s9Y
d
9
a-o
E...
:F+
,+ I
\od 6\0
\glEZ"
nR
*s
EEI
t^z
ee:9r
" rg
9KF3
-+ l,
..rF
oN
"
fr=li7'
=F
NR,rA
=.i
<S E-I Lz ?f
=t:
s
lJ. l
at-E
.g
'Z
Fd
arc'-+
r-i
E^lgg'
=F
Rh
ti
='il
--U E-l Lz
??
a:
s * r2
eFeF
A
,!Lz
$Y
rr
!
sE
IEP
6s
Fs
{
,381
Lz
ia
yr
.Ia -Lg
RRNs
cB
E-_rIr c 6\0 ON
,r
.u l;A' a^; ;;
Bis t)22
E'\''|''|e
3
S -g
al
A" E:x
::
x 8 Z
'Z
.E'!N
'r-E
?
1
,tLz
ir?
Yr
E
E
E
il22
;RF
FR
'S
r "l
I=
Fx:
i:
E,= . Z
'r;..r
_.^ri
_+r-I
slE9'
=s
nn
i 6 taa
!
el
l-
@.l
.,6r!
ol A-
;G +:
.=\;_c,t.{.a
s,o
-E
-.tLz
TT
9?
E !'lEg
ss
a$
E .ll Lz
ee
irn
a
eL
9
nS
SS
t!E
:
E.9a
E
,5rt
eEt
F gs,
56'
3\o