Open Access
Research article
Development and validation of a computerized expert system for evaluation of
automated visual fields from the Ischemic Optic Neuropathy Decompression Trial
Steven E Feldon
1, Lori Levin
2, Roberta W Scherer
3, Anthony Arnold
4, Sophia M Chung
5,
Lenworth N Johnson
6, Gregory Kosmorsky
7, Steven A Newman
8, Joanne Katz
3,
Patricia Langenberg
9, P David Wilson
9, Shalom E Kelman
9, Kay Dickersin*
3and members of the
Ischemic Optic Neuropathy Decompression Trial Research Group
Address: 1Department of Ophthalmology, University of Rochester School of Medicine, Rochester, NY, USA, 2Office of the Provost, University of Southern
California School of Medicine, Los Angeles, Ca, USA, 3Department of Epidemiology, Johns Hopkins University Bloomberg School of Public Health,
Baltimore, Md, USA, 4Department of Ophthalmology, Jules Stein Eye Institute, Los Angeles, Ca, USA, 5Department of Ophthalmology, Saint Louis
University Eye Institute, St. Louis, Mo, USA, 6Department of Ophthalmology, University of Missouri's Mason Eye Institute, Columbia, Mo, USA, 7Department of Neurophthalmology, Division of Ophthalmology, Cole Eye Institute, The Cleveland Clinic Foundation, Cleveland, Oh, USA, 8Department
of Ophthalmology, University of Virginia, Charlottesville, Va, USA and 9Department of Ophthalmology, University of Maryland School of Medicine,
Baltimore, Md, USA
Email: Steven E Feldon - [email protected]; Lori Levin - [email protected]; Roberta W Scherer - [email protected]; Anthony Arnold - [email protected]; Sophia M Chung - [email protected]; Lenworth N Johnson - [email protected]; Gregory Kosmorsky - [email protected]; Steven A Newman - [email protected]; Joanne Katz - [email protected];
Patricia Langenberg - [email protected]; P David Wilson - [email protected]; Shalom E Kelman - [email protected]; Kay Dickersin* - [email protected]; members of the Ischemic Optic Neuropathy Decompression Trial Research Group - [email protected] * Corresponding author
Abstract
Background: The objective of this report is to describe the methods used to develop and validate a computerized system to analyze Humphrey visual fields obtained from patients with non-arteritic anterior ischemic optic neuropathy (NAION) and enrolled in the Ischemic Optic Neuropathy Decompression Trial (IONDT). The IONDT was a multicenter study that included randomized and non-randomized patients with newly diagnosed NAION in the study eye. At baseline, randomized eyes had visual acuity of 20/64 or worse and non-randomized eyes had visual acuity of better than 20/64 or were associated with patients refusing randomization. Visual fields were measured before treatment using the Humphrey Field Analyzer with the 24-2 program, foveal threshold, and size III stimulus.
Methods: We used visual fields from 189 non-IONDT eyes with NAION to develop the computerized classification system. Six neuro-ophthalmologists ("expert panel") described definitions for visual field patterns defects using 19 visual fields representing a range of pattern defect types. The expert panel then used 120 visual fields, classified using these definitions, to refine the rules, generating revised definitions for 13 visual field pattern defects and 3 levels of severity. These definitions were incorporated into a rule-based computerized classification system run on Excel® software. The computerized classification system was used to categorize visual field defects for an additional 95 NAION visual
fields, and the expert panel was asked to independently classify the new fields and subsequently whether they agreed with the computer classification. To account for test variability over time, we derived an adjustment factor from the pooled short term fluctuation. We examined change in defects with and without adjustment in visual fields of study participants who demonstrated a visual acuity decrease within 30 days of NAION onset (progressive NAION).
Results: Despite an agreed upon set of rules, there was not good agreement among the expert panel when their independent visual classifications were compared. A majority did concur with the computer classification for 91 of 95 visual fields. Remaining classification discrepancies could not be resolved without modifying existing definitions.
Without using the adjustment factor, visual fields of 63.6% (14/22) patients with progressive NAION and no central defect, and all (7/7) patients with a paracentral defect, worsened within 30 days of NAION onset. After applying the adjustment factor, the visual fields of the same patients with no initial central defect and 5/7 of the patients with a paracentral defect were seen to worsen.
Conclusion: The IONDT developed a rule-based computerized system that consistently defines pattern and severity of visual fields of NAION patients for use in a research setting.
Published: 20 November 2006
BMC Ophthalmology 2006, 6:34 doi:10.1186/1471-2415-6-34
Received: 27 July 2006 Accepted: 20 November 2006
This article is available from: http://www.biomedcentral.com/1471-2415/6/34 © 2006 Feldon et al; licensee BioMed Central Ltd.
Background
The Ischemic Optic Neuropathy Decompression Trial (IONDT) was a randomized clinical trial designed to test the safety and efficacy of optic nerve decompression sur-gery (ONDS) combined with careful follow-up for treat-ment of non-arteritic anterior ischemic optic neuropathy (NAION), as well as to document the natural history of NAION [1]. Using visual acuity as the primary outcome measure, the IONDT demonstrated that ONDS is not effective and may be harmful [2].
For NAION, characterized clinically as causing visual field loss, conclusions about treatment efficacy and natural his-tory based on visual acuity outcomes alone may be inad-equate. For this reason, change in the visual field, as measured by the Humphrey Visual Field Analyzer (HVF), was a planned secondary outcome in the IONDT. The Humphrey Visual Field Analyzer® (Zeiss Humphrey, San
Leandro, Ca, USA) provides a standardized testing envi-ronment, quantitative assessment of threshold sensitivity to spots of light at fixed points throughout the visual field, and data regarding reliability of patients' responses.
In the IONDT, we found no difference between visual fields from ONDS and careful follow-up groups at 6 months using the HVF global measure, "mean deviation" (MD). However, MD by itself may be an insufficient measure for assessment of visual fields in eyes with NAION. For example, the classical patterns of defect encountered in NAION may shift without changing aver-age loss or there may be important changes in sensitivity within small areas of the visual field corresponding to nerve fiber bundle defects. These changes in area or size may not be detected when averaged into the MD measure, warranting a more detailed analysis of the quantitative visual field testing.
Development and validation of a system for classifying and assessing change in visual fields is complex due to the lack of "gold standards". Glaucoma trials have utilized a number of approaches for evaluating progression, but the algorithms seldom include classifications based upon the defect type. [3-6] Although the Optic Neuritis Treatment Trial (ONTT) investigators categorized visual field defects, they did not use strict definitions for classification and patterns of field loss were qualitatively rather than quan-titatively determined [7].
Despite a variety of anticipated challenges, in the IONDT we set out to develop a rule-based computerized system for classifying and analyzing visual fields. Our intent was to create logic-based computer algorithms that reliably reproduced the clinical classifications of visual field defects encountered in NAION so as to evaluate the IONDT visual fields. The computer algorithm is intended
for use in a clinical research setting where standardization of classification is required.
Methods
IONDT protocolWe have previously described the IONDT eligibility crite-ria, randomization procedure, and visit protocols in detail [1]. Briefly, patients aged 50 years or older were eligible for randomization into surgical or careful follow-up groups if they had symptoms and signs characteristic of NAION for 14 days or less in one eye. Patients with visual acuity of 20/64 or less in the study eye comprised the "reg-ular entry" group, while patients otherwise eligible but with visual acuity better than 20/64 were enrolled only if visual acuity decreased to 20/64 or worse within 30 days of onset of symptoms ("late entry" group). Patients with acuity better than 20/64 and otherwise eligible and patients who refused randomization were followed as part of a non-randomized group. Institutional review boards at participating institutions approved the protocol and all participating patients provided signed informed consent.
We completed visual field testing of study and non-study eyes of all enrolled patients at baseline, for both rand-omized and non-randrand-omized eyes. In the IONDT, auto-mated perimetry was performed by trained certified visual field technicians using the HVF, 24-2 program with stim-ulus size III, full threshold strategy, and with foveal sensi-tivity measured concurrently. Visual fields for the study eye were measured before those for the non-study eye. For randomized patients, visual fields were obtained at the baseline examination; if randomization took place more than 24 hours after baseline, visual fields were re-meas-ured. Clinical Centers measured visual fields prospec-tively. For randomized patients, this was at the 3, 6, and 12-month visit, at study closeout (minimum of 5 years of follow-up), and at approximately annual intervals between the 12-month and closeout visits. Visual fields for non-randomized patients were obtained at the base-line examination, at either 6 or 12-month visit or both, closeout, and at approximately one-year intervals between the 12-month and closeout visits. All patients were fol-lowed for at least 5 years. Visual field data were evaluated as a secondary outcome measure and not utilized for deci-sion-making during the conduct of the trial.
Methods used to develop the computerized visual field classification system
Development of classification system
decided after a statistical computation determined that the chance of six experts agreeing on ten patterns by guess-ing would be 0.00001. A majority of the experts needed to agree to categorize a field defect as a specific pattern. The chance of this degree of concordance occurring by guess-ing alone was 0.01215. For any field in which the agree-ment among panelists was not significantly better than guessing, the field was considered 'non-classifiable'.
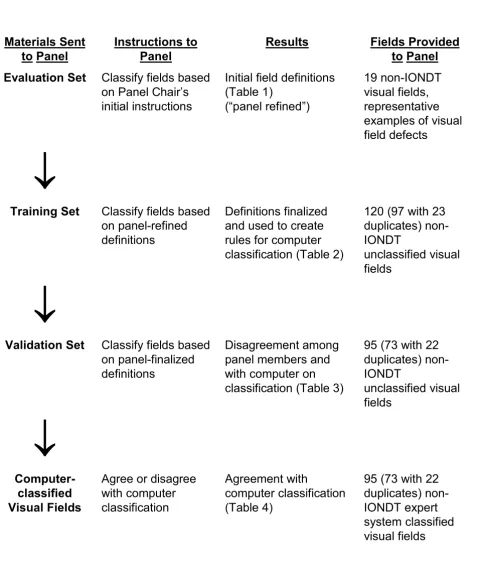
The VFC established the protocol for developing visual field defect categories, training and evaluation of the expert panel, developing and testing of a computerized classification system, and defining progression using this system. The Committee based the sequence of steps that would be used to develop and validate the computerized expert system (see Figure 1) after Molino and associates [8]. The expert panel formulated the definitions of the var-ious types of field defects, (e.g. normal, absolute defect, diffuse depression), all of which were based solely on data available within the 24-2 visual field.
We used 189 visual fields to develop the computer based classification system, none of which were associated with patients enrolled in the IONDT. Eighty-one visual fields were included from patients with NAION who were screened but not eligible for the IONDT. Reasons for inel-igibility included refused enrollment, age < 50 years, onset of symptoms unknown or > 14 days, unable to read English, myocardial infarction within last 6 months, a vis-ual condition precluding reliable visvis-ual acuity measure-ment, and current anticoagulant or corticosteroid use. One hundred eight visual fields from NAION patients not screened or enrolled in the IONDT, and seen at Doheny Eye Institute (n = 24), Emory University (n = 50), or the University of Missouri's Mason Eye Institute (n = 34) were also used to develop the computer-based system, follow-ing institutional review boards approval at each institu-tion. All visual fields used to develop the computer-based classification system had been evaluated for reliability and had < 3 fixation losses, < 3 false positive responses, and < 3 false negative responses.
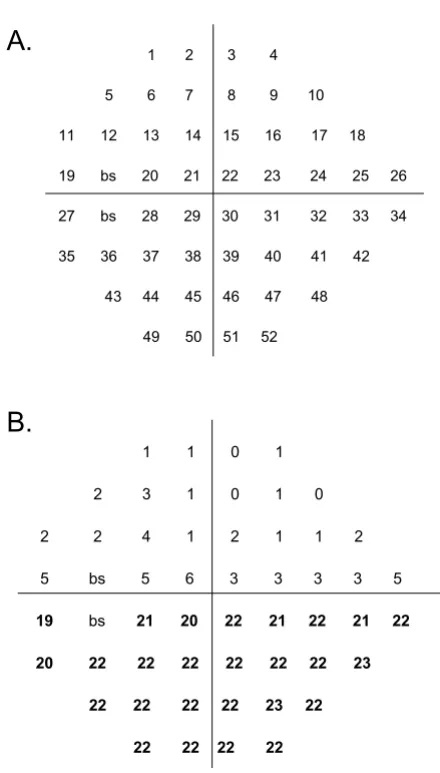
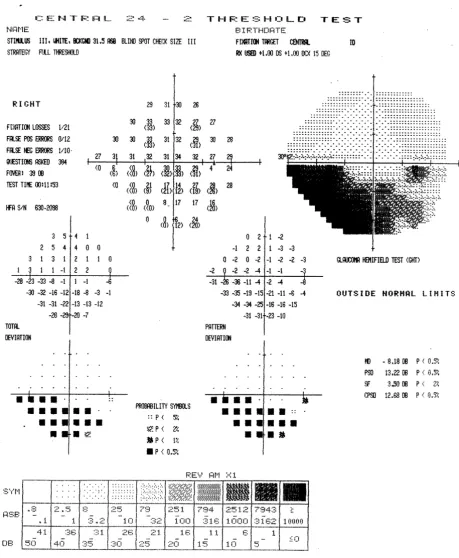
The expert panel first formulated initial operational defi-nitions of visual field defects corresponding to the 52 points in the 24-2 Humphrey scale (see Figure 2). Global guidelines included the following rules:
1. If a field is classified as normal or absolute (no percep-tion of stimuli), no other classificapercep-tion may be made.
2. A depressed point is defined as equal to, or greater than, 4 dB loss.
3. Fields are classified even though they appear unreliable from the HVF indices (i.e., short term fluctuation).
4. Severity is based upon subjective judgment. Only the arcuate/altitudinal category may have more than one severity with a separate severity assignable to the arcuate and the altitudinal components.
Definitions were refined through an iterative process using an "evaluation set" of visual fields until consensus was reached, as follows:
The VFC director reviewed the 189 visual fields to select 19 with one or more representative defects (evaluation set), and then sent the evaluation set to each of the 6 expert panelists, along with instructions, a grading form, and proposed definitions for 13 types of defects and for levels of severity. Members of the expert panel independ-ently reviewed the fields and definitions, and, after tele-phone and face-to-face meetings, agreed upon modified definitions of pattern defects.
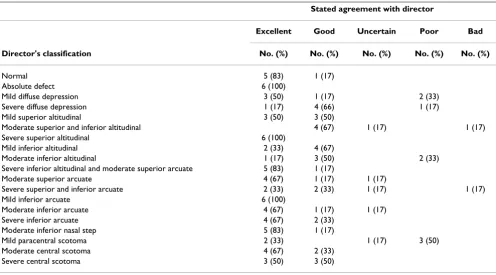
The VFC Director used the modified pattern defect defini-tions to re-classify the 19 visual fields in the evaluation set. Each member of the expert panel independently reported the degree to which s/he agreed with the classifi-cation of each field, choosing from among the following choices: excellent, good, uncertain, poor, or bad. At the same time, the panelists were instructed to categorize the severity (density) of each defect as mild, moderate, severe, or absolute (Table 1). Because there was again lack of agreement among the expert panel on the classification, the group met face-to face to discuss and revise the exist-ing definitions for a second time. Disagreements were resolved by allowing three categories of field defects: peripheral, paracentral, and central as well as a category of "other" which could be used only for visual fields that were impossible to fit into any other specific category.
Using the revised definitions derived from the evaluation set, the VFC then sent a "training set" of 97 masked, rep-resentative, non-IONDT NAION fields to the expert panel for classification. To assess the ability of the panelists to apply the rules reliably, 11 duplicate fields from the train-ing set and 12 fields from the evaluation set were included for a total of 120 fields.
Sequence of steps utilized by the Visual Field Committee to develop rules for analysis of visual field defects by the computer-ized system
Figure 1
Sequence of steps utilized by the Visual Field Committee to develop rules for analysis of visual field defects by the computer-ized system.
95 (73 with 22
duplicates)
non-IONDT expert
system classified
visual fields
Agreement with
computer classification
(Table 4)
Agree or disagree
with computer
classification
Computer-classified
Visual Fields
↓↓↓↓
95 (73 with 22
duplicates)
non-IONDT
unclassified visual
fields
Disagreement among
panel members and
with computer on
classification (Table 3)
Classify fields based
on panel-finalized
definitions
Validation Set
↓↓↓↓
120 (97 with 23
duplicates)
non-IONDT
unclassified visual
fields
Definitions finalized
and used to create
rules for computer
classification (Table 2)
Classify fields based
on panel-refined
definitions
Training Set
↓↓↓↓
19 non-IONDT
visual fields,
representative
examples of visual
field defects
Initial field definitions
(Table 1)
(“panel refined”)
Classify fields based
on Panel Chair’s
initial instructions
Evaluation Set
Fields Provided
to Panel
Results
Instructions to
Panel
Materials Sent
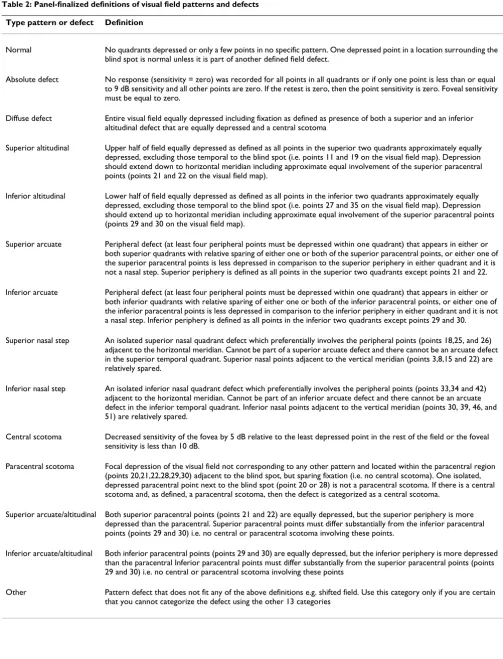
The final classification system included "normal" and 13 different rule-based field or defect types, shown in Table 2. Severity was restricted to mild, moderate, and severe, and was defined subjectively.
The computer-based expert system
The VFC Director (SEF) and programmer (LL) translated the rules for the defect definitions and the general rules
into a point-by-point set of algorithms applied using log-ical statements included with standard Excel software (computer-based expert system).
Software structure
The computer-based expert system, constructed as a rule-based system on an Excel® platform, run under Windows
98®, evaluated each field quadrant by quadrant.
Quad-rants were then analyzed in combination as needed to encompass definitions of all identified types of defects. The programmer translated each rule into a logical state-ment that could be found true or false, taking the form "if ... then". A truth table was utilized to define specific types of field defects, based upon definitions of the expert panel. Two forms of logical statements were used to iden-tify pattern defects. The first statement was based upon
average dB loss within a quadrant. If the average loss did not meet the criteria for depression (i.e., 4 dB) then the alternative statement, based on the number of disturbed points within a quadrant, was used to determine the pres-ence of pattern defects. Thus, the number of disturbed points was used primarily to find mild defects that were missed by averaging.
For instance, if the average dB loss was greater in the periphery than in the central field by 5 dB, then an arcuate defect was defined as present in that quadrant (see defini-tion in Table 2). If the central dB loss was greater by 5 dB than the periphery, then a central defect was present. If no pattern defect was found by averaging, then disturbed point algorithms were used to find mild or smaller pattern defects within a quadrant or defect-appropriate combina-tion of quadrants. A fixed predetermined number of dis-turbed points had to be within the boundary of a pattern defect for that defect to be considered present. For exam-ple, a superior arcuate defect is defined as four depressed points within one or both upper quadrants (see definition in Table 2).
Some pattern defects were determined by the presence or absence of other defects. For example, if there were supe-rior and infesupe-rior altitudinal defects and a central scotoma, then the pattern was defined as diffuse depression. If there was both a paracentral scotoma and a central scotoma, then the pattern was defined as a central scotoma alone.
Average dB loss within a pattern defect and number of dis-turbed points was used to classify a defect as mild, moder-ate, or severe. The severity classification of the expert panel was used to define the boundaries for each type of defect. Table 3 shows how severity for an altitudinal defect was determined using 23 altitudinal defects in the training set identified by the expert panel. Severity for other defects was similarly determined (number and type of defect used to determine severity scores: 9 paracentral scotomas; 26 arcuate defects; 20 diffuse depression defects; and 3 nasal step defects). Classification as an absolute defect (i.e. no
A Schematic of a 52-point (program 24-2) Humphrey Visual Field for a left eye
Figure 2
A Schematic of a 52-point (program 24-2) Humphrey Visual Field for a left eye. The point indicator number for each point measured is shown with its position in a visual field. "bs" indicates the two points that make up the blind spot. Points for the right eye are a mirror image, i.e., points are read right to left for each row. B Example of a Hum-phrey Visual Field with an inferior altitudinal field defect. This example of a visual field shows the difference between the values in decibels of each point in the linear array between a single visual field and those of age-matched controls. Differences in bold are those defining an inferior altitudinal defect.
1 1 0 1
2 3 1 0 1 0
2 2 4 1 2 1 1 2
5 bs 5 6 3 3 3 3 5
19 bs 21 20 22 21 22 21 22
20 22 22 22 22 22 22 23
22 22 22 22 23 22
22 22 22 22 1 2 3 4
5 6 7 8 9 10
11 12 13 14 15 16 17 18
19 bs 20 21 22 23 24 25 26
27 bs 28 29 30 31 32 33 34
35 36 37 38 39 40 41 42
43 44 45 46 47 48
49 50 51 52
A.
response to the brightest stimulus at all points tested on the 24-2 HVF) required use of actual sensitivity rather than relative sensitivity loss.
Definition of change across time Calculation of SFC
To measure change in visual field defects over time (i.e., from baseline to a follow-up visits) we planned to analyze visual fields at multiple time points and compare defect type and severity. We anticipated that change in an indi-vidual's visual field could entail change in defect type, defect severity, both defect type and severity, identifica-tion of a new defect at follow-up not observed at baseline, or disappearance of a defect observed at baseline.
Because spurious changes in visual fields caused by patient learning effects or by short term fluctuation were possible, we decided to use the Humphrey global index short term fluctuation (SF), a measure of intra-test varia-bility, as a standard by which to determine the normal variation within an individual's visual fields over a fixed time period. SF is determined by measuring the difference between two threshold measurements at 10 different points across the entire field during the same test. The average of these differences constitute the SF. Clinically, a small SF (1 to 2 dB) indicates a reliable field [9]. To esti-mate the normal variation of an individual's visual fields measured at baseline and follow-up, we used a pooled estimate, SFC, for both visits, calculated as follows:
where SFC, is half of the 95% confidence interval on the pooled estimate of SF across both visits, SFbaseline is the SF measured for the visual field at baseline and SFfollow-up is the SF measured at follow-up (i.e., from the visual field obtained at the 6 month visit for determining change from baseline to the 6 month visit or from the visual field obtained at the 12 month visit for change from baseline to the 12 month visit).
When there was an apparent change in defect type from baseline to follow-up we removed the effect of normal variation by using the value of SFC to "adjust" the
follow-up visit Humphrey visual field at key points used by the computerized expert system to differentiate between defects types. The adjustment was made in the direction that would decrease the probability of detecting a change in defect type from baseline to follow-up. The adjusted data was then reclassified. For example, if an individual had visual fields classified as having a superior arcuate defect at baseline and a superior altitudinal defect at the follow-up visit, that patient's SFC for these visits was sub-tracted from the points that distinguish an arcuate from an altitudinal defect in the computerized expert system, i.e., paracentral points 21 and 22, in the follow-up field. This adjusted follow-up visual field was then re-classified.
SFC = SFbaseline+SFfollowup
1 96. ( 2 2 )
Table 1: Agreement between six expert panel members' and director's classification for 19 non-IONDT visual fields in the Evaluation Set
Stated agreement with director
Excellent Good Uncertain Poor Bad
Director's classification No. (%) No. (%) No. (%) No. (%) No. (%)
Normal 5 (83) 1 (17)
Absolute defect 6 (100)
Mild diffuse depression 3 (50) 1 (17) 2 (33)
Severe diffuse depression 1 (17) 4 (66) 1 (17)
Mild superior altitudinal 3 (50) 3 (50)
Moderate superior and inferior altitudinal 4 (67) 1 (17) 1 (17) Severe superior altitudinal 6 (100)
Mild inferior altitudinal 2 (33) 4 (67)
Moderate inferior altitudinal 1 (17) 3 (50) 2 (33) Severe inferior altitudinal and moderate superior arcuate 5 (83) 1 (17)
Moderate superior arcuate 4 (67) 1 (17) 1 (17)
Severe superior and inferior arcuate 2 (33) 2 (33) 1 (17) 1 (17)
Mild inferior arcuate 6 (100)
Moderate inferior arcuate 4 (67) 1 (17) 1 (17)
Severe inferior arcuate 4 (67) 2 (33)
Moderate inferior nasal step 5 (83) 1 (17)
Mild paracentral scotoma 2 (33) 1 (17) 3 (50)
Moderate central scotoma 4 (67) 2 (33)
Table 2: Panel-finalized definitions of visual field patterns and defects
Type pattern or defect Definition
Normal No quadrants depressed or only a few points in no specific pattern. One depressed point in a location surrounding the blind spot is normal unless it is part of another defined field defect.
Absolute defect No response (sensitivity = zero) was recorded for all points in all quadrants or if only one point is less than or equal to 9 dB sensitivity and all other points are zero. If the retest is zero, then the point sensitivity is zero. Foveal sensitivity must be equal to zero.
Diffuse defect Entire visual field equally depressed including fixation as defined as presence of both a superior and an inferior altitudinal defect that are equally depressed and a central scotoma
Superior altitudinal Upper half of field equally depressed as defined as all points in the superior two quadrants approximately equally depressed, excluding those temporal to the blind spot (i.e. points 11 and 19 on the visual field map). Depression should extend down to horizontal meridian including approximate equal involvement of the superior paracentral points (points 21 and 22 on the visual field map).
Inferior altitudinal Lower half of field equally depressed as defined as all points in the inferior two quadrants approximately equally depressed, excluding those temporal to the blind spot (i.e. points 27 and 35 on the visual field map). Depression should extend up to horizontal meridian including approximate equal involvement of the superior paracentral points (points 29 and 30 on the visual field map).
Superior arcuate Peripheral defect (at least four peripheral points must be depressed within one quadrant) that appears in either or both superior quadrants with relative sparing of either one or both of the superior paracentral points, or either one of the superior paracentral points is less depressed in comparison to the superior periphery in either quadrant and it is not a nasal step. Superior periphery is defined as all points in the superior two quadrants except points 21 and 22.
Inferior arcuate Peripheral defect (at least four peripheral points must be depressed within one quadrant) that appears in either or both inferior quadrants with relative sparing of either one or both of the inferior paracentral points, or either one of the inferior paracentral points is less depressed in comparison to the inferior periphery in either quadrant and it is not a nasal step. Inferior periphery is defined as all points in the inferior two quadrants except points 29 and 30.
Superior nasal step An isolated superior nasal quadrant defect which preferentially involves the peripheral points (points 18,25, and 26) adjacent to the horizontal meridian. Cannot be part of a superior arcuate defect and there cannot be an arcuate defect in the superior temporal quadrant. Superior nasal points adjacent to the vertical meridian (points 3,8,15 and 22) are relatively spared.
Inferior nasal step An isolated inferior nasal quadrant defect which preferentially involves the peripheral points (points 33,34 and 42) adjacent to the horizontal meridian. Cannot be part of an inferior arcuate defect and there cannot be an arcuate defect in the inferior temporal quadrant. Inferior nasal points adjacent to the vertical meridian (points 30, 39, 46, and 51) are relatively spared.
Central scotoma Decreased sensitivity of the fovea by 5 dB relative to the least depressed point in the rest of the field or the foveal sensitivity is less than 10 dB.
Paracentral scotoma Focal depression of the visual field not corresponding to any other pattern and located within the paracentral region (points 20,21,22,28,29,30) adjacent to the blind spot, but sparing fixation (i.e. no central scotoma). One isolated, depressed paracentral point next to the blind spot (point 20 or 28) is not a paracentral scotoma. If there is a central scotoma and, as defined, a paracentral scotoma, then the defect is categorized as a central scotoma.
Superior arcuate/altitudinal Both superior paracentral points (points 21 and 22) are equally depressed, but the superior periphery is more depressed than the paracentral. Superior paracentral points must differ substantially from the inferior paracentral points (points 29 and 30) i.e. no central or paracentral scotoma involving these points.
Inferior arcuate/altitudinal Both inferior paracentral points (points 29 and 30) are equally depressed, but the inferior periphery is more depressed than the paracentral Inferior paracentral points must differ substantially from the superior paracentral points (points 29 and 30) i.e. no central or paracentral scotoma involving these points
If the adjusted visual field was still classified as having a superior altitudinal defect, then the superior portion of the follow-up field would be classified as having changed from baseline, from a superior arcuate to a superior altitu-dinal defect. On the other hand, if the adjusted follow-up visual field was classified as having a superior arcuate defect, then the follow-up visual field was classified as "not changed" with a superior arcuate defect for both vis-its. This general approach was used to distinguish an arcu-ate from an altitudinal defect, and a central from a paracentral defect.
Change in severity was also determined after applying SFC
but was only evaluated in fields whose defects were classi-fied as not changed.
Results
Validation of the classification scheme
A set of 95 non-IONDT NAION visual fields was sent to the expert panel as a "validation set"; of these, 22 were masked duplicates chosen systematically from the origi-nal training set (every fifth field listed in ID numeric order). The level of agreement on classification of these fields among the expert panel and the corresponding agreement of the computer with the panel members' clas-sifications is shown in Table 4. Reliability of individual panel members in re-classifying defects in the 22
dupli-cate visual fields from the evaluation set averaged 57% (range; 32% to 77%), despite a common set of definitions derived and finalized by consensus.
Figures 3 through 7 show representative visual fields used in the validation process and illustrate the type of disa-greement that was found. Figure 3 shows an example of visual fields for which the expert panel members inde-pendently arrived at pattern and severity classifications that were exactly the same as the computerized classifica-tion. Figure 4 shows a visual field in which the members agreed among themselves but not with the computer clas-sification, and Figures 5, 6 and 7 show fields for which there was little agreement among the expert panel during independent classification.
We then used an alternative validation approach, whereby the panelists were asked to agree or disagree with the com-puter's classification. We changed the question posed to panel members from one of application of the rules to classify the defects in this visual field to "does the consist-ent application of consensus-derived rules applied by the computer program result in a classification of this visual field that is clinically acceptable?" There were only 4 of 95 instances in which the majority (≥ 50%) of the panelists did not believe that the computer classification was clini-cally acceptable (Table 5). Specific differences were
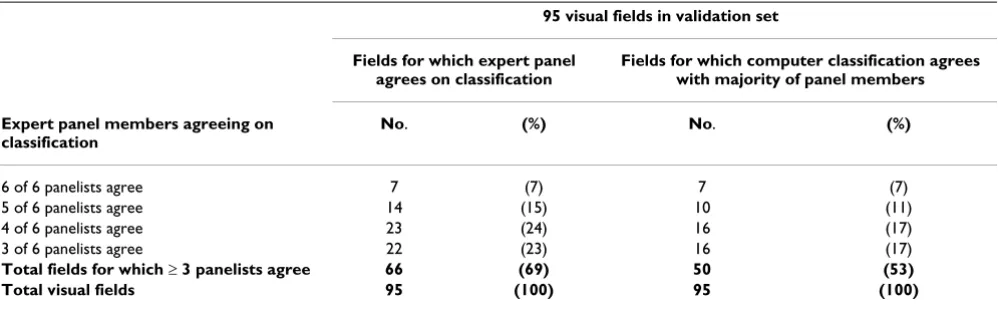
Table 4: Agreement among members of the expert panel and agreement of computer with expert panel in independent classification of visual fields in the validation set
95 visual fields in validation set
Fields for which expert panel agrees on classification
Fields for which computer classification agrees with majority of panel members
Expert panel members agreeing on classification
No. (%) No. (%)
6 of 6 panelists agree 7 (7) 7 (7)
5 of 6 panelists agree 14 (15) 10 (11)
4 of 6 panelists agree 23 (24) 16 (17)
3 of 6 panelists agree 22 (23) 16 (17)
Total fields for which ≥ 3 panelists agree 66 (69) 50 (53)
Total visual fields 95 (100) 95 (100)
Table 3: Classification of severity of 23 visual fields with altitudinal defects from training set
Field parameters
Qualitative severity (as classified by panel) n Average dB loss within defect 95% CI Average number points in defect 95% CI
Mild 1 6.2 5
Moderate 5 18.2 12.9 to 23.5 25 24.3 to 25.7
Example of visual field associated with excellent agreement among members of the expert panel and computerized classifica-tion
Figure 3
Example of good agreement among members of the expert panel, and moderate agreement with computer classification Figure 4
Example of poor agreement among members of the expert panel, but agreement with computer classification Figure 5
Example of poor agreement among members of the expert panel, and good agreement with computer classification Figure 6
Example of poor agreement among members of the expert panel, and poor agreement with computer classification Figure 7
(1) Identification of an additional mild superior altitudi-nal defect by the computer, but not the panel members for one field;
(2) Classification by the computer of one field as having a severe diffuse defect and as a combination of three sep-arate defects (superior arcuate, inferior arcuate, and cen-tral scotoma) by the expert panel;
(3) Classification by the computer as an altitudinal or arcuate defect and by the expert panel as an arcuate or alti-tudinal, respectively in 2 visual fields.
Figure 7 is an example of the third type of disagreement listed. Although two members of the panel concurred with the computer classification (superior arcuate, infe-rior altitudinal, and central scotoma), two members clas-sified the inferior defect as an arcuate and one member classified the superior defect as an altitudinal defect. One member believed that only a superior arcuate was present. Investigation revealed that if the computer algorithm were modified to allow concordance with the panel members, other classification errors would result; therefore, these discrepancies were allowed to stand. Thus, there was majority agreement of the expert panel and the computer classification in 91 of 95 (96%) fields.
Validation of change
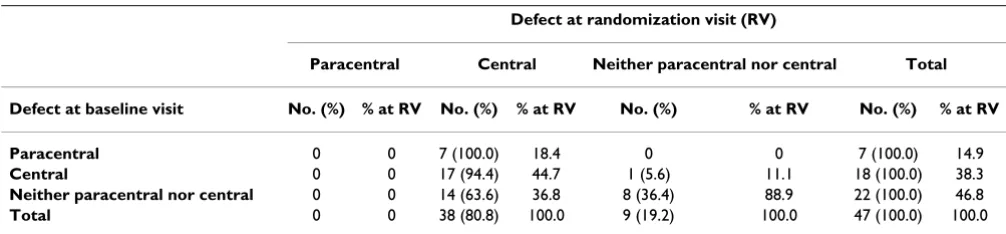
To test our approach to define change, we examined the "change" in the study eye visual field from baseline to the randomization visit for IONDT late entry patients. It is reasonable to expect that a majority of late entry patients experienced a change in the central visual field in addition to the measured change in visual acuity. Table 6 shows the unadjusted number and type of central defects observed in visual fields of 47 IONDT late entry patients at the base-line and randomization visits. Using data without any adjustment for normal variation, we found that 14 of 22 (63.6%) of the patients who had neither a paracentral nor central defect at baseline developed a central defect by the randomization visit. In addition, all 7 patients who started with a paracentral defect developed a central defect by the randomization visit. Of 18 patients starting with a central defect, only one changed to a paracentral defect at randomization.
When we applied the adjustment, SFC, for each patient's
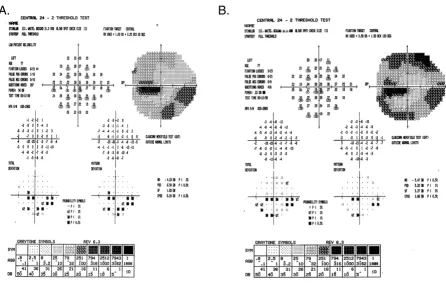
normal variation to the visual fields of the late entry eyes, the classification of 2/47 randomization fields was differ-ent. Five rather than the initial 7 patients who had a para-central defect at baseline had a para-central defect at randomization (see Table 7). All other defect changes remained the same. A Stuart-Maxwell chi-square test of homogeneity showed that the shift in distribution of defects from baseline to randomization as shown in Table 7 is statistically significant (p = 0.0003). There was no observed change in severity (average dB loss) for the cen-tral defect of the 17 study participants who had a cencen-tral defect at both baseline and randomization (mean 11.5 dB versus 6.7 dB at baseline and randomization, respectively; p = 0.09) after SFC adjustment. Figures 8 and 9 show examples of visual fields obtained at baseline and rand-omization visits in two late entry IONDT study partici-pants; these examples show the type of change detected by the computerized system.
Discussion
Automated perimetry facilitates the collection of quantita-tive data on the pattern and severity of visual field defects.
Table 6: Comparison of defects in central location of study eye at baseline visit with defects at randomization visit, in late entry patients, without correction for short term fluctuation (SFC)
Defect at randomization visit (RV)
Paracentral Central Neither paracentral nor central Total
Defect at baseline visit No. (%) % at RV No. (%) % at RV No. (%) % at RV No. (%) % at RV
Paracentral 0 0 7 (100.0) 18.4 0 0 7 (100.0) 14.9
Central 0 0 17 (94.4) 44.7 1 (5.6) 11.1 18 (100.0) 38.3
Neither paracentral nor central 0 0 14 (63.6) 36.8 8 (36.4) 88.9 22 (100.0) 46.8
Total 0 0 38 (80.8) 100.0 9 (19.2) 100.0 47 (100.0) 100.0
Table 5: Agreement with computer-based classification of 95 visual fields in the validation set among six members of the expert panel
Visual field
In agreement with computer No. (%)
Six of six panelists agree 59 (62) Five of six panelists agree 24 (25) Four of six panelists agree 8 (8) Three of six panelists agree 2 (2) Two of six panelists agree 2 (2)
Change in visual field from baseline to randomization for a late entry study participant Figure 8
Change in visual field from baseline to randomization for a late entry study participant. The superior field showed no defect at baseline (8A). Nine days later at the randomization visit (8B), it was classified as an arcuate and remained as an arcuate after adjustment using SFC. The inferior field was classified as an arcuate at both baseline and at randomization and so
no adjustment using SFC was applied. The central field was classified as a paracentral at baseline, and a central at randomization, but remained a paracentral defect after adjustment using SFC.
B.
A.
Table 7: Comparison of defects in central location of study eye at baseline visit with defects at randomization visit, in late entry patients, with correction for short term fluctuation (SFC)
Defect at randomization visit (RV)*
Paracentral Central Neither paracentral nor central Total
Defect at baseline visit No. (%) % at RV No. (%) % at RV No. (%) % at RV No. (%) % at RV
Paracentral 2 (28.6) 0 5 (71.4) 13.9 0 0 7 (100.0) 14.9
Central 0 0 17 (94.4)† 47.2 1 (5.6) 11.1 18 (100.0) 38.3
Neither paracentral nor central 0 0 14 (63.6) 38.9 8 (36.4) 88.9 22 (100.0) 46.8
Total 2 (4.3) 100.0 36 (76.6) 100.0 9 (19.2) 100.0 47 (100.0) 100.0
* p = 0.0003; Stuart Maxwell test for marginal homogeneity
To date, however, full use has not been made of quantita-tive data for detection, characterization, or progression of visual field defects in ischemic optic neuropathy. In the IONDT, we developed and validated a reliable rule-based system. This system proved capable of consistently defin-ing pattern and severity of visual field defects detected in eyes with NAION enrolled in the IONDT. It also allowed for evaluation of change in visual field defect and severity over time. Development of this system entailed devising definitions for visual field defects encountered in NAION patients using an iterative process and expert panel and defining progression. All decision rules were based upon the opinion of the expert panel; these rules then provided the basis by which all field classifications were made. Fur-ther testing of the system showed that this rule-based computer program is a valid method for analysis of the
patterns and severities of visual field data for individuals with NAION.
Development and validation of a system for classifying visual fields is complex, given that there is no existing "gold standard" for defect classification and that experts are unable to reach agreement on defect classification, at least in this study. This type of problem is well known in medicine. For instance, studies validating the use of com-puter-assisted diagnosis tools [8,10,11] suggest that the differences between computer diagnosis and human expert diagnosis differed by about the same extent as human experts disagree among themselves. The diagnos-tic variability in this study was similar to performance of humans and computers in validations of other expert sys-tems for interpretations lacking a "gold standard", for
Change in visual field from baseline to randomization for a late entry study participant Figure 9
Change in visual field from baseline to randomization for a late entry study participant. The superior field showed an arcuate defect at baseline (9A). Twenty-one days later, at the randomization visit (9B), it was classified as an altitudinal but after adjustment using SFC, it remained classified as an arcuate defect. The inferior field was classified as an arcuate at baseline and worsened to an altitudinal defect at randomization both before and after adjustment using SFC. The central field was classi-fied as a paracentral at baseline, and as a central scotoma at randomization both before and after adjustment using SFC.
which agreement ranged from 50% to 70% [8,10,11]. Given that computerized diagnosis may be no better than that of an expert panel, the principal reason for utilizing a computerized system in the context of a clinical trial is to reduce inconsistency by eliminating intra- and inter-observer variability. For example, we found that members of the expert panel often did not classify a visual field the same way they previously classified it. Thus, use of a com-puterized system reduces variability, although not neces-sarily the original bias of the expert panel in classification of visual field defects. Once incorporated into a computer system, the criteria for categorizing the pattern and sever-ity of visual field defects are, according to Hirsbrunner and colleagues [12], "explicit, obvious, and standard-ized." Such attributes are essential within the context of randomized clinical trials.
Development and validation of a classification system for visual fields requires several steps [8,10,11]. First, an expert panel must achieve consensus on a set of rules for classifying defects. Second, the experts apply the rules suc-cessfully, i.e., the rate of agreement was not meaningfully different from agreement reported for similar classifica-tion systems in other medical contexts. Third, the consist-ent application of the rules by a computerized system produces classifications that do not disagree with the panel more than the expert panel disagrees with itself. Finally, the computerized system produces reasonable defect classifications, defined as classifications with which the expert panel rarely disagrees.
We recognized that more than one interpretation was pos-sible for a given distribution of disturbed points on a vis-ual field and that it was not going to be possible for all the experts to agree on a gold standard to evaluate the compu-terized system. Thus, we elected to accept the computer-ized determination given that the panel considered it to be consistent with clinical interpretation.
A quantified or computerized analysis of visual fields that approximates a human interpretation of an automated visual field faces particular challenges in three areas – detection, progression, and characterization of the defect. Difficulties in detection of defect relate primarily to distin-guishing appropriately between short-term and long-term fluctuation. This problem is further compounded in vari-ous disease states, such as glaucoma, in which the patho-logical process itself produces fluctuation in sensitivity [13]. The Ocular Hypertension Treatment Study used multiple confirmation fields to diagnose the presence or absence of a defect and provides an example of a method to deal with clinical detection of visual field defects [14]. More advanced models of visual field perturbations, such as those by De la Rosa and colleagues [15], utilize an approach for rapid assessment of glaucomatous field
defects based upon multiple correlations. Although the IONDT computerized system cannot distinguish between short and long-term fluctuation when detecting a defect pattern within a single field, it does use a standard set of rules for classification and detection and thus provides for consistent identification and classification of defects.
Progression of field defects is a common end-point for glaucoma studies. The issue, once again, is determining change, but from an abnormal as opposed to a normal baseline. Katz [16] reviewed scoring methods employed by two multicenter clinical trials, the Advanced Glaucoma Intervention Study (AGIS) and the CIGTS. These studies utilized a cumulative score (0–20), based upon depres-sion of adjacent points occurring within specified regions of the visual field. Depression was defined by total devia-tion plot on the HVF printout in the AGIS and by proba-bility values in the CIGTS. McNaught and co-workers [17] developed a linear model of point wise sensitivity values against time to identify progression in normal tension glaucoma. By any of these methods, detection and pro-gression could be determined operationally, based on the sensitivity and reliability required in a particular study. The IONDT used change, defined as decibel loss or increased number of points within defects identified at baseline, to detect progression using the computerized classification system, after adjusting for measured within-individual variations in performance.
Other methods have been used to characterize visual fields. For example, neural networks have been touted as providing a means for allowing computers to "learn" how to categorize visual fields correctly, even in the absence of specified rules. In the supervised class of artificial neural networks, the systems require a training set of "correctly" categorized visual fields to allow learning to occur [20-23]. Thus, there is a tautology in that, in the absence of rules, how is such a training set derived? Henson and asso-ciates suggest that unsupervised neural networks can be used to resolve this dilemma, as they are self-classifying [24]. However, the patterns correspond to the number of nodes used in the neural network and do not necessarily correspond to clinically identified field defects.
In designing the computerized system for evaluation of IONDT visual fields, we encountered several methodolog-ical issues that could have influenced definitions of defect classification and/or change. First, fields were obtained using full threshold strategy rather than SITA, which resulted in prolonged testing times. SITA strategies were unavailable at the outset of patient recruitment and had not yet been completely validated by the study end. Sec-ond, because the IONDT did not formally train study patients on performing Humphrey visual field exams before collecting study visual field data, some observed changes may be due to learning effects over time. The importance of training was not generally recognized in 1992, when the IONDT began. However, the testing method used in the IONDT is probably generalizable, given that most patients in a clinical setting do not undergo visual field training sessions. Despite these meth-odological issues, the observed changes in pattern classifi-cation and severity of IONDT visual fields were remarkably consistent over time [25], suggesting that it is unlikely that the computer system algorithms had sub-stantial classification errors.
Another concern relating to study validity was the failure of the 6 experts to agree completely on a sizable propor-tion of defect classificapropor-tions for the test fields during the initial validation. The number of experts we included in our testing differed substantially from those utilized in virtually all other prospective trials involving visual fields. This was a deliberate decision to ensure rigor and avoid chance agreement. The observed lack of concordance in classifying defects by the 6 experts is most likely due to the number of experts (6 experts rather than the usual 2 experts plus a tie-breaker) and independence of reviewers (experts from geographically dispersed clinical centers). Indeed, we believe members of our expert panel were more likely to manifest true independence in decision-making than experts at a single reading center.
Conclusion
In summary, we developed a computerized method for analyzing automated perimetric data in the IONDT. This system is a validated rule-based system capable of consist-ently defining pattern and severity of visual field defect encountered in NAION patient. Its primary use is in the research setting; these methods are not meant to replace clinical evaluation. Once incorporated into a computer system, the criteria for categorizing the pattern and sever-ity of visual field defects are explicit, obvious, and stand-ardized. Such attributes are essential within the context of randomized clinical trials.
Abbreviations
AGIS: Advanced Glaucoma Intervention Study
CIGTS: Collaborative Initial Glaucoma Treatment Study
HVF: Humphrey Visual Field Analyzer
IONDT: Ischemic Optic Neuropathy Decompression Trial
MD: mean deviation, a Humphrey Visual Field Analyzer global index
NAION: non-arteritic anterior ischemic optic neuropathy
OHTS: Ocular Hypertension Treatment Study
ONDS: optic nerve decompression surgery
ONTT: Optic Neuritis Treatment Trial
SF: short term fluctuation, a Humphrey Visual Field Ana-lyzer global index
SFC: the pooled estimate of short term fluctuation across two visits
SITA: Swedish Interactive Thresholding Algorithm
VFC: Visual Field Committee for the Ischemic Optic Neu-ropathy Decompression Trial
Competing interests
The author(s) declare that they have no competing inter-ests.
Authors' contributions
design of the development and validation studies, coordi-nated the validation studies, contributed to interpreting the study findings, and contributed to writing and editing the manuscript. AA collaboratively developed the algo-rithms for identification of the visual field patterns and participated in the validation studies as a member of the expert panel. SMC collaboratively developed the algo-rithms for identification of the visual field patterns and participated in the validation studies as a member of the expert panel. LNJ collaboratively developed the algo-rithms for identification of the visual field patterns and participated in the validation studies as a member of the expert panel. GK collaboratively developed the algorithms for identification of the visual field patterns and partici-pated in the validation studies as a member of the expert panel. SAN collaboratively developed the algorithms for identification of the visual field patterns and participated in the validation studies as a member of the expert panel. JK contributed to the design of the development and vali-dation studies, interpretation of study findings. PL con-tributed to the design of the development and validation studies, provided statistical advice, and contributed to writing and editing the manuscript. PDW contributed to the design of the development and validation studies, provided statistical advice, and contributed to writing and editing the manuscript. SEK served as scientific Chair of the Ischemic Optic Neuropathy Decompression Trial, contributed to the design of the study. KD contributed to the design of the development and validation studies, interpreted the study findings, and contributed to writing and editing the manuscript. All authors read and approved the final manuscript.
Acknowledgements
The Ischemic Optic Neuropathy Decompression Trial study was supported under cooperative agreements by the National Eye Institute, Bethesda, Maryland, EY09608, EY09545, EY09556, EY09555, EY09554, EY09576, EY09565, EY09551, EY09599, EY09584, EY09578, EY09572, EY09575, EY09567, EY09598, EY09550, EY09553, EY09566, EY09569, EY09579, EY09571, EY09568, EY09557, EY09552, EY09570, EY09582, and EY09626 and a Challenge Grant to University of Rochester Department of Ophthal-mology from Research to Prevent Blindness.
Members of the Ischemic Optic Neuropathy Decompression Trial Research Group were as follows.
Clinical Centers:
Allegheny General Hospital, Pittsburgh, Pa: John Kennerdell, MD (Principal Investigator); Anna Bruchis, MD (Coordinator);
St. Louis University Eye Institute, St. Louis University Health Sciences Center, St. Louis, Mo: Sophia Chung, MD (Principal Investigator); Dawn Govreau (Coordinator); John Holds, MD; John Selhorst, MD;
Carolinas Medical Center, Charlotte, NC: Mark Malton, MD (Principal Investi-gator); Amy Rogers (Coordinator); Timothy Saunders, MD
Cleveland Clinic Foundation, Cleveland, Oh: Gregory Kosmorsky, DO (Princi-pal Investigator); Karen King, COT (Coordinator); Tami Fecko; Deborah Ross, CRA;
Doheny Eye Institute, Los Angeles, Ca: Steven Feldon, MD (Principal Investiga-tor); Lori Levin, MPH (CoordinaInvestiga-tor); Kerry Zimmerman, MS (Coordina-tor); Kathy Friedberg, COMT; Nahid Sadaati, CO;
Emory University, Atlanta, Ga: Nancy J. Newman, MD (Principal Investigator); Donna Loupe, BA (Coordinator); Ted Wojno, MD
Henry Ford Hospital, Detroit, Mi: Barry Skarf, MD (Principal Investigator); Mark Croswell; Wendy Gilroy Clements; George Ponka, COMT;
University of Texas, Houston, Tx: Rosa Tang, MD (Principal Investigator); Melissa Hamlin (Coordinator); Jewel Curtis; Kirk Mack; Portia Tello;
Jules Stein Eye Institute, Los Angeles, Ca: Anthony Arnold, MD (Principal Inves-tigator); Janet Buckley (Coordinator); Robert Goldberg, MD; Lynn Gordon, MD; Howard Krauss, MD;; Robert Stalling;
W.K. Kellogg Eye Center, University of Michigan, Ann Arbor, Mi: Wayne Corn-blath, MD (Principal Investigator); Barbara Michael (Coordinator);
Mason Institute of Ophthalmology, University of Missouri, Columbia, Mo: Len-worth N. Johnson, MD (Principal Investigator); Gaye Baker (Coordinator); Coy Cobb, CRA, COT; Sharon Turner, COT;
Mayo Clinic, Rochester, Mn: Brian Younge, MD (Principal Investigator); Jac-queline Leavitt, MD (Co-Principal Investigator); Rebecca Nielsen, LPN (Coordinator); Barbara Eickhoff, COT; James Garrity, MD; Jacqueline Lad-sten; Kathleen Lebarron; Thomas Link, BA; Jay Rostvold; Karen Weber
Medical College of Virginia, Richmond, Va: Warren Felton III, MD (Principal Investigator); Tammy Anderson (Coordinator); George Sanborn, MD;
Michigan State University, East Lansing, Mi: David Kaufman, DO (Principal Investigator); Eric Eggenberger, DO (Co-Principal Investigator); Suzanne Bickert, RN (Coordinator); Robert Granadier, MD; Sandra Holliday; Tho-mas Moore, MD;
State University of New York, Syracuse, NY: Deborah Friedman, MD (Principal Investigator); Patricia Jones (Coordinator); Thomas Bersani, MD;
University of California, San Francisco, Ca: Jonathan Horton, MD (Principal Investigator); Maeve Chang, BA (Coordinator); Lou Anne Aber, COA; Stu-art Seiff, MD
University of Florida, Gainesville, Fl: John Guy, MD (Principal Investigator); Z. Suzanne Zam, BS (Coordinator); Revonda Burke (Coordinator);
University of Illinois, Chicago, Il: James Goodwin (Principal Investigator); Allen Putterman, MD
University of Kentucky, Lexington, Ky: Robert Baker, MD (Principal Investiga-tor); Judy Beck (CoordinaInvestiga-tor); Michael Hanson; Toni Scoggins, COA
University of Maryland, Baltimore, Md: Shalom Kelman, MD (Principal Investi-gator); Charlotte Frank (Coordinator); Rani Kalsi;
University of Utah, Salt Lake City, Ut: Kathleen Digre, MD (Principal Investiga-tor); Jolyn Erickson (CoordinaInvestiga-tor); Terrell Blackburn (Coordinator, 1992– 1993, deceased); Richard Anderson, MD; Paul Langer, MD; Paula Morris; Sandra Osborn; Bhupendra Patel, MD; Sandra Staker; Judith Warner, MD
University of Virginia, Charlottesville, Va: Steven Newman, MD (Principal Inves-tigator); Christine Evans, COMT (Coordinator); Carolyn Harrell, COA; Helen Overstreet, RN; James Scott, RBP; Lillian Tyler, COA
West Virginia University, Morgantown, WV: John Linberg, MD (Principal Inves-tigator); Brian Ellis, MD (Principal InvesInves-tigator); Charlene Campbell, COT); Gordon McGregor;
William Beaumont Hospital, Royal Oak, Mi: Edward Cohn, MD (Principal Investigator); Kristi Cummings (Coordinator); Patricia Manatrey (Coordi-nator); Sara Casey; Robert Granadier, MD; Virginia Regan; David Roehr; Patricia Streasick
Resource Centers:
Chairman's Office, University of Maryland School of Medicine, Baltimore, Md (1992–2003): Shalom Kelman, MD (Study Chairman); Michael Elman, MD (Vice Chairman); Charlotte Frank, MS (Administrator);
Coordinating Center, University of Maryland School of Medicine, Baltimore, Md (1992–1998): Kay Dickersin, PhD (Director); FrankHooper, ScD (Deputy Director); Roberta Scherer, PhD (Project Coordinator); Barbara Crawley, MS; Michael Elman, MD (1992–1994); Cheryl Hiner; Lucy Howard; Patricia Langenberg, PhD; Olga Lurye; Janet Masiero, MBA; Robert McCarter, ScD; Sara Riedel; Michelle Sotos; Laureen Spioch; Joann Starr (1992–1994); Judy Urban; Mark Waring; P. David Wilson, PhD; Jie Zhu; Qi Zhu, MS;
Coordinating Center, Brown University School of Medicine, Providence, RI (1998– 2005); Kay Dickersin Ph.D.; Laureen Spioch (1998–2000); Jie Zhu (1998– 2004), Qi Zhu, MS (1998–2005).
Coordinating Center, Johns Hopkins Bloomberg School of Public Health, Baltimore, Md (2005–present): Kay Dickersin PhD.; Roberta Scherer, PhD. Co-Investi-gator
National Eye Institute, Bethesda, Md: Donald Everett, MA
Committees:
Data Analysis Committee: Barbara Crawley, MS; Kay Dickersin, PhD; Frank Hooper, ScD; Patricia Langenberg, PhD; Robert McCarter, ScD; Roberta Scherer, PhD; P. David Wilson, PhD
Data and Safety Monitoring Committee: Marian Fisher, PhD (Chair); Phil Aitken, MD; Roy Beck, MD; Andrea LaCroix, PhD; Simmons Lessell, MD; Reverend Kenneth MacLean; Kay Dickersin, PhD (ex officio); Michael Elman, MD (ex officio, 1992–1994); Donald Everett, MA (ex officio); Shalom Kelman, MD (ex officio)
Executive Committee: Shalom Kelman, MD (Chair); Kay Dickersin, PhD; Michael Elman, MD (1992–1994); Donald Everett, MA; Frank Hooper, ScD
Quality Assurance Committee: Frank Hooper, ScD, (Chair); Shalom Kelman, MD; Roberta Scherer, PhD;
Steering Committee: Shalom Kelman, MD (Chair); Kay Dickersin, PhD; Michael Elman, MD (1992–1994); Donald Everett, MA; Steven Feldon, MD;
Frank Hooper, ScD; David Kaufman, DO; Nancy J. Newman, MD; Z. Suzanne Zam, BS
Surgical Quality Assurance Committee: Robert Baker, MD; Steven Feldon, MD; Robert Granadier, MD; Frank Hooper, ScD; Shalom Kelman, MD; Gregory Kosmorsky, DO, Stuart R. Seiff, MD
Visual Field Committee: Steven E. Feldon, MD (Chair); Anthony Arnold, MD; Sophia Chung, MD; Kay Dickersin, PhD; Lenworth N. Johnson, MD; Joanne Katz, ScD; Gregory Kosmorsky, DO; Patricia Langenberg, PhD; Lori Levin, MPH; Steven A. Newman, MD; Roberta W. Scherer, PhD; P. David Wilson, PhD
References
1. Ischemic Optic Neuropathy Decompression Trial Research Group:
The Ischemic Optic Neuropathy Decompression Trial (IONDT): design and methods. Control Clin Trials 1998,
19:276-296.
2. Ischemic Optic Neuropathy Decompression Trial Research Group:
Optic nerve decompression surgery for nonarteritic anterior ischemic optic neuropathy (NAION) is not effective and may be harmful. JAMA 1995, 273:625-632.
3. Advanced Glaucoma Intervention Study investigators: Advanced glaucoma intervention study: 2. Visual field test scoring and reliability. Ophthalmology 1994, 101:1445-1455.
4. Katz J, Sommer A, Gaasterland D, Anderson DR: Comparison of analytic algorithms for detecting glaucomatous visual field loss. Arch Ophthalmol 1991, 109:1684-1689.
5. Leske MC, Heijl A, Hyman L, Bengtsson B: Early Manifest Glau-coma Trial: Design and baseline data. Ophthalmology 1999,
106:2144-53.
6. Musch DC, Lichter PR, Guire KE, Standardi CL, the CIGTS Study Group: The Collaborative Initial Glaucoma Treatment Study: study design, methods, and baseline characteristic of enrolled patients. Ophthalmology 1999, 106:653-662.
7. Keltner JL, Johnson CA, Beck RW, Cleary PA, Spurr JO, the Optic Neuritis Study Group: Quality control functions of the visual field reading center (VFRC) for the Optic Neuritis Study Group. Control Clin Trials 1995, 14:143-159.
8. Molino G, Marzuoli M, Molino F, Battista S, Bar F, Torchio M, Lavelle SM, Corless G, Cappello N: Validation of ICTERUS, a knowl-edge-based expert system for jaundice diagnosis. Method Inform Med 2000, 39:311-318.
9. Choplin NT, Edwards RP: Basic principles of visual field inter-pretation. In Visual Field Testing with the Humphrey Field Analyzer
SLACK Incorporated, Thorofare, NJ; 1995.
10. Hernandez C, Sancho JJ, Belmonte MA, Sierra C, Sanz F: Validation of the medical expert system RENOIR. Comput Biomed Res
1994, 27:456-71.
11. Sutton GC: How accurate is computer-aided diagnosis. Lancet
1989, 2(8668):905-908.
12. Hirsbrunner H-P, Fankhauser F, Jenni A, Fundhouser A: Evaluating a perimetric expert system: experience with Octosmart.
Graefes Arch Clin Exp Ophthalmol 1990, 228:237-241.
13. Werner EB, Saheb N, Thomas D: Variability of static visual threshold responses in patients with elevated IOPs. Arch Oph-thalmol 1982, 100:1627-1631.
14. Keltner JL, Johnson CA, Quigg JM, Cello KE, Kass MA, Gordon MO for the Ocular Hypertension Treatment Study Group: Confirma-tion of visual field abnormalities in the Ocular Hypertension Treatment Study. Arch Ophthalmol 2000, 118:1187-1194. 15. De la Rosa MG, Reyes JAA, Sierra MAG: Rapid assessment of the
visual field in glaucoma using an analysis based on multiple correlations. Graefes Arch Clin Exp Ophthalmol 1990, 228:387-391. 16. Katz J: Scoring systems for measuring progression of visual
field loss in clinical trials of glaucoma treatment. Ophthalmol-ogy 1999, 106:391-395.
17. McNaught AI, Crabb DP, Fitzke FW, Hitchings RA: Modelling series of visual fields to detect progression in normal-tension glau-coma. Graefes Arch Clin Exp Ophthalmol 1995, 233:750-755. 18. Keltner JL, Johnson CA, Spurr JO, Back RW, Optic Neuritis Study
expe-Publish with BioMed Central and every scientist can read your work free of charge
"BioMed Central will be the most significant development for disseminating the results of biomedical researc h in our lifetime."
Sir Paul Nurse, Cancer Research UK
Your research papers will be:
available free of charge to the entire biomedical community
peer reviewed and published immediately upon acceptance
cited in PubMed and archived on PubMed Central
yours — you keep the copyright
Submit your manuscript here:
http://www.biomedcentral.com/info/publishing_adv.asp
BioMedcentral
rience of the Optic Neuritis Treatment Trial. Arch Ophthalmol
1993, 111:231-234.
19. Keltner JL, Johnson CA, Cello KE, Edwards MA, Bandermann SE, Kass MA, Gordon MO for the Ocular Hypertension Study Group: Classi-fication of visual field abnormalitieis in the Ocular Hyperten-sion Treatment Study. Arch Ophthalmol 2003, 121:643-65. 20. Brigatti L, Hoffman D, Caprioli J: Neural networks to identify
glaucoma with structural and functional measurements. Am J Ophthalmol 1996, 121:511-521.
21. Goldbaum MH, Sample PA, Chan K, Williams J, Lee TW, Blumenthal E, Girkin CA, Zangwill LM, Bowd C, Sejnowski T, Weinreb RN:
Comparing Machine Learning Classifiers for Diagnosing Glaucoma from Standard Automated Perimetry. Invest Oph-thalmol Vis Sci 2002, 43:162-169.
22. Keating D, Mutlukan E, Evans A, McGarvie J, Damato B: A back propagation neural network for the classification of visual field data. Phys Med Biol 1993, 38:1263-1270.
23. Kelman SE, Perell HF, D'Autrechy L, Scott RJ: A neural network can differentiate glaucoma and optic neuropathy visual fields through pattern recognition. In Perimetry Update 1990/91. Pro-ceedings of the Sixth International Perimetric Society Meeting, Malmo, Swe-den, June 17–20, 1990 Edited by: Mills RP, Heijl A. Amsterdam/New York: Kugler Publications; 1991:287-290.
24. Henson DB, Spenceley SE, Bull DR: Spatial classification of glau-comatous visual field loss. Br J Ophthalmol 1996, 80:526-531. 25. Feldon SE: Computerized expert system for evaluation of
automated visual fields from the Ischemic Optic Neuropathy Decompression Trial: Methods, baseline fields, and six-month longitudinal follow-up. Trans Am Ophthalmol Soc 2004,
102:269-303.
Pre-publication history
The pre-publication history for this paper can be accessed here: