Abnormality Detection in Brain CT Images
Using Support Vector Machine
Bhavna Sharma and Priyanka Mitra
Department of Computer Science& Engineering Jaipur Engineering College & Research Centre, Jaipur
[email protected],[email protected]
Abstract
Automated detection of the abnormalities in brain image analysis is very important and it is prerequisite for planning and treatment of the disease. Computed tomography scan is an imaging technique used for studying brain images. Classification of brain images is important in order to distinguish between normal brain images and those having the abnormalities in brain like hematomas, tumor, edema, concussion etc. The proposed automated method identifies the abnormalities in brain CT images and classifies them using support vector machine. The proposed method consists of three important phases, First phase is preprocessing, second phase consists of feature extraction and final phase is classification. In the first phase preprocessing is performed on brain CT images to remove artifacts and noise. In second phase features are extracted from brain CT images using gray level co-occurrence matrix (GLCM). In the final stage, extracted features are fed as input to SVM classifier with different kernel functions that classifies the images into normal and abnormal with different accuracy levels.
Keywords – Computed tomography scan (CT scan), gray level co-occurrence matrix (GLCM), Support vector machine (SVM), Hematomas
I.
INTRODUCTION
Imaging is an essential tool of the medical science to visualize the anatomical structures of the human body [1]. Medical image analysis for identification and classification is an important task for many applications [2]. There are various techniques available for Medical imaging for brain scan like MRI, CT scan, PET scan which are used for extracting information by the radiologist. Computer aided diagnosis is gaining significant importance in image analysis. An automated image analysis system to detect the abnormalities in the brain CT scan images assists the physicians for making better decisions [3]. This system is also helpful for technicians and medical students. Support vector machine (SVM) is a data classification technique that is usually based on training and testing. Each training set instance has a target value and many attributes. SVM main purpose is to produce a
Volume 2, 2018, Pages 74–80
generalized model to predict and classify data instances target values in testing sets given only the attributes alone. Support vector machine based classification is done by many researchers [4]. Modification of conventional SVM is also proposed and has been compared with AdaBoost, ANN, Bayesian Network and many other classifiers [5]. Many researchers have used hybrid approaches such as combination of wavelets, K-NN and SVM for classifying the abnormal and the normal images [6].These Hybrid approaches proved to be robust, fast, accurate and reliable in the detection [7].
II.
METOHODOLOGY
The proposed automated system consists of three stages. Methodology is shown in Fig.1. In first stage Preprocessing is done to remove noise and other artifacts. In second stage features are extracted from brain CT images. In the final stage, extracted features are fed as input to Binary classifier, Support Vector Machine (SVM). For brain CT scan images two classes have been defined i.e. class 0 for normal images and class 1 for abnormal images.
Fig.1 Steps in Abnormality Detection.
(a)
Preprocessing
Fig.2 (a) Normal brain image (b) Abnormal brain image
Fig.3. Steps to extract the brain and to remove all artifacts
(b) Feature Extraction
Features are the characteristics of the objects of interests. They are used as inputs to classifiers that assign them to the class that they represent. We extracted the following nine features from segmented image. Intensity based features are first order statistics depends only on individual pixel values of image [9].
• Mean is average value of an array
µ = "!∑"%&!𝐼% (1)
• Variance It is one of several descriptors of a probability distribution, describing how far the numbers lie from the mean
σ2
=
!"∑ (𝐼% − µ) , "
%&! (2)
• Skewness is a measure of the asymmetry of the data around the sample mean.
Skewness
=
∑ (-./
.01 23)4
("2!)54
(3)
Kurtosis =∑ (-.
/
.01 23)6
("2!)56
(4)
where µ is the mean, σ is the standard deviation, N is the no of data points.
Texture features are described by Gray Level Cooccurrence Matrix (GLCM) that is a matrix of relative frequencies Pθ,d(i, j). It describes how frequently two pixels with gray-levels i, j appear in the
window separated by a distance d in direction θ. Here P(i,j) is the [i,j]th entry in a gray-tone spatial
dependence matrix, and Ng is the number of distinct gray-levels in the quantized image. All features
obtained from GLCM are functions of the distance d and the orientation θ. Thus, if an image is rotated, the values of the features will be different. In practice, for each d the resulting values for the four directions are averaged out. Five co-occurrence matrices are constructed in four spatial orientations horizontal, right diagonal, vertical and left diagonal (0°,45°,90°,135°). A fifth matrix is constructed as the mean of the preceding four matrices. This will generate texture features that will be rotation invariant:
• Contrast is measure of local level variations which takes high values for image of high contrast.
Contrast=∑ |𝑖 − 𝑗|,𝐿𝑜𝑔 𝑃(𝑖 − 𝑗)
%,? (5)
• Inverse Difference Moment (Homogeneity) is a measure that takes high values for low-contrast images.
Homogeneity=
∑
@(%,?)!A|%2?|
%,? (6)
• Angular Second Moment (ASM) is a feature that measures the smoothness of the image.
ASM=∑ 𝑃(𝑖, 𝑗),
%,?
(7)
• Correlation Coefficient is a measure of how a pixel is correlated to its neighbor over the whole image.
CorrCoeff=
∑
(BC)D(B,C)2µEµFGEGF
B,C (8)
Where µx, µy, σx, σy are the mean and standard deviation of px, py,the partial probability
density functions respectively.
• Entropy is a measure of randomness and takes low values for smooth images.
Entropy=-∑ ∑ 𝑃(𝑖, 𝑗)𝑙𝑜𝑔𝑃(𝑖, 𝑗)% ? (9)
(c) Classification
both the input and output. Second is construction of an optimal hyperplane or a surface to separate the training data by minimizing the margin between the vectors. The training ends with the definition of a decision surface that divides the space into two subspaces.
III.
EXPERIMENTAL RESULT & DISCUSSIONS
The entire methods are implemented in MATLAB on Window 7 and the experimental data consists of 150 CT images of brain. The selected images are mixture of normal and abnormal images and of same quality. The images were partitioned arbitrarily into training set; testing set with equal number of images i.e. 75 images for training 75 for testing. Above mentioned features are extracted from these images and are passed as input to SVM and classification performance is measured.
True Positive (TP) is when normal cases are correctly classified as normal. True Negative (TN) is when the abnormal cases are correctly classified. False Positive (FP) is when normal cases are classified as abnormal. False Negative (FN) is when abnormal cases are classified as normal. Sensitivity measures the ability of the method to identify abnormal cases. Specificity measures the ability of the method to identify normal cases. Accuracy is the proportion of correctly diagnosed cases from the total number of cases.
Sensitivity (Sn) = ID
(IDAJK) * 100% (10)
Specificity (Sp) = (IKAJD) IK * 100% (11)
Accuracy(A.C.) = (IDAIK)
(IDAIKAJDAJK)* 100% (12)
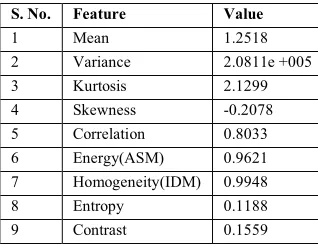
Table 1.1: Features of brain CT image
S. No. Feature Value
1 Mean 1.2518
2 Variance 2.0811e +005
3 Kurtosis 2.1299
4 Skewness -0.2078
5 Correlation 0.8033
6 Energy(ASM) 0.9621
7 Homogeneity(IDM) 0.9948
8 Entropy 0.1188
9 Contrast 0.1559
Table 1.2: Classification performances of the SVM classifier for 150 images (75 for training and 75 for testing)
SVM kernel Sn Sp A.C
Linear 88% 84% 86%
RBF 100% 96% 98%
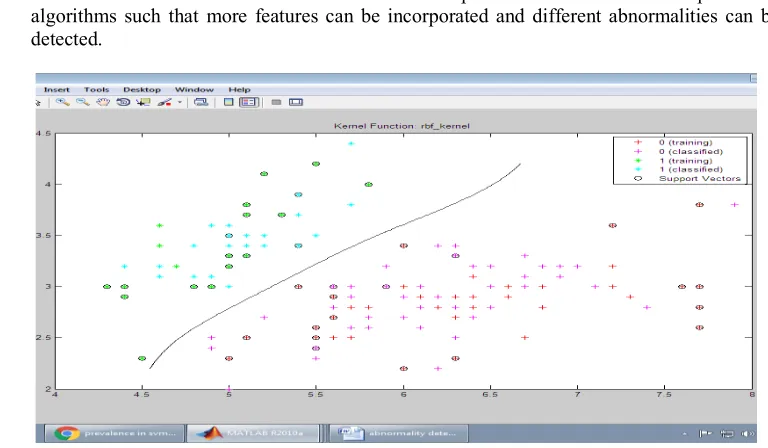
Table 1.1 shows feature extracted from image shown in Fig. 2(b). All 9 features of 150 images are extracted and their values are fed to SVM. Table 1.2 shows the classification performance parameters. Normal and abnormal images are classified by SVM with different kernel functions with different level of accuracy. The major strength of SVM is that the training of data is relatively easy. It scales relatively well to high dimensional data and the trade-off between classifier complexity and error can be controlled explicitly. It is clear from the table that RBF kernel function gives better classification performance than the others.
IV.
CONCLUSION
We conclude that automated system with GLCM method and using SVM classifier with RBF kernel gives 98% level of accuracy. This would be highly useful as a diagnostic tool for radiologists in the automated classification of brain CT images into normal and abnormal. The proposed system is for classifying images into two classes only i.e. normal and abnormal images.
Future scope of the automated system is:
• We will focus on multiple-class classifications for brain CT images and detection for various abnormalities like hemorrhage, edema, tumor etc.
• To find out the most efficient classifier we will compare SVM with different deep learning algorithms such that more features can be incorporated and different abnormalities can be detected.
Fig.4. Training patterns and classified patterns with support vectors using rbf kernel
REFERENCES
[1] Chaurasia B D (2008) Human Anatomy: Regional & Applied Dissection & clinical Vol 3: Head, Neck & Brain, CBS Publishers.
[2] Dhawan A P , Huang H K , Kim D S (2008) Principles and advanced methods in medical imaging and image analysis, World Scientific.
[4] Kharrat A ,Gasmi K, Mohamed B (2010) A Hybrid Approach for Automatic Classification of Brain MRI Using Genetic Algorithm and Support Vector Machine. Leonardo Journal of Sciences 9(17):71-82.
[5] Sandeep C, Patnaik L, Jaganathan (2006) Classification of MR brain images using wavelets as input to SVM and neural network. Biomedical signal processing and control. 1:86-92.
[6] El-Sayed A,El-Dahshan, Abdel-Badeeh M.Salem and Tamer H.Younis (2009) A hybrid technique for automatic MRI brain image Classification. Informatica, LIV, no. 1.
[7] Smith S M (2002) Fast robust automated brain extraction. Human Brain Mapping,17: 143-155. [8] Sharma B , Venugopalan K (2012). Automated Segmentation of Brain CT Images. International
Journal of Computer Applications, 40(10):1-4.
[9] Haralick, M. Robert, K. Shanmugam (1973). Textural Features for Image Classification. IEEE Transactions on Systems, Man and Cybernetics, 3(6): 610 – 621.