ISSN: 2372-4862 (Print), 2372-4870 (Online) Copyright © The Author(s). 2014. All Rights Reserved. Published by American Research Institute for Policy Development DOI: 10.15640/jble.v2n2a1 URL: http://dx.doi.org/10.15640/jble.v2n2a1
Governance Diversity*
Burcin Col1
Abstract
This paper analyzes the intra-industry dispersionof firms’ governance structures. We build a model that relates firm governance to product market competition and show that industry competitiveness determines the dispersion in the governance choices of firms. Using a sample of U.S. governance scores provided by ISS, we find that governance diversity increases with the industry concentration and the relation is non-linear.
1. Introduction
Anecdotal evidence suggests that firms in some industries have very similar governance practices, whereas firms in other industries differ greatly in their governance structures. Among practitioners, it is widely held that industry factors are important in how firms’ structure their governance choice. A leading governance scores provider, Institutional Shareholder Services (henceforth ISS), provides the governance scores for industry peers as well as firm’s own and consulting firms strongly adviseto consider industry peers’ governance as they provide strategies on governance of individual companies.
In academics, while researchers explore the determinants of corporate governance, they generally account for industry fixed effects by using industry dummies.However, this approach does not tell us how industry affects firm governance, or why governance structures vary so widely across firms within an industry.
*Burcin Col, Lubin School of Business, Pace University, New York, NY, 10038, USA.
E-mail: [email protected] Phone:+1-212-618-6401.
We thus examine the following unresolved questions: How widely dispersed are corporate governance practices within industries? Why do these distributions vary across industries? Can we explain this variation with certain industry characteristics?
We start by broadly analyzing inter-and intra-industry variation in firm governance. We regress firm-level governance on industry fixed effects and find that they explain only a little fraction, specifically 4.39% of variation in governance. However, when we include firm variables together with the industry fixed effects, the explained portion of variation rises to 12.22%. This shows that a lot of within-industry variation is not explained. Our objective is to fill this gap by directly examining how intra-industry variation in governance relates to industry factors. On one hand, by definition, governance is more diverse if firm characteristics are more diverse or there are more companies in a particular industry or a country. We show that dispersion of firm factors alone does not explain within-industry variation in governance.
Given the relative insignificance of industry fixed effects in explaining firm governance and the practical importance of peer governance, we examine whether a specific industry factor, that is, product market competition can account for some of the variation observed within industries. We build a model that relates firm governance to product market competition and show that industry competitiveness determines the dispersion in the governance choices of firms. Using a sample of US governance scores provided by the ISS, we find that governance diversity increases with the industry concentration and the relation is non-linear.
Since each firm is in the same situation, they will adopt better but similar governance structures and there will be less dispersion. Hence, as industry competition increases, the governance variation of firms within that industry becomes smaller. In cases of extremely concentrated markets with very few players, however, firms can easily observe and adopt peer governance, which introduces an inverse U-shaped relation between governance diversity and industry competition.
We use two different methods to empirically test our hypothesis. First we regress a measure of dispersion for each industry on the industry competition and other possible industry-level determinants of governance diversity. This helps us explain within industry variation of firm governance. Next, because our hypothesis concerns differences in governance variation, we use Glejser’s heteroskedasticity tests in our analysis. There are three main advantages to using Geljser’s tests. First, these tests jointly consider the determinants of firm-level governance as well as the determinants of the unexplained cross-sectional variation at the industry level. Therefore, they help us simultaneously estimate the determinants of a firm’s governance and the industryfactors that explain governance diversity within industries. Second, these heteroskedasticity tests help us explorethe determinants of variation across firms within the whole population. Hence we can claim that variance of residual governance decreases as the industry competition increases. This holds within industries as well as the whole population. Finally, our results for the first set of tests may be subject to our choice of industry classification. Glejser’s heteroskedasticity tests explore variation at firm level and hence independent of any industry classification. We also address this concern in robustness section by running our first set of tests using different industry classification (that is usingSIC instead of NAICS).
Exploring the diversity in governance is especially important as the arguments surge on the fact that globalization should lead to a convergence towards a common set of the most efficient firm governance practices. Studies have focused on an international sample of firms and have shown evidence for convergence to the U.S. standards.2 Within the U.S. firms however, whether firm governance practices converge or diverge has not yet been explored. Thus, this study also sheds a light on the subject by focusing on the intra-industry dispersion of the U.S. firms’ governance practices.
The paper is organized as follows. Section 2 reviews the literature that relates industry organization structure to governance. Section 3presents the model and proposes our hypotheses. Section 4describes the data and empirical methodology. Section 5presents our empirical findings. Section 6 provides robustness checks and thefinalsection concludes.
2. Related Literature
The relation between industry competition and corporate governance has received a great interest. The question has been studied theoretically and empirically by a number of studies. Mostly, these studies consider corporate governance as an input factor of production and, as a result, a firm’s governance decision affects the price-quantity decisions, and hence the profits of not only firm’s own but also those of its peers and the whole industry. For example, Bris and Brisley (2007) show that corporate governance reform by a firm in an industry can increase profits for the competitors even if they do not improve their governance. This is because firms tend to overproduce in imperfectly competitive markets when the governance rules are not stringent. When corporate governance reform induces reforming firm to produce less, competitors can take advantage of it by producing more and increasing their profits. As a result, the profits of the whole industry can benefit from an improvement in governance of a single firm.
Based on the same argument that weaker governance allows for more production, Kadyrzhanova (2005) develops a theory of predation and shows that in imperfectly competitive industries the industry leaders tend to have weaker governance than laggards, which she calls as “leader-bias in corporate governance”.
Due to this bias, the industry leaders can produce more and hence maintain their lead and secure monopoly rents by driving rivals out of the market. She empirically documents the existence of the bias for a sample of publicly traded companies in the U.S. Allen, Carletti and Marquez (2007) also develop a model of stakeholder governance in the context of an imperfectly competitive product market. They show that when firms put weight on stakeholders other than shareholders, this concern leads to a softening of competition so firms can charge higher prices and their profits as well as the total firm value can be increased. Since the firm value is higher, even the shareholders may want to put in place governance structures that commit them to adopt a concern for other stakeholders. These studies suggest that in imperfectly competitive markets, firms can voluntarily choose to adopt weaker governance strategies as weaker governance provides them advantages in the product market.
Some other studies that consider governance an interdependent choice as a reaction to industry peers include Bagnoli and Watts (2007) and Cheng (2008). These studies model governance through earnings manipulation. Bagnoli and Watts (2007) show that through biasing their financial reports and understating their costs of production competitors can start price wars. This bias leads to lower total industry production, a higher price and greater profits. Cheng (2008), on the other hand, follows a different approach and uses relative performance evaluations instead of product market as the channel through which managers compete. In the Cheng’s model, weak governance of one firm “spills over” and amplifies the incentive for the competing manager to counterbalance the aggressive manipulation with his own manipulation.
In the same spirit with the above studies, we propose a simple model of industry equilibrium, which endogenizes firm governance variation and links firm governance decisions to broader equilibrium forces. The model is illustrated in the next section. Our model implies that firms make their individual governance decisions in reference to the governance decisions of their industry peers, and the equilibrium outcomes imply intra-industry diversity of governance rather than industry-wide targets.
Our empirical analysis helps us test the hypotheses regarding governance diversity that are implied by our model, and more generally, they can be considered as empirical tests of industry-equilibrium governance models of the studies discussed above.
As one of the most important implications of the above studies, a natural question of whether industry competition matters in governance-value relationship arises. A number of studies empirically investigate this question. Giroud and Mueller (2008a, 2008b) show that the value effect of governance is not symmetric across competitive and non-competitive industries. In the former study, they argue that while firms in non-competitive industries experience a substantial drop in performance after passing laws that weaken governance, firms in competitive industries remain virtually unaffected. In the latter study, they find that the effects of good governance on long-horizon stock returns, firm value and operating performance are small and insignificant in competitive industries, whereas they are large in non-competitive industries. The argument is that managerial slack cannot survive in competitive industries, thus there will be no need to adopt additional governance provisions.3 On
the other hand, in non-competitive industries, lack of competitive pressure fails to enforce discipline on managers; hence these firms can benefit more from improving governance. These arguments can also explain why there is more diversity among governance of firms in non-competitive industries. As there are more value benefits to impose stricter governance rules in non-competitive markets, some firms will choose to improve; hence we will see some firms with extremely good governance structures. At the same time, as our theory discussed above states, there are product market advantages of weak governance in non-competitive industries; therefore when some firms choose to take advantage of it we will also see some firms with extremely weak governance structures. In competitive industries, since there are no such product market opportunities, firms will not chose to adopt weak governance, and since there is no value to it there will not be any firm with extremely good governance practices either; thus competitive pressures will enforce more homogenous governance structures.
Other studies also investigate governance-performance relation by taking into account industry competition.
3 This argument is consistent with earlier economic studies of Alchian (1950), Friedman (1953) and
Kadyrzhanova and Rhodes-Kropf (2007) show that anti-takeover provisions (ATP), which allow for more managerial entrenchment and are indicators of bad governance, have greater value and more likely to be adopted in more concentrated industries4.In another study, John and Kadyrzhanova (2008) use ATPs for a large sample of US companies and find that for an individual firm good governance matter the most when peers have good governance. Although their peer definition is based on geographic proximity rather than operating in the same industry, their study also shows evidence that firms’ governance decisions are interrelated.
Overall, these studies suggest that in order to understand the governance-performance relationship, the literature needs to go beyond the standard single-firm assumptions and start considering the firm’s peers’ governance structures. Empirical studies on corporate governance could benefit from including measures of industry competition in their regressions and efforts to improve governance could benefit from focusing on firms in non-competitive industries.
Our findings agree with the findings of most of the studies above. We show that industry’s competitiveness indeed matters and should be accounted for when analyzing firms’ governance choices. We contribute to the industry competition and governance literature by showing that industry’s competitiveness matter not only to explain the different governance structures across industries but also to explain the variation of governance structures within an industry.
3. Hypotheses Development
3.1.Equilibrium Model of Governance
We consider a two-stage game in an industry with two firms, i = 1, 2, each with a risk-neutral owner and a risk-neutral manager.5 In the first stage, knowing the true probability distributions of demand, the owners of each firm whose objective is to maximize the expected profits of the firm, that is, shareholders, simultaneously chose governance.
4 On the other hand, Cremers, Nair and Peyer (2007) find that firms in more competitive industries
have more takeover defenses. However, their findings only hold for relationship (or durable goods) industries.
5 Our model follows from Fershtman and Judd (1987) analysis and is analogous to the models used by
In the second stage, the competing managers play an oligopoly game, with each firm’s manager knowing his own governance as well as that of the competing firm.6 Realized demand and costs will be perfectly known and common knowledge
among managers. Finally, the owners observe the costs, sales and profits of the firm at the end.7
Firms compete a la Cournot with a linear product demand function of where is the price, is the total industry output i.e., . We assume that managers of the firms know the demand parameters a and b at the beginning of stage two, however, at stage one they are unknown to all. 8
Managers will be given incentive to maximize , where is realized profits, is the unit cost of production, is the quantity sold and
i= where is governance. Note that this is a very general form and it is
equivalent to maximizing a linear combination of profits and sales,
We use this equivalent linear contract where the manager maximizes the linear combination of profits and sales.9Since Jensen and Meckling (1976), it became a standard to represent manager’s objective as maximizing a linear combination of profits and private benefits. Our model is analogous to the standard literature as in our model, due to their empire-building nature; managers derive private benefits of control through sales maximization. The idea that managers are empire-builders is introduced by Jensen (1986) and has been documented empirically by a number of studies including Donaldson (1984) and Murphy (1985).
6 Repeated play would cause managers to learn one another’s governance even if they were not initially
common-knowledge. We assume single-shot game with common-knowledge instead of repeated play due to intractability and multiple-equilibria problems in repeated games, which is beyond the scope of this paper.
7 Governance decisions are rational in the sense that shareholders choose monitoring intensity to
maximize expected profits and correctly anticipate the second-stage equilibrium.
8 This assumption is crucial as it gives managers a role as observers of these variables. Also, if we had
no uncertainty, we would end-up with quantity-indexed contracts, which would force the regular Cournot outcome.
9 will not be manager’s compensation, he is actually paid with > 0. Since he is
In our model, empire-building preferences can arise from the fact that managers care about revenues more than shareholders do (they overweight revenues in their objective). This idea received great attention in the literature. Murphy (1985) documents that changes in managerial compensation are positively related to changes in revenues. Also, Hart (2001) states that higher revenues increase the extent to which managers can extract perks, i.e. non-pecuniary benefits like “fancy offices, private jets etc. that are attractive to management but are of no interest to shareholders”.
Governance choices, , is the extent which shareholders induce profit-maximizing behavior on managers. For example, if shareholders give enough discretion to the manager, they can simply approve the manager’s proposal of a production plant, this implies <1. However, if not, they would examine the plan carefully and make sure that it is implemented on the right scale such that there is no overproduction, i.e., =1.
In our model, costs of implementing better governance technology comes from product market costs, i.e., stronger governance leads to loss of potential market shares. Exogenous costs of governance such as fees paid to auditors, other monitoring costs etc. are ignored since they are minor compared to product market costs.10
3.1. 1. Oligopolistic Competition: A Duopoly Case
Firms have different marginal costs of production i.e., , > 0 in a homogeneous product, quantity-setting oligopoly. Assume and are known perfectly by both owners and managers in both stages. In stage two, the manager of each firm observes a, b, , , and , and chooses to maximize .
(1)
10 We also derived our results assuming an exogenous linear cost of governance, however, it did not
Given and , Cournot reaction functions are
for , =1,2 (2)
Stage-two equilibrium quantity and profit are
(3)
(4)
In stage one, firm’s owner chooses its governance technology, , while maximizing the expected profit from stage-two equilibrium11. Hence, the governance reaction functions are
(5)
Theorem1. In a Cournot duopoly equilibrium, where a, b, , are known at
stage one and both firms produce positive quantities, the equilibrium governance choice of firms is
for , =1,2 (6)
Equation (6) implies that in oligopolistic markets, firms deviate from full monitoring intensity, in other words, they weaken governance, in order to gain a competitive advantage in the market. Profit-maximizing owners will almost never impose their managers to maximize profits when each firm’s manager is aware of the competitor’s governance choice.
11 The owner actually maximizes his expected profit net of manager’s opportunity costs. Since we
This is because if one firm’s manager is allowed to maximize the sales instead of profits, she will become an aggressive seller. When this gets communicated to the competitor (could also be through repeated play), it gives each firm’s owner an opportunity to be a Stackelberg leader vis-à-vis the other firm’s manager when the owner decides on the governance technology. This dual leadership causes both owners to let their managers become more aggressive sellers, leading both owners to choose <1. Therefore, we can claim that imperfect product market competition is the source of limitation for shareholders’ control on managers.
In a duopoly where the number of the firms is fixed, we can proxy more competition through market shares. In a more competitive industry, the two firms will have similar market shares. Consider the case with equal market shares where firms sell equal amounts of output. Using equation (3);
implies
Assuming equal costs, , equal market shares imply . Hence, in more competitive industries where firms have similar market shares, firms practice more similar governance.
3.1. 2. Many Firms Case
We showed that in a duopoly, owners choose to deviate from strict profit-maximization by imposing less monitoring as a reaction to the competitor’s deviation. Moreover, proxied by equality of the market shares, the industry competitiveness is important in determining the change in governance of a firm as a reaction to the change in competitor’s governance; there is less variation among governance structures in more competitive industries. Next question is whether the above results can be generalized to industries in which many firms operate.
(7)
Taking partial derivative of firm’s own governance technology, , with
respect to that of competitor’s, , we get;
since n >1 (8)
Equation (8) implies divergence.12
3.1. 3. Perfect Competition
We assume many firms operating with unknown but perfectly correlated uniform costs. Consider n firms where each firm’s manager has the objective function same as (1)
The reaction function is
where , (9)
Theorem2. As , and the costs are uncertain and equal, ,
implying firms practice best governance in perfectly competitive market.
Stage-one equilibrium for ,
12 Note that the effect peer governance on firm governance varies with the number of firms competing
(10)
where and is the variance of c.
As , Theorem3 holds.
In the case of many firms operating in an industry, as the industry becomes less concentrated, the deviations from employing a strong governance technology disappear. Owners impose strict profit-maximization through a complete governance technology. Thus we obtain;
Corollary. Firms operating in more competitive industries practice better governance.
This is intuitively appealing because according to the traditional theory of perfect competition with free entry, firms cannot afford to do anything other than be profit-maximizers. Therefore, in perfect competition case firms converge on governance technology,, which requires the strongest monitoring intensity and hence strict profit-maximization.
3.2. Implications
Due to this interaction, an individual firm’s governance choice is affected by the rival’s governance, and hence the equilibrium governance of firms should be analyzed in the context of the industry structure they operate.
In industries where managers follow aggressive product market strategies, firms can gain a competitive advantage by worsening governance and thereby producing and selling more than in perfect corporate control case. Hence, as long as a firm can take advantage of the potential market shares, it may choose not to improve the governance structure more than necessary. As some firms choose weaker governance to take advantage of the opportunities in the product market, while the others still may choose to adopt better practices as it is valued by the stockholders, there will be a wide dispersion of governance structures in more concentrated industries. On the other hand, in the case of perfect competition, there are not as many market opportunities; hence firms cannot increase their market shares even when given enough discretion to their managers. Since each firm is in the same situation in the perfect competition case, they will adopt better and similar governance structures leading to less dispersion. Thus we claim;
Hypothesis. Corporate governance is more diverse in imperfectly competitive markets.
In the cases of extremely concentrated markets with only a few firms such as an oligopoly, it is easier for firms to observe and adopt similar governance practices vis-à-vis their peers, introducing a possible non-linearity to the relation.In the next section, we describe the data and the empirical methodology designed to test the model implications.
4. DataandEmpirical Design
4.1. Data
4.1.1. Corporate Governance Attributes and the Construction of Governance Index
ISS started providing Corporate Governance Quotient (CGQ) in 2002 for U.S. companies that are included in the Standard and Poor’s 500 index, the Standard and Poor’s SmallCap 600 index and the Russell 3000 index.13
13 Firms that have not filed a proxy in the last 18 months are excluded as well as the firms that are not
By examiningfirms’ regulatory filings, annual reports and websites, the ISSdetermines whether a firm is complying with each of 64 minimally accepted governance attributes and rates them accordingly. Firms can only change their ratings by making changes to their governance structures and publicly disclosing them. The governance attributes for U.S. firms are compiled and provided semiannually.
Following, Aggarwal et al. (2007), we use 44 of these attributes to calculate a governance index, GOV. The 44 attributes selected cover four-broad sub-categories:
1) Board. These twenty-five attributes attempt to capture the aspects of the
functioning of the board of directors that relate to board independence, composition of committees, size, transparency, and how work is conducted.
2) Audit. They use three attributes that consider questions regarding the independence
of the audit committee and the role of auditors.
3) Anti-takeover. They include six attributes that are from the firm’s charter and bylaws
and refer to dual-class structure, role of shareholders, poison pill and blank check preferred.
4) Compensation and Ownership. Remaining ten attributes deal with executive and
director compensation on issues related to options, stock ownership and loans, and how these types of compensation are determined and monitored.14
GOV assigns a value of one to the governance attribute if the company meets minimally acceptable standard on that attribute or zero otherwise. For each firm, the values are added and the sum is divided by total number of non-missing attributes. The index is expressed as a percentage, for example, if a firm satisfies all 44 governance attributes, the index is equal to 100 %. If an attribute is missing then the attribute is eliminated and the value represents the percentage of non-missing attributes that the firm satisfies.
We calculate governance scores based on semiannual compilings of the ISS for years from 2003 through 2006. Our sample has, on average, 5,330 firms for each time period. GOV scores range between 22.85 % and 92.85 % with an average of 58.12%. The summary statistics for the scores are reported in Table I.
Panel A reports descriptive statistics of GOV for each industry classified by 2-digit NAICS.15 The smallest number of firms within an industry is 6 (Management of
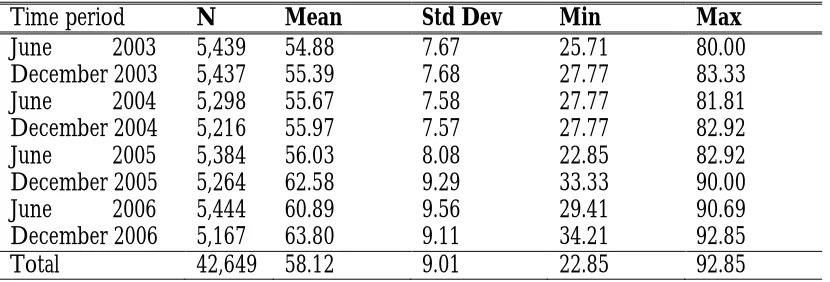
Enterprises) and the largest is 16,656 (Manufacturing). The industry average GOVs range between 55.50 (Other Services) and 64.21 (Utilities). The standard deviations of the scores within industry range between 3.61 (Management of Enterprises) and 9.94 (Real Estate). Panel B reports descriptive statistics for each semi-annual sample. The average GOV increases over time from 54.88 to 63.80. Standard deviations and maximum scores are also higher for the later periods indicating that the governance diversity increased over time.
Next, we calculate the industry-specific governance diversity measures: the spread of governance (SP_GOV), variance of governance (VAR_GOV), normalized standard deviation of governance (Log(SD_GOV)) and the coefficient of variation in governance (CV_GOV). Table II reports the summary statistics for these measures calculated at the 4-digit NAICS level. According to this industry classification, in our sample, the number of firms within an industry range from 2 to 300 with a mean of 21 firms.16We also use different industry classifications for robustness checks and
show that our findings are not specific to one type of industry classification. SP_GOV ranges from 0 to 52.52 with an average of 24.01 and VAR_GOV ranges from 0 to 594.33 with an average of 66.39. Normalized dispersion measure, Log (SD_GOV) has a minimum of -3.18, a maximum of 3.19 and an average of 1.94. Finally, CV_GOV ranges from 0 to 0.45 and has a mean of 0.13.
4.1.2. Concentration Data
Our main measure of industry concentration is four-firm domestic concentration ratio, CR, which is calculated as the ratio of the sales of the top four firms in an industry to total industry sales. The Bureau of Census reports the CR every five years. We use concentration ratios from 2002, the most recent observation given our time series sample. Concentration data is provided based on NAICS classification rather than SIC starting from 1997. Hence, we take CR ratios based on 4-digit NAICS for our main tests.
15 We prefer NAICS classification over SIC not only because it is more general but also for consistency;
we use 4-digit NAICS classification in our main empirical tests. We manually assign NAICS for every firm governance observation based on the industry to which firms’ main operations correspond.
In order to make sure that our results are not specific to the industry concentration measure used, we also include another measure of industry concentration in our tests; the Herfindahl-Hirschman Index (HHI). The major benefit of the Herfindahl Index with respect to the concentration ratio is that it gives more weight to larger firms. This is due to the fact that the market shares are squared prior to being summed, putting additional weight to firms with larger size. To illustrate this point more clearly, assume the four largest companies produce 80% of the industry output, the remaining 20% is equally divided among 10 firms. Consider the following two cases.
Case 1: All four firms produce 20 % each, and
Case 2: One firm produces 65 % while other three produce 5 % each.
The four-firm domestic concentration ratio would equal 80 % for both case 1 and case 2. However, it is clear that in the first case market environment is highly competitive whereas in the second case it is close to a monopoly. The Herfindahl index for these two cases is able to differentiate the difference between competitiveness of each:
Case 1: Herfindahl index = 4 * (0.20)2 + 10* (0.02)2= 0.164
Case 2: Herfindahl index = (0.65)2 + 3 * (0.05)2 + 10* (0.02)2= 0.434
Hence, by running our tests using the Herfindahl Index we are not only establishing robustness in our results, but also considering large firm effects, which were ignored by the CR.
The Bureau of Census reports HHI for only manufacturing industries. We calculate the Herfindahl Index, COMP_HERF, for all industries, using COMPUSTAT data in the following way;
,
where si is the market share for firm i, and
N
is the number of firms in thatWe use Sales (Item 12) and calculate a company’s market share as the ratio of sales of that company to the total sales in that industry. In the robustness section, we repeat our analysis using COMP_HERF, which is calculated with respect to 4-digit SIC classification. At this point, we should note that using COMPUSTAT data could be problematic to calculate market shares, because COMPUSTAT only considers public companies. This is likely to introduce selection bias and classification error. We refrain to use this measure as long as we have an alternative. Thus, we do not use HERF_COMP for our main tests but only in the robustness section to incorporate alternative industry classifications. Summary statistics for the concentration measures, CR and HHI corresponding to industries classified according to 4-digit NAICS are reported in Panel B of Table II as of percentages. Four-firm concentration ratio, CR, has a mean of 26.56 and ranges between 1.7 and 90.9. The Herfindahl Index, HHI, on the other hand, has a mean of 4.12and ranges between 0.09 and 23.23.
4.1.3. Control Variables
In order to isolate the effects of industry competition on firms’ corporate governance practices, we control for industry measures of leverage, asset intangibility, free cash flows, size, investment opportunities and growth opportunities. These should account for other potential reasons why firms’ governance practices may exhibit differences. We calculate the industry proxy as the average of the corresponding firm’s proxy in each industry. The descriptive statistics for firms’ proxies and industry proxies are reported in Table II, Panel A and Panel B respectively. The data are obtained from COMPUSTAT. Next, we describe these controls and provide a rationale for their inclusion in our analysis. Firms with more leverage may be less subject to agency costs due to the role of debt in committing the payout of free cash flows to investors (Grossman and Hart (1982), Jensen (1986)). Hence, firms’ choice of governance may differ depending on their leverage levels. Long-term debt (Item 9) scaled by assets (Item 6), LTD, is used to control for differences in leverage.
Firms with higher cash flows can be more subject to agency costs of free cash flows (Jensen (1986)). Therefore, we include cash (Item 162) scaled by assets (Item 6), defined as CASH, to account for differences in governance structures.
Firm size, SIZE, is defined as logarithm of assets (Item 6). Larger firms tend to attract more attention and may be under great scrutiny by the public thus, size may affect governance structure.
Differences in investment opportunities and growth opportunities can create differences in the need to raise capital and hence in governance practices. We proxy investment opportunities with Tobin’s Q. As in La Porta et al. (2002) and Doidge, Karolyi, and Stulz (2003), we define Tobin’s Q as ((market value of equity (Item 199* Item 25) + total assets (Item 6)-total common equity (Item 60)) / total assets (Item 6)) and winsorize it at the 5th and 95th percentile in order to reduce the effects of outliers. To measure growth opportunities, we follow Titman and Wessels (1988) and use firms’ capital expenditures (Item 128) over total assets (Item 6).
Moreover, it is likely to see more diverse governance structures when there are more companies in a particular industry or a country. Thus, we control for number of firms in our empirical tests.
If firms in some industries are more homogeneous than in others, dispersion of governance practices within an industry could be reduced. We address this concern in two ways. First, we run Glejser tests as one of our additional tests, which help explaining governance differences across industries after controlling for determinants of governance at the individual level. Second, we consider another set of variables as controls; the standard deviations of the firm characteristics described above. The descriptives for these industry standard deviations are also reported in Panel B of Table II together with the other industry specific variables.
4.2. Empirical Specifications
(12)
where j indexes industry;t, semi-annual observations; k, control variables; T, the number of time-periods; and K, the number of control variables. The dependent variable dGOVis governance diversity variable which is, in order to account for different aspects for dispersion, measured in four different ways: the spread of governance, the variance of governance, the logarithm of the standard deviation of governance, and the coefficient of variation in governance. Variable
CONC is the measure of industry concentration, which is proxied by the four-firm
concentration ratio (CR)17, and X is a set of control variables that include the industry means and standard deviations of firm-specific variables such as Tobin’s Q, long-term debt, research and development expenses, cash, size and capital expenditures. We provide the rationale for the controls in the above data description section. Moreover, we control for the number of firms that are used to calculate the dependent variables (spread, variance etc.) for each industry. This is because the inter-industry differences of dispersion might be due to different sample sizes in each industry. Finally, time dummies, d, are also added to control for time fixed effects. Standard errors are clustered by industry to account for error correlation trough time.18
Because our hypothesis concerns differences in governance variation, as a second set of regressions, we apply Glejser’s (1969) heteroskedasticity tests to our sample.19 These tests help us estimate simultaneously the determinants of a firm’s governance and the industry factors that explain governance variation across firms. The heteroskedasticity tests employed here not only indicate the degree of heteroskedasticity affecting the estimation of the relation between average governance and the industry competition, but they also measure governance dispersion across firms during any particular period in time. After exploring within industry dispersion of governance; through Glejser’s test we explore variation across all firms within the whole population. Moreover, since these tests are conducted at the firm-level, they allow us measure variation that is independent of any industry classification. We start by estimating the regression:
17 We did not use HHI index in this industry-level setting due to power of tests since HHI is only available for
manufacturing industries. We use HHI with firm-level tests where we do not run into similar problems.
18 We do not include firm fixed effects because there is no variation in CONC across industries and time.
5 Adams, Almeida, and Ferreira (2002) use this test to investigate firm variability in output as a function of CEO
(13)
where GOV is firm level of governance; CONC is the concentration measure, Concentration Ratio (CR) or Herfindahl Index (HHI)corresponding to the industry that the firm belongs to;d are time dummies. VariableX is a vector of firm specific variables, which are associated with the governance variation.
Then we regress the absolute values of the fitted residuals uˆi t. of the
first-stage regression on the parameters that may explain the conditional variation in governance.
, (14)
An F-test of the hypothesis that all slopes are equal to zero is a test of the null hypothesis of homoskedasticity against the alternative that the variance of firm governance is a function of industry concentration and X. A positive significant coefficient of the concentration measureis evidence that industry concentration is positively related to the variance of governance after controlling for other factors that affect governance variation. We always use heteroskedasticity-corrected standard errors when calculating the t-statistics, since the residuals of these regressions are heteroskedastic by construction.20
We draw inferences based on the results of the above regressions, which we describe and discuss in the next section. In addition, we conduct various robustness checks for alternative industry groupings and alternative measures of industry concentration.
20 The residuals (e
i,t) of these regressions (1) have non-zero expected value, (2) are autocorrelated, and
5. Results
5.1. Firm Governance and Industry Concentration
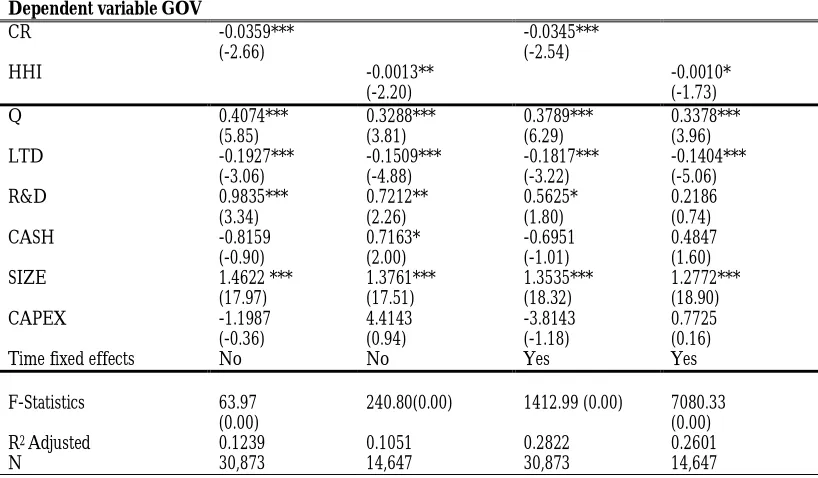
First, we look at how governance choice of firms is related to the competitiveness of the industry to which the firm belongs. Table III reports our results. The first and third regressions use concentration ratio as the proxy for industry competitiveness whereas the second and fourth regressions use the Herfindahl Index (HHI). Herfindahl Index provided by Bureau of Census is only available for manufacturing firms hence we lose more than half of the observations when we use it as a proxy. The negative and significant coefficients on the industry competition proxies are consistent with our corollary. Firms in less concentrated industries practice better governance. A one standard deviation increase in concentration ratio decreases the governance score by 0.63%. Moreover, the significant positive coefficient on Tobin’s Q is consistent with the literature implying that firms with better governance have higher valuation. Also, larger firms, high-growth firms and firms with less leverage have better governance. Next, we analyze the relation between governance diversity and industry competition.
5.2. Governance Diversity and Industry Concentration
5.2.1. Industry-level Tests
We control for industry means and standard deviations of firm-specific variables first separately, and then together with the time fixed effects; the positive relation and the negative quadratic relation stand significant and strong in all cases. In the first column, the coefficients for the industry means of SIZE, LTD and CAPEX are all significant and positive, suggesting that the governance dispersion is more in larger industries, more levered industries and industries with more growth opportunities. After controlling for time effects, LTD remains significant still. Most of the coefficients on the standard deviations of controls are also significant. Observing that industry concentration remain significant even after controlling for many sources of heterogeneity among firms allow us to reject null hypothesis that sectional differences in industry dispersion are simply a by-product of cross-sectional differences in firm characteristics.
Next, two other measures of dispersion, the variance of governance scores, VAR_GOV, and the logarithm of their standard deviation, Log (SD_GOV), are regressed on industry concentration together with the controls. The results, reported in Panel B and Panel C indicate that the positive non-linear relation between the dispersion of the governance and industry concentration continues to hold. In Panel C, we do not include a squared term for concentration considering that the concave relation is already captured by taking the logarithm of the dependent variable. The number of firms in each industry that are used to calculate the dispersion measure remains significant. The significant coefficients on industry means of CASH and CAPEX imply that the low-cash industries and industries with more growth opportunities have a wider dispersion of governance.
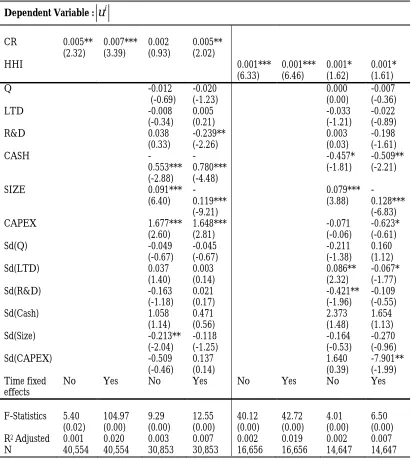
5.2.2. Firm-level tests (Glejser’s Heteroskedasticity Tests)
Next, we employ the Glejser tests which estimate the determinants of governance dispersion while controlling for the determinants of the governance at the firm level. We report the results of the second-stage regression in Table V. The regressions in Panel A use the four-firm domestic concentration ratio as the proxy for industry concentration. Panel B regressions use the Herfindahl-Hirschman Index which is reported by the Bureau of Census for the manufacturing industries. The coefficients on both industry concentration measures, Concentration Ratio and Herfindahl-Hirschman Index, are positive and significant in almost all cases. This reconfirms our earlier finding that firms in more concentrated industries show greater variation in their governance practices. Also, coefficients on CASH, SIZE and CAPEX are consistently significant supporting our earlier claims; low-cash firms, large firms and high-growth firms have more dispersion in governance.
Summing up, empirical tests support our hypothesis that variation in governance and disclosure practices of firms is higher in concentrated industries. In addition, we find evidence that the relation between governance dispersion and industry concentration is nonlinear.
6. Robustness
In the second and fourth columns that control for heterogeneity among firms, Tobin’s Q, LTD, CASH and SIZE remain significant with and without time effects. Overall, these results suggest that our earlier findings are not specific to the choice of competitiveness measure or industry classification type; SIC or NAICS.
7. Conclusion
We construct an equilibrium model of corporate governance, which endogenizes firm governance variation and links firm governance decisions to broader industry forces. Our model assumes that firms make their individual governance decisions in reference to the governance decisions of their industry peers, and the equilibrium outcomes imply intra-industry diversity of governance.
Our empirical tests find evidence for the implications of the model. Using the governance scores provided by the ISS, we find that the diversity of governance practices within an industry decreases with product market competition and the relation is non-linear. Overall, these findings reveal the importance of industry competitiveness on the quality and the diversity of governance practices of U.S. firms. They also imply that governance decision is an interdependent choice and that it cannot be isolated from the industry structure in which the firm is operating as well as the governance decisions of industry peers. These findings, therefore, help provide a better understanding of how firms choose their governance as well as why they are diverse and consequently aim to contribute to the advancement of the universal practice of good governance.
Appendix
Minimally Acceptable Corporate Governance Standards
This table reports the 44 criteria used to construct GOV44 index. The attributes are divided into four sub-categories: Board, Audit, Anti-takeover and Compensation & Ownership. Board
1. All directors attended 75% of board meetings or had a valid excuse 2. CEO serves on the boards of two or fewer public companies 3. Board is controlled by more than 50% independent outside directors 4. Board size is at greater than five but less than 16
6. No former CEO on the board
7. Compensation committee comprised solely of independent outsiders 8. Chairman and CEO are separated or there is a lead director
9. Nominating committee comprised solely of independent outsiders 10. Governance committee exists and met in the past year
11. Shareholders vote on directors selected to fill vacancies 12. Governance guidelines are publicly disclosed
13. Annually elected board (no staggered board)
14. Policy exists on outside directorships (four or fewer boards is the limit) 15. Shareholders have cumulative voting rights
16. Shareholder approval is required to increase/decrease board size 17. Majority vote requirement to amend charter/bylaws (not supermajority) 18. Board has the express authority to hire its own advisors
19. Performance of the board is reviewed regularly 20. Board approved succession plan in place for the CEO
21. Outside directors meet without CEO and disclose number of times met 22. Directors are required to submit resignation upon a change in job 23. Board cannot amend bylaws without shareholder approval or can only do so under limited circumstances
24. Does not ignore shareholder proposal
25. Qualifies for proxy contest defenses combination points Audit
26. Consulting fees paid to auditors are less than audit fees paid to auditors 27. Audit committee comprised solely of independent outsiders
28. Auditors ratified at most recent annual meeting Anti-Takeover
29. Single class, common
30. Majority vote requirement to approve mergers (not supermajority) 31. Shareholders may call special meetings
32. Shareholder may act by written consent
33. Company either has no poison pill or a pill that was shareholder approved 34. Company is not authorized to issue blank check preferred
Compensation & Ownership
35. Directors are subject to stock ownership requirements 36. Executives are subject to stock ownership guidelines 37. No interlocks among compensation committee members 38. Directors receive all or a portion of their fees in stock 39. All stock-incentive plans adopted with shareholder approval
40. Options grants align with company performance and reasonable burn rate 41. Company expenses stock options
30% of total shares outstanding 44.Repricing is prohibited
References
Adams, R., H. Almeida, and D. Ferreira, 2005, Powerful CEOs and their impact on corporate perrformance, Review of Financial Studies 18, 1403-1432.
Aggarwal, R., I. Erel, R. Stulz, and R. Williamson, 2007, Do U.S. firms have the best corporate governance? A cross-country examination of the relation between corporate governance and shareholder wealth,Review of Financial Studies, Forthcoming.
Alchian, A. 1950, Uncertainty, evolution, and economic theory, Journal of Political Economy 58, 211-221.
Allen, F., E. Carletti, and R. Marquez, 2007, Stakeholder capitalism, corporate governance and firm value, Working Paper.
Amemiya, T., 1985, Advanced Econometrics, Harvard University Press, Cambridge, MA Amemiya, T., 1977, A note on a heteroskedastic model, Journal of Econometrica 6, 365-370. Bagnoli, M., and S. Watts, 2007, Oligopoly, disclosure and earnings management, Working
paper, Purdue University.
Baumol, W., 1959, Business Behavior, Value, and growth, Macmillan, New York
Beck, T., A. Demirguc-Kunt, and R. Levine, 2003, Law, endowments and finance. Journal of Financial Economics 70, 137-181.
Berkowitz, D., K. Pistor, and J. –F Richard, 2002, Economic development, legality, and the transplant effect, European Economic Review 47, 165-169.
Bris, A., and N. Brisley, 2008, Theory of optimal expropriation, mergers and industry competition, Working paper, Yale School of Management.
Cheng, I. –H., 2008, Corporate governance spillovers, Working paper, Princeton University. Claessens, S., S. Djankov, and L. Lang, 2000, The separation of ownership and control in East
Asian corporations, Journal of Financial Economics 58, 81-112.
Coffee, J.C. , 1999, The Future as History: The Prospects for Global Convergence in Corporate Governance and its Implications,Northwestern University Law Review 93, 641-708.
Cremers, M., , V. Nair, and U. Peyer, 2007, Takeover defenses and competition: The Role of Stakeholders, Journal of Empirical Legal Studies 5, 791-818.
Doidge, C., A. Karolyi, and R. Stulz, 2003, Why are foreign firms listed in the U.S. worth more?, Journal of Financial Economics 71, 205-238.
Donaldson, G., 1984, Managing corporate wealth, Praeger, New York
Durnev, A., and E. H. Kim, 2005, To steal or not to steal: Firm attributes, legal environment, and valuation, Journal of Finance 60, 1461-1493.
Fershtman, C., and K. Judd, 1987, Equilibrium incentives in oligopoly,The American Economic Review 77, 927-940.
Friedman, M., 1953, Essays in Positive Economics, The University of Chicago Press, Illinois Giroud, X., and H. Mueller, 2008a, Does corporate governance matter in competitive
Giroud, X., and H. Mueller, 2008b, Corporate governance, product market competition, equity prices, Working paper, New York University.
Glejser, H., 1969, A new test for heteroscedasticity, Journal of the American Statistical Association 64, 316–323.
Grossman, S., and Hart, O., 1982, Corporate Financial Structure and Managerial Incentives, in ‘The Economics of Information and Uncertainty’, ed. John J. McCall, 107-140 Grossman, S., and O. Hart, 1986, The costs and benefits of ownership: A Theory of Vertical
and Lateral Integration, Journal of Political Economy 94, 691-719.
Hart, O. 2001, Financial contracting, Journal of Economic Literature 39, 1079-1100.
Jensen, M. and W. Meckling, 1976, Theory of the firm: Managerial behavior, agency costs and ownership structure, Journal of Financial Economics 3, 305-360.
Jensen, Michael C., 1986, Agency costs of free cash flow, corporate finance, takeovers, American Economic Review 76, 323-329.
John, K., and D. Kadyrzhanova, 2008, Peer effects in corporate governance, Working Paper, New York University.
Kadyrzhanova, D., 2005, The leader-bias hypothesis: corporate control dynamics in industry equilibrium, Working Paper, Columbia University.
Kadyrzhanova, D., and M. Rhodes-Kropf, 2007, Concentrating on governance, Working Paper, Columbia University.
Khanna,T., J. Kogan, and K. Palepu. 2002, Globalization and Corporate GovernanceConvergence? A Cross-Country Analysis, Working Paper, Harvard Business School
Klapper, L., and I. Love, 2004, Corporate governance, investor protection, and performance in emerging markets, Journal of Corporate Finance 10, 703-728.
Krishnamurti, C., A. Sevic, and Z. Sevic, 2003, Legal environment, firm-level corporate governance and expropriation of minority shareholders in Asia, Economic Change and Restructuring 38, 85-111
La Porta, Rafael, Florencio Lopez-de-Silanes, Andrei Shleifer, and Robert W. Vishny, 1997, Legal determinants of external finance, Journal of Finance52, 1131–1149.
La Porta, Rafael, Florencio Lopez-de-Silanes, Andrei Shleifer, and Robert W. Vishny, 1998, Law and finance, Journal of Political Economy106, 1113–1155.
La Porta, Rafael, Florencio Lopez-de-Silanes, Andrei Shleifer, and Robert W. Vishny, 1999, Corporate ownership around the world, Journal of Finance 54, 471-517.
La Porta, R., F.Lopez-de-Silanes, A. Shleifer, and R. Vishny, 2000, Agency problems and dividend policies around the world, The Journal of Finance 55, 1–33.
La Porta, Rafael, Florencio Lopez-de-Silanes, Andrei Shleifer, and Robert W. Vishny, 2002, Investor protection and corporate valuation, Journal of Finance57, 1147–1170. Lombardo, Davide, and Marco Pagano, 2000, Legal determinants of the return on equity,
Working paper, University of Salerno
MacKay, Peter and Gordon M. Phillips, 2005, How does industry affect firm financial structure?, Review of Financial Studies 18, 1433-1466
Murphy, K., 1985, Corporate performance and managerial remuneration: An empirical analysis, Journal of Accounting and Economics 7, 11-42
Shleifer, A., and R.Vishny, 1997, Survey of corporate governance, The Journal of Finance 52, 737-783.
Titman, S., and R. Wessels, 1988, The Determinants of Capital Structure Choice, The Journal of Finance 43, 1-19 .
Williamson, O.,1964, The Economics of Discretionary Behavior: Managerial Objectives in a Theory of Firm (Prentice Hall, Englewood Cliffs, N.J.).
Table I: Summary Statistics for ISS Governance Scores (GOV) for U.S. Firms
This table reports the means, standard deviations, minimums, and maximums of ISS governance scores (GOV). Panel A reports summary statistics for each 2-digit NAICS U.S. industry. Panel B reports summary statistics for each semi-annual observation for the period from 2003 through 2006.
Panel A
Industry Name NAICS N Mean Std
Dev
Min Max
Agriculture, Forestry, Fishing and Hunting
11 90 59.09 8.65 42.85 78.57
Mining 21 1,312 58.90 8.46 35.29 83.72
Utilities 22 898 64.21 9.14 38.70 90.00
Construction 23 497 59.72 9.55 29.41 82.04
Manufacturing 31-33 16,656 58.30 8.94 25.71 90.69
Wholesale 42 1,286 57.76 9.00 36.11 88.09
Retail Trade 44-45 1,929 58.44 9.24 32.43 88.09
Transportation and Warehousing 48-49 773 59.32 8.77 36.11 83.72
Information 51 4,427 55.91 8.70 31.42 85.36
Finance and Insurance 52 8,695 58.46 8.90 31.42 92.85 Real Estate, Rental and Leasing 53 704 56.73 9.94 29.72 90.69 Professional, Scientific, and
Technical Services
54 2,227 57.63 8.65 30.55 82.92 Management of Enterprises 55 6 63.26 3.61 60.46 70.27 Administrative and Support and
Waste Management
56 938 56.99 9.46 22.85 83.72
Educational Services 61 133 56.13 8.53 31.42 73.80
Health Care and Social Assistance 62 792 58.22 8.53 34.28 81.39 Arts, Entertainment, and Recreation 71 242 57.00 9.28 36.11 82.50 Accommodation and Food Services 72 849 57.52 9.51 35.89 85.36
Other Services 81 195 55.50 7.03 40.00 74.41
Panel B
Table II: Summary Statistics
This table reports the means, medians, standard deviations, minimums, and maximum of firm-specific and industry-specific variables. Panel A reports firm-specific variables: ISS governance scores, GOV; Q, computed as the sum of total assets plus market value of equity less book value of equity over total assets and winsorized atthe 5th and 95th percentiles; LTD, long-term debt scaled by total assets; R&D, research and development expenses scaled by total assets; CASH, cash scaled by total assets; SIZE, log of total assets; and CAPEX, capital expenditures scaled by total assets. Panel B reports industry-specific variables: spread of governance scores, SP_GOV, calculated as the difference between the maximum and the minimum governance scores within an industry; the variance of governance scores, VAR_GOV, computed as squared cross-sectional standard deviations from the cross-sectional mean of governance; the log of standard deviation of governance, Log (SD_GOV); and the coefficient of variation of governance, CV_ GOV, calculated as cross-sectional standard deviation divided by the cross-sectional mean; CR, four-firm concentration ratio, computed by the Bureau of Census as the ratio of the sales of the top four firms in an industry to total industry sales; HHI, Herfindahl Index, computed by the Bureau of Census as the sum of squared market shares of individual firms within an industry; and the industry means and standard deviations of the firm-specific variables. HHI is available only for manufacturing industries. Industry specification is based on 4-digit NAICS. Each industry contains a minimum of 2 firms. GOV variables are semiannual observations for the period from 2003 through 2006.
Time period N Mean Std Dev Min Max
June 2003 5,439 54.88 7.67 25.71 80.00 December 2003 5,437 55.39 7.68 27.77 83.33 June 2004 5,298 55.67 7.58 27.77 81.81 December 2004 5,216 55.97 7.57 27.77 82.92 June 2005 5,384 56.03 8.08 22.85 82.92 December 2005 5,264 62.58 9.29 33.33 90.00 June 2006 5,444 60.89 9.56 29.41 90.69 December 2006 5,167 63.80 9.11 34.21 92.85
Panel A
Mean Median Std Min Max N
GOV 58.116 57.575 9.012 22.857 92.857 42,525
Q 2.223 1.507 1.949 0.933 11.139 41,732
LTD 0.215 0.094 2.943 0.000 394.333 43,086
R&D 0.059 0.000 0.333 0.000 25.257 52,212
CASH 0.139 0.064 0.183 0.000 1.000 42,638
SIZE 5.690 5.811 2.382 -6.907 14.449 43,176 CAPEX 0.044 0.025 0.066 -0.286 2.989 37,562
Panel B
Table III Firm Governance and Industry Concentration
This table reports the results of following panel regression:
In these regressions,i indexes firms, j industries,t semi-annual observations, k control variables, T the number of time-periods, and K the number of control variables. GOV is firm governance score, CONC is industry concentration measure,
Mean Median Std Min Max N
SP_ GOV 24.019 24.319 10.834 0.000 52.525 1,760 VAR_ GOV 66.393 58.118 50.257 0.000 594.335 1,760 Log (SD_GOV) 1.947 2.031 0.496 -3.118 3.193 1,759
CV_ GOV 0.131 0.132 0.046 0.000 0.456 1,760
CR (%) 26.560 22.300 17.631 1.700 90.900 1,586 HHI (%) 4.121 2.984 3.931 0.092 23.235 616 Mean (Q) 2.065 1.867 0.811 0.933 6.452 1,760 Mean (LTD) 0.262 0.189 1.024 0 .000 26.406 1,760 Mean (R&D) 0.025 0.001 0.076 0.000 1.2919 1,760 Mean (CASH) 0.110 0.097 0.071 0.004 0.534 1,760 Mean(SIZE) 5.825 5.699 1.144 2.628 9.477 1,760 Mean (CAPEX) 0.049 0.041 0.032 0.001 0.275 1,760
Sd(Q) 1.215 0.916 1.006 0.000 5.359 1,760
Sd(LTD) 0.402 0.167 3.759 0 .000 101.783 1,760 Sd(R&D) 0.056 0.004 0.228 0.000 3.755 1,760 Sd(CASH) 0.110 0.093 0.074 0.001 0.414 1,760 Sd(SIZE) 1.863 1.852 0.703 0.003 4.728 1,760 Sd(CAPEX) 0.039 0.031 0.036 0.000 0.625 1,760
K
k
T
t
j t i t j
t i k k j
j t
i CONC X d u
GOV
1 1
, .
Concentration Ratio or Herfindahl Index, corresponding to the industry that the firm belongs to,d are time fixed effects for semi-annual observations (coefficients are not reported). X is a vector of control variables.They are: Q, the sum of total assets plus market value of equity less book value of equity over total assets (winsorized atthe 5th and 95th percentiles); LTD, long-term debt scaled by total assets; R&D, research and development expenses scaled by total assets; CASH, cash scaled by total assets; SIZE, log of total assets; and CAPEX, capital expenditures scaled by total assets. The first and third columns report the results with CR, four-firm concentration ratio computed by the Bureau of Census as the ratio of the sales of the top four firms in an industry to total industry sales. The second and the fourth columns report the results with the HHI, Herfindahl Index computed by the Bureau of Census as the sum of squared market shares of individual firms within an industry. In each panel, the first two columns report results with no time fixed effects; third and fourth columns include time fixed effects. Industry classification is based on 3-digit NAICS. Governance scores are calculated for years 2003-2006 semi-annually. CR and HHI are for 2002. HHI is only available for the manufacturing industries. Firm-specific control variables are in annual frequency for years 2003-2006. t-statistics are in parentheses. ***, **, * denote 1%, 5% and 10% significance respectively. The F-test is a joint significance test, p-values are reported below the test statistics. Standard errors are clustered by firms to account error correlation through time. We do not include firm fixed effects because there is no variation in CONC across industries and time.
Dependent variable GOV
CR -0.0359***
(-2.66)
-0.0345*** (-2.54)
HHI -0.0013**
(-2.20)
-0.0010* (-1.73)
Q 0.4074***
(5.85) 0.3288*** (3.81) 0.3789*** (6.29) 0.3378*** (3.96)
LTD -0.1927***
(-3.06) -0.1509*** (-4.88) -0.1817*** (-3.22) -0.1404*** (-5.06) R&D 0.9835***
(3.34) 0.7212** (2.26) 0.5625* (1.80) 0.2186 (0.74)
CASH -0.8159
(-0.90) 0.7163* (2.00) -0.6951 (-1.01) 0.4847 (1.60) SIZE 1.4622 ***
(17.97) 1.3761*** (17.51) 1.3535*** (18.32) 1.2772*** (18.90) CAPEX -1.1987
(-0.36) 4.4143 (0.94) -3.8143 (-1.18) 0.7725 (0.16)
Time fixed effects No No Yes Yes
F-Statistics 63.97 (0.00)
240.80(0.00) 1412.99 (0.00) 7080.33 (0.00) R2 Adjusted 0.1239 0.1051 0.2822 0.2601
N 30,873 14,647 30,873 14,647
This table reports the results of following panel regression:
K
k
T
t
t j t k
t j k j
j t
j CONC CONC X d e
dGOV
1 1
, .
2
, * *( ) *
Panel A
Dependent variableSP_GOV
Controls Average Std Dev Average Std Dev
CR 0.126***
(3.11) 0.103** (2.54) 0.131*** (3.35) 0.088** (2.27) (CR) 2 -0.001***
(-3.55) -0.001*** (-3.09) -0.001*** (-3.64) -0.001*** (-3.01) Nb of firms 0.139***
(15.54) 0.129*** (15.04) 0.138*** (15.39) 0.127*** (14.95)
Q 0.321
(0.75) 0.199 (0.64) 0.260 (0.63) 0.375 (1.26)
LTD 1.079***
(2.79) 0.489*** (3.43) 0.979** (2.40) 0.442*** (3.15) R&D -3.715
(-0.64) -4.311*** (-2.40) -4.423 (-0.74) -4.691*** (-2.54)
CASH -5.869
(-1.29) 2.576 (0.66) -7.358 (-1.60) 3.598 (0.95)
SIZE 0.618**
(2.43) 1.997*** (4.39) 0.232 (0.92) 2.260*** (5.11)
CAPEX 16.451*
(1.88) 20.783*** (2.62) 12.786 (1.53) 20.903*** (2.88)
Timefixed effects No No Yes Yes
F-Statistic 33.30 (0.00) 41.17 (0.00) 24.29 (0.00) 31.88 (0.00) R2 Adjusted 0.270 0.282 0.310 0.333
N 1,586 1,586 1,586 1,586
Panel B Panel C
Dependent Variable
VAR_GOV Log (SD_GOV)
Controls Average Std Dev Average Std Dev Average Std Dev Average Std Dev CR 0.351*
(1.73) 0.565*** (2.76) 0.380** (1.97) 0.490** (2.56) 0.001** (2.03) 0.001** (2.54) 0.001*** (2.57) 0.001** (2.23) (CR) 2 -0.004**
(-2.02) -0.005** (-2.47) -0.004** (-2.05) -0.005** (-2.39) _ _ _ _
Nb of firms 0.042** (2.15) 0.024 (1.52) 0.038* (1.94) 0.017 (1.12) 0.001*** (6.73) 0.001*** (7.20) 0.001*** (6.40) 0.001*** (6.87)
Q 2.529
(1.13) 2.032 (1.21) 2.177 (1.01) 2.944* (1.85) 0.025 (0.97) 0.027* (1.80) 0.022 (0.88) 0.034** (2.36) LTD 3.568
(1.81) 1.800*** (3.52) 3.006 (1.62) 1.569*** (3.35) 0.027 (1.59) 0.016*** (4.45) 0.023 (1.34) 0.014*** (4.02) R&D -1.986
(-0.09) -7.679 (-1.63) -6.262 (-0.26) -9.754* (-1.90) 0.020 (0.08) -0.109** (-2.36) -0.020 (-0.08) -0.127** (-2.50) CASH -44.067**
(-1.97) -45.109** (-2.11) -52.669** (-2.40) -40.1861** (-1.97) -0.553** (-1.98) -0.231 (-1.03) -0.611** (-2.18) -0.183 (-0.84) SIZE 2.072
(1.38) -4.316 (-1.51) -0.139 (-0.09) -2.965 (-1.07) 0.015 (1.06) 0.020 (0.74) -0.001 (-0.11) 0.031 (1.15) CAPEX 154.920***
(2.77) -12.003 (-0.40) 134.020** (2.51) -11.372 (-0.41) 0.731* (1.74) 0.629* (1.84) 0.570 (1.42) 0.629** (1.98) Time fixed
effects
No No Yes Yes No No Yes Yes
F-Statistics 3.56 (0.00) 3.64 (0.00) 10.00 (0.00) 10.39 (0.00) 8.67 (0.00) 10.14 (0.00) 11.04 (0.00) 12.79 (0.00) R2 Adjusted 0.021 0.012 0.091 0.085 0.033 0.029 0.085 0.088