Ann. Geophys., 31, 1569–1578, 2013 www.ann-geophys.net/31/1569/2013/ doi:10.5194/angeo-31-1569-2013
© Author(s) 2013. CC Attribution 3.0 License.
EGU Journal Logos (RGB)
Advances in
Geosciences
Open Access
Natural Hazards
and Earth System
Sciences
Open Access
Annales
Geophysicae
Open Access
Nonlinear Processes
in Geophysics
Open Access
Atmospheric
Chemistry
and Physics
Open Access
Atmospheric
Chemistry
and Physics
Open Access
Discussions
Atmospheric
Measurement
Techniques
Open Access
Atmospheric
Measurement
Techniques
Open Access
Discussions
Biogeosciences
Open Access Open Access
Biogeosciences
DiscussionsClimate
of the Past
Open Access Open Access
Climate
of the Past
Discussions
Earth System
Dynamics
Open Access Open Access
Earth System
Dynamics
Discussions
Geoscientific
Instrumentation
Methods and
Data Systems
Open Access
Geoscientific
Instrumentation
Methods and
Data Systems
Open Access
Discussions
Geoscientific
Model Development
Open Access Open Access
Geoscientific
Model Development
DiscussionsHydrology and
Earth System
Sciences
Open Access
Hydrology and
Earth System
Sciences
Open Access
Discussions
Ocean Science
Open Access Open Access
Ocean Science
DiscussionsSolid Earth
Open Access Open Access
Solid Earth
DiscussionsOpen Access Open Access
The Cryosphere
Natural Hazards
and Earth System
Sciences
Open Access
Discussions
Cluster observation of few-hour-scale evolution of structured
plasma in the inner magnetosphere
M. Yamauchi1, I. Dandouras2,3, H. R`eme2,3, R. Lundin4, and L. M. Kistler5
1Swedish Institute of Space Physics, P.O. Box 812, 98128 Kiruna, Sweden
2CNRS, Institut de Recherche en Astrophysique et Planetologie (IRAP), BP 44346, 31028, Toulouse cedex 4, France 3University of Toulouse, UPS-OMP, IRAP, Toulouse, France
4Swedish Institute of Space Physics, Ume˚a, Sweden 5University of New Hampshire, Durham, NH, USA
Correspondence to: M. Yamauchi ([email protected])
Received: 15 March 2013 – Revised: 21 July 2013 – Accepted: 22 July 2013 – Published: 12 September 2013
Abstract. Using Cluster Ion Spectrometry (CIS) data from
the spacecraft-4 perigee traversals during the 2001–2006 pe-riod (nearly 500 traversals after removing those that are highly contaminated by radiation belt particles), we statis-tically examined the local time distribution of structured trapped ions at sub- to few-keV range as well as inbound– outbound differences of these ion signatures in intensities and energy–latitude dispersion directions. Since the Clus-ter orbit during this period was almost constant and ap-proximately north–south symmetric at nearly constant lo-cal time near the perigee, inbound–outbound differences are attributed to temporal developments in a 1–2 h timescale. Three types of structured ions at sub- to few keV range that are commonly found in the inner magnetosphere are examined:
1. Energy–latitude dispersed structured ions at less than a few keV,
2. Short-lived dispersionless ion stripes at wide energy range extending 0.1–10 keV,
3. Short-lived low-energy ion bursts at less than a few hun-dred eV.
The statistics revealed that the wedge-like dispersed ions are most often observed in the dawn sector (60 % of traver-sals), and a large portion of them show significant enhance-ment during the traversals at all local times. The short-lived ion stripes are predominantly found near midnight, where most stripes are significantly enhanced during the traversals and are associated with substorm activities with geomagnetic
AL<−300 nT. The low-energy bursts are observed at all lo-cal times and under all geomagnetic conditions, with mod-erate peak of the occurrence rate in the afternoon sector. A large portion of them again show significant enhancement or decay during the traversals.
Keywords. Magnetospheric physics (energetic particles,
trapped)
1 Introduction
Trapped hot ions in the inner magnetosphere (L <7 is con-sidered in this paper) bounce between the Northern Hemi-sphere and the Southern HemiHemi-sphere with short bounce pe-riods of only around 10 min for 100 eV protons and 1 min for 10 keV protons atL=4 (see, e.g., Quinn and McIlwain, 1979). Therefore, for any phenomena with longer timescales than a few tens of minutes in the sub-auroral region, the ion population of >100 eV in the inner magnetosphere is ex-pected to be the same between the conjugate regions, i.e., at a fixed latitude (orLvalue) and longitude. In other words, one can ignore the hemispheric difference when examining the temporal changes of intensities or latitudinal profiles of these ion populations.
Cluster perigee traversals in the inner magnetosphere dur-ing the 2001–2006 period have a perigee altitude of 4 Earth radii at the equator, and the orbit is nearly symmetric about the equatorial plane along nearly the same longitude, with less than 1–2 h local time difference between the inbound and the outbound passes. The symmetry with respect to the
12
18
0
3 RE 6 RE
6
< keV
> 10 keV magnetic drift
[image:2.595.53.280.63.260.2]ExB drift (except corotation) Corotation
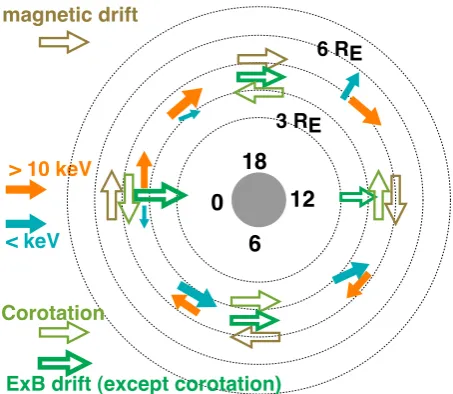
Fig. 1. Illustration of ion drift in the inner magnetosphere. The three major components of the drift (magnetic drift, co-rotation, and E×Bdrift) are given by the empty arrows, and the resultant ion velocities are given by the solid arrows for high-energy and low-energy components under a moderate magnetospheric condition. The velocity is schematically represented by the size of the arrow. Due to the temporal variation of the electric field, the drift motion of sub-keV ions changes dynamically.
equatorial plane for both the orbit and the motion of trapped ions allows us to interpret the inbound–outbound differences in the latitudinal profile of the ion population as temporal changes by, for example, ion energization, transport, or loss, with a timescale on the order of 1 h. If an ion signature is energy–latitude dispersed, this difference should appear as an inbound–outbound asymmetry in the ion dispersion di-rection with respect to the equator because the latitude can be replaced by the distance from the equatorial plane. Fur-thermore, the nearly constant orbital parameters during the 2001–2006 period allow us to compare simply the different traversals to obtain statistics of the different ion populations to determine their local time distribution and correlation with substorm activities.
Yamauchi et al. (2006) showed one example of a clear inbound–outbound difference at around 09 MLT (magnetic local time). In that event, drifting protons from an earlier lo-cal time and oxygen outflow from the ionosphere suddenly appeared during the outbound pass in the northern mag-netosphere, although no signature was observed during the inbound pass along the geomagnetically conjugate region with the inbound pass. This observation indicated a temporal change in the ion population in the inner magnetosphere, and it turned out to be related to a substorm onset. The obvious next step is to perform a statistical study of similar kinds of asymmetries.
Such a work requires a good classification of the latitudi-nal ion profiles into several “basic energy–latitude patterns”
of ion populations coming from specific source regions via specific transport mechanisms and elapsed times, from 10 min to 10 h (Horwitz and Chappell, 1979; Ejiri et al., 1980; Olsen et al., 1987; Ebihara et al., 2001; Yamauchi and Lundin, 2006; Yamauchi et al., 2009b). However, this task is not simple because the observed ion population of<several keV in the inner magnetosphere is a convolution of various ion populations, which are sensitive to changes in the drift direction, location, and magnetospheric activity.
The ion drift motion in the inner magnetosphere is gener-ally determined by the energy-dependent magnetic (gradient-B and curvature) drift, the energy-independentE×B drift, and co-rotation, whereE is the externally imposed electric field. The magnetic drift and co-rotation drive ions westward and eastward, respectively, at all local times (LTs) in a nearly time-independent manner, whileE×B drift driven by the time-dependent dawn-to-dusk electric field moves the drift-ing ions mainly sunward, i.e., westward in the evendrift-ing sector and eastward in the morning sector (Alfv´en and F¨althammar, 1963; Lennartsson et al., 1979), as illustrated in Fig. 1.
Due to the energy-dependence of the magnetic drift, the magnetic drift exceeds the co-rotation for>10 keV ions and vice versa for cold ions at all LTs. Since a balance of the above three drift components determines the ion drift mo-tion, the time-dependentE×Bdrift controls the balancing energy that demarcates the westward drift (high energy) and the eastward drift (low energy). Due to the local time de-pendencies of the azimuthal component of the E×B drift (cf. Fig. 1), this demarcation energy decreases as the local time increases from the morning sector to the evening sec-tor (Quinn and McIlwain, 1979; Yamauchi et al., 2006). Ac-cording to Kovrazhkin et al. (1999), the statistical demarca-tion energy (“ion gap” in their terminology) in the morning sector at 65◦invariant latitude (L=5.6) is 5–8 keV. Below this demarcation energy, the balance of different drift compo-nents makes the final eastward drift even slower than the drift velocity of the dominating drift component and slower than the drift velocity of cold plasmaspheric ions. Therefore, the inbound–outbound differences of these low-energy ion pat-terns in the Cluster data indicate significant temporal changes of the source of these low-energy ions.
Previously, the four most common ion patterns at the en-ergy range that corresponds to eastward drift in the Cluster Ion Spectrometry (CIS) data have been identified:
(keV cm-2 s-1 keV-1)
H+
log JE 7.0 6.0 5.0
CIS/CODIF (SC-4) , 2002-9-8
UT 03:00 03:30 04:00 04:30 05:00
UT 04:00 04:30 05:00 05:30 06:00 06:30
(e)
CIS/CODIF (SC-4) , 2002-8-8
(d)
10 1 0.1 [keV]
10 1 0.1 [keV]
UT 09:30 10:00 10:30 11:00 11:30 12:00
(a)
10 1 0.1
[keV]
CIS/CODIF (SC-4) , 2004-2-6
Dist ILat MLT Xgse Ygse Zgse
5.0 4.6 4.3 4.1 4.2 4.4 4.8 -74.3 -68.6 -63.0 -60.0 60.6 65.5 71.8 14.3 14.0 13.8 13.7 13.6 13.6 13.7 2.0 3.7 3.2 2.7 1.9 -0.0 -3.6 -0.1 3.5
Dist ILat MLT Xgse Ygse Zgse
4.9 4.5 4.2 4.1 4.2 4.5 4.9 -72.8 -66.9 -61.8 59.2 61.8 67.4 73.7 12.2 12.0 11.9 11.8 11.8 11.9 12.0 3.4 4.1 2.5 1.2 -0.4 -1.7 -3.3 0.3 3.8 Dist
ILat MLT Xgse Ygse Zgse
5.6 5.1 4.7 4.2 4.2 4.2 4.4 -70.1 -66.3 -62.8 61.0 61.8 66.0 72.2 2.3 2.2 2.1 2.0 1.8 1.5 1.1 -2.2 -3.7 -3.3 -3.0 -2.2 -0.4 -4.1 -0.7 2.9
CIS/CODIF (SC-4) , 2003-3-15
CIS/CODIF (SC-4) , 2004-9-14
Dist ILat MLT Xgse Ygse Zgse
5.2 4.8 4.5 4.4 4.4 4.5 4.8 -70.1 -66.0 -62.4 60.2 62.2 67.0 72.8 12.2 11.9 11.7 11.6 11.5 11.4 11.3 4.1 4.3 2.5 0.9 -0.6 -1.8 -3.1 0.4 3.7
UT 00:30 01:00 01:30 02:00 02:30 03:00
Dist ILat MLT Xgse Ygse Zgse
5.2 4.8 4.4 4.1 4.0 4.2 4.5 -70.2 -65.0 -60.5 63.3 66.3 72.9 80.6 22.9 23.1 23.2 23.3 23.4 23.4 23.3 -3.2 -4.0 -2.6 -1.1 0.5 1.8 -4.0 -0.5 3.1
UT 01:30 02:00 02:30 03:00 03:30 04:00
10 1 0.1 [keV]
10 1 0.1 [keV]
(b)
[image:3.595.65.524.61.459.2](c)
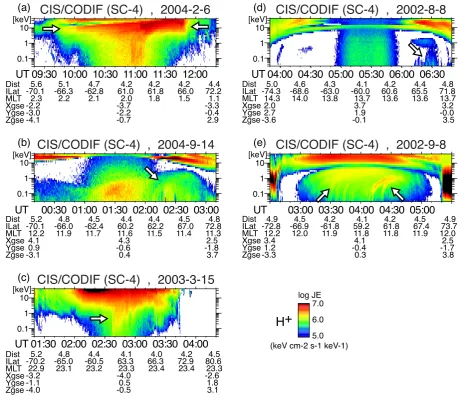
Fig. 2. Energy–time spectrograms of differential energy flux (keV cm−2s−1str−1keV−1) of protons observed by CIS/CODIF on board Cluster SC-4 during perigee traversal on (a) 6 February 2004 (plasma sheet-like banded ions), (b) 14 September 2004 (wedge-like dispersed ions), (c) 5 March 2003 (vertical stripes), (d) 8 August 2002 (short burst of low-energy ions), and (e) 8 September 2002 (internal dispersive stripes). The object ion signature is marked by the empty arrow in each panel.
b. Wedge-like energy–latitude dispersed structured ions at sub-keV range (Yamauchi et al., 1996; Ebihara et al., 2001): These ions are found even at low altitude (Sauvaud et al., 1981; Newell and Meng, 1986). The energy of the source population is much lower than that of the first population, and two possible origins have been proposed for this population: a nightside plasma sheet that contains cold plasma of ionospheric origin (Yamauchi et al., 2009b; Engwall et al., 2009) and a di-rect supply from the ionosphere (Giang et al., 2009). It is not clear whether these ions are the same as sub-keV ions flowing in nearly the field-aligned directions as ob-served by many equatorial satellites (e.g., Fennel et al., 1981). Even if they are the same, we cannot simply as-sume a direct ionospheric origin as the past equatorial
observations suggested, because ions with low-altitude mirror points are observed as nearly field-aligned near the equatorial plane.
d. Short bursts of low-energy ions that are isolated from the above structures: They have a peak energy flux at less than 100 eV, but at higher energy than plasmas-pheric ions (Yamauchi et al., 2009a). The majority of the events are flowing in nearly field-aligned directions (Yamauchi et al., 1996, 2009a). The association with field-aligned warm ions at the equator (e.g., Horwitz and Chappell, 1979) is not clear.
Figures 2a–d show examples of these ion populations. The individual signatures are marked by the empty arrows. Al-though these hot ions are expected to be observed in simi-lar ways in the conjugate hemispheres (i.e., symmetric with respect to the equator), we selected in Fig. 2 the traversals when the ion populations are significantly different between the inbound and the outbound passes during Cluster perigee traversals. Figure 2a shows sudden intensification of the plasma sheet-like ions at a limited energy range in the east-ward drifting domain (we call this “plasma sheet-like banded ions”). Figure 2b shows sudden appearance of wedge-like energy–latitude dispersed ions (we call this “wedge-like dis-persed ions” hereafter). Figure 2c shows sudden appearance of short-lived burst of ions covering a wide energy (we call these “vertical stripes” hereafter), and Fig. 2d shows a short burst of low-energy ions.
Due to the energy-dependent drift velocity, the energy– latitude dispersion of nearly azimuthally drifting ions be-comes sharper with longer elapsed time, i.e., from nearly vertical stripes in the spectrogram like the third type (ver-tical stripes) to curved stripes like the second type (wedge-like dispersed ions) after some drift time and drift distance (Ebihara et al., 2001). However, we keep the second type and the third type as two different categories in the present study because the third type and the second type often coexist in an independent manner (Yamauchi et al., 2006), indicating that the third type may have different sources than the sec-ond type.
The energy–latitude dispersion also appears in the first cat-egory (plasma sheet-like banded ions), with lower energy at higherLafter a long elapsed time (Vallat et al., 2007). This feature can be attributed to different magnetic drift velocities at differentL shells (Ebihara et al., 2004), and can be dis-tinguished from the wedge-like dispersed ions. However, the injection front of this population also shows energy–time or energy–latitude dispersions, and these ions are no longer dis-tinguished from the wedge-like dispersed ions in both mor-phology and theory (McIlwain, 1974; Yamauchi et al., 1996; Ebihara et al., 2001).
As mentioned above, the threshold energy that demar-cates the westward drift and the eastward drift decreases as the local time increases. During substorms, this de-marcation energy increases due to the enhanced electric field (Yamauchi et al., 2009b). In this paper, however, we do not include the change in the ion energy in defining the inbound–outbound differences because we look for the
sudden appearance/disappearance of an ion population rather than change in the drift velocity.
We statistically obtain the local time distribution of these ion signatures observed by Cluster during the 2001–2006 period. We also examine the inbound–outbound differences or asymmetry in the dispersion direction of these ion pop-ulations. We use CIS COmposition DIstribution Function (CODIF) instrument that covers 0.03–40 keV (R`eme et al., 2001). The double-coincidence detection for mass separation for CODIF removes a large part of contamination by the ra-diation belt particles inside the geosynchronous orbit. How-ever, one-third of the traversals during the 2001–2006 period could not be used because of this type of severe contamina-tion. Due to degradation of microchannel plates (MCPs), the sensitivity of CODIF started to differ significantly between different spacecraft (SC) after fall 2002 (Fig. 5 of Kistler et al., 2013). Therefore, we use only SC-4 in this statistical work.
2 Statistics
For the ion populations that are shown in Figs. 2a–d, we take statistics of (b)–(d) types. We examine both total observa-tion frequency and the observaobserva-tion frequency of cases that show clear inbound–outbound differences (i.e., strong inten-sification or decay in the intensity). As one form of inbound– outbound difference, we also examine the energy–latitude dispersion direction for the second population (wedge-like dispersed ions): we examine (e) internal stripes that have energy–latitude dispersions asymmetric with respect to the equator as shown in Fig. 2e. This category is sometimes difficult to distinguish from the strong intensification of the wedge-like dispersed ions, but such cases are the minority.
We do not study the plasma sheet-like banded ions (Fig. 2a) because its energy–time pattern varies considerably over a wide energy range for both energy bands (narrow band to very wide band) and low-energy cutoff (from about 1 keV to more than 10 keV). This variability makes it difficult to take statistics, particularly when we have to distinguish it from the wedge-like dispersed ions (Yamauchi et al., 2006), and causes a risk of misinterpretation.
first type of partially contaminated traversals to increase the statistics (i.e., total 494 traversals are used).
Another technical problem in taking the statistics is the degradation of the MCP by the accumulated flux over the mission, which makes the weak signatures more difficult to detect in later years. The MCP efficiency decreased by an or-der of magnitude during the first 4 years even after the bias adjustment (Kistler et al., 2013), and the degraded signal-to-noise ratio makes the pattern identification more difficult. Therefore, the MCP degradation may affect the statistics, particularly when we consider the inbound–outbound dif-ferences. To minimize this problem, we take a similar but more restrictive selection criterion of the ion signatures than Yamauchi et al. (2006).
For each ion signature, we count the cases only when the entire structure (not the peak) is clearly identified by eye in the energy flux spectrogram of format shown in Fig. 2: we counted ion signatures with about more than 3×10⁵keV cm−2s−1str−1keV−1 over the entire structure. The inbound–outbound difference is defined by a change in the intensity of the entire structure by about a factor of 3 using this identification method for the types shown in Figs. 2b–d or by the energy–latitude dispersion direction for the type shown in Fig. 2e. Here, we are not strict in the con-jugacy by degree-by-degree because we are interested in the entire structure and because the north–south conjugacy is not strict particularly during winter and summer.
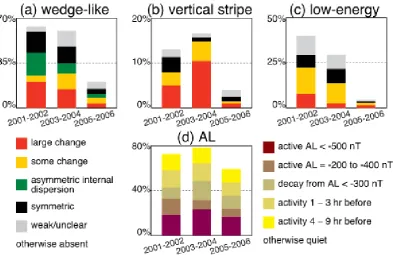
The solar cycle dependence should also be considered because it predicts a decrease in the occurrence frequency of magnetospheric disturbances and electric field after 2004 (e.g., Nakano, 2004). To examine both the MCP degradation effect and the solar cycle effect on the statistics, we exam-ined the bi-annual change of the observation frequency (%) of (a) the wedge-like dispersed ions, (b) vertical stripes, and (c) short bursts of low-energy ions. As a reference, we also examined (d) the statistics of AL activities during all these traversals. Figure 3 shows the results.
For all three types, the observation frequency drastically decreased after 2004 although the number of substorms did not decrease very much, as shown in Fig. 3d. Therefore, the decrease of the observation frequency of all patterns after 2004 most likely reflects the MCP degradations more than the solar cycle dependence. Considering the increase of the auroral electrojet, AE (AL), activity from the 2001–2002 pe-riod to the 2003–2004 pepe-riod, the MCP degradation is the likely cause of less clear wedge-like dispersed ions during the 2003–2004 period than the 2001–2002 period. Subtracting such a degradation effect, the increase of the vertical stripes during the same period in Fig. 3b should be more drastic in reality. The gradual decrease of the perigee altitude might also cause some effect on the observation, but the observa-tion frequency should not be very much affected because we expect that the spacecraft traverses the sameLshell as where these ions are filled.
The rapid decrease of the observation frequency shown in Fig. 3 might cause a different local time distribution between solar maximum (2001–2002) and solar minimum (2006), the latter of which is weighted too little due to the degradation of the instrument. In such a case, using the entire period of 2001–2006 might skew the different local time distributions. To examine this, Fig. 4 shows a comparison of the local time distributions of the wedge-like dispersed ions between the first three years and the last three years. Note that Fig. 4 is made for the entire perigee traversals over both hemispheres, while similar statistics in Yamauchi et al. (2006) are based on one-hemispheric traversals for 2.5 yr. Furthermore, the clas-sification in Yamauchi et al. (2006) is not as sub-divided as the present classification. For example, we removed cases without smooth energy–latitude dispersions in Fig. 4. Yet the result for the 2001–2003 period is similar to Fig. 3 of Yamauchi et al. (2006).
Figure 4 demonstrates that, despite the drastic decrease of the observation frequency after 2004 at all LTs, the local time distribution did not change very much between the 2001– 2003 period and the 2004–2006 period. The minor shift of the peak LT from 08 LT to 04 LT might be explained by sta-tistical uncertainty (e.g., binning method and the MCP degra-dation), and we cannot attribute it to anything at moment. Since the relative profile of the local time distribution is so similar between two periods, we can safely use the entire pe-riod data.
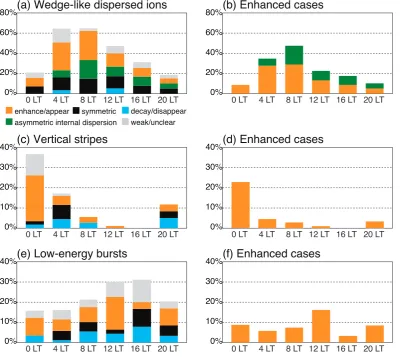
Figure 5 shows the local time distributions of the three basic patterns sub-divided by inbound–outbound differences with a criterion of enhancement or decay defined by about a factor of 3 difference in the intensity of the entire structure (category of both large change and some change in Fig. 3). The left panels (Figs. 5a, c, and e) show all sub-categories, and the right panels (Figs. 5b, d, and f) show only enhanc-ing ones. The internal asymmetry in the energy–latitude dis-persion direction (Fig. 2e) is also subclassified in Figs. 5a and b. The total observation probability is peaked at the late morning sector for the wedge-like dispersed ions and at the midnight sector for the vertical stripes, while the peak in the afternoon for the low-energy bursts is less outstanding than the other patterns.
Both Figs. 3 and 5 demonstrate that, for all the ion sig-natures, the traversals with significant difference between the inbound and the outbound passes are observed more frequently than cases that are symmetric with respect to the equator, for all periods and at almost all LTs. In particular, a majority of the vertical stripes show significant enhancement during the traversals. This result indicates that the timescale of these phenomena is comparable to the inbound–outbound traversal time (1–2 h).
Fig. 3. Observation frequency (%) of (a) wedge-like dispersed ions, (b) vertical stripes, and (c) short bursts of low-energy ions during Cluster SC-4 perigee traversals, and (d) AL activity during all these traversals, for 2001–2002 (177 traversals), 2003–2004 (115 traversals), and 2005–2006 (202 traversals). Each ion signature is sub-classified by inbound–outbound difference (large change means one order of magnitude difference in the differential energy flux; some change means more than about a factor of 3 difference in the differential energy flux) or by the energy–latitude dispersion direction of the internal stripes (asymmetric with respect to the equator is shown by green). Symmetry means no significant change in the intensity or energy–latitude dispersion direction. The geomagnetic activity is classified by the current AL activity as well as the hours from the latest AL activity of|AL|>200 nT.
wedge-like unclear other type stripes total number of traversals
2001~2003 2004~2006 100%
80% 60% 40% 20% 0%
Wedge-like dispersed ions
0 LT 4 LT 8 LT 12 LT 16 LT 20 LT 23, 34 38, 49 56, 52 44, 49 39, 51 26, 33
Fig. 4. Observation frequency (%) of detecting clear wedge-like dispersed ions at different local time (LT) sectors (22–02 LT, 02– 06 LT, 06–10 LT, 10–14 LT, 14–18 LT, and 18–22 LT) observed by Cluster-4 CIS/CODIF during 2001–2003 and 2004–2006. Number at the top of each bar is the total number of traversals in each 4 h bin.
the wedge-like dispersed ions and the low-energy bursts. For the vertical stripes and low-energy bursts, however, the local time distribution of the symmetric cases is somewhat differ-ent from that of the intensifying cases or total probability.
The local time distribution of the intensifying cases of the low-energy bursts shows a clear peak at noon (Fig. 5f), which is a part of the wide afternoon peak of the total probabil-ity (Fig. 5e). The local time distribution of the symmetric cases of the vertical stripes shows a peak at 04 LT, where the symmetric cases are found more often than the enhancing cases. This is quite different from the local midnight where the majority are enhancing cases. Although the statistics are not very large, these differences cannot be attributed solely to the statistical error.
[image:6.595.56.282.421.574.2]80% 60% 40% 20% 0%
(a) Wedge-like dispersed ions
0 LT 4 LT 8 LT 12 LT 16 LT 20 LT
40% 30% 20% 10% 0%
40% 30% 20% 10% 0%
0 LT 4 LT 8 LT 12 LT 16 LT 20 LT
0 LT 4 LT 8 LT 12 LT 16 LT 20 LT
(c) Vertical stripes
(e) Low-energy bursts
enhance/appear symmetricweak/unclear decay/disappear asymmetric internal dispersion
0 LT 4 LT 8 LT 12 LT 16 LT 20 LT
0 LT 4 LT 8 LT 12 LT 16 LT 20 LT
0 LT 4 LT 8 LT 12 LT 16 LT 20 LT 80%
60% 40% 20% 0%
40% 30% 20% 10% 0%
40% 30% 20% 10% 0%
(b) Enhanced cases
(d) Enhanced cases
[image:7.595.100.501.64.421.2](f) Enhanced cases
Fig. 5. Observation frequency (%) of (a)–(b) wedge-like dispersed ions, (c)–(d) vertical stripes, and (e)–(f) short bursts of low-energy ions at different local time (LT) sectors, during Cluster SC-4 perigee traversals during the 2001–2006 period (494 traversals). Traversals with inbound–outbound difference (increase or decrease) are defined by more than about a factor of 3 changes in the differential energy flux. The total number of traversals in each 4 h bin is 57, 87, 108, 93, 90, and 59, for 22–02 LT, 02–06 LT, 06–10 LT, 10–14 LT, 14–18 LT, and 18–22 LT, respectively.
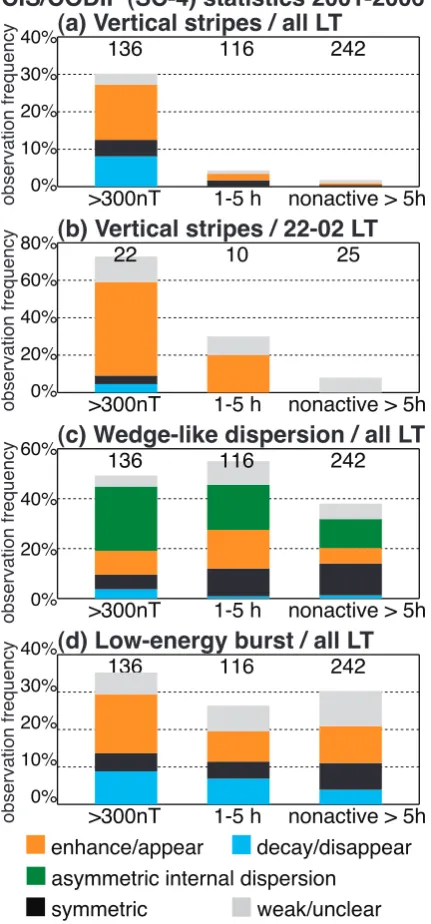
Figures 6a and 6b demonstrate that the vertical stripes ap-pear as the result of substorm activity mainly in the mid-night sector. If the geomagnetic activity is AL<−300 nT, the vertical stripes appear with more than 60 % probability at local midnight. Figure 6c demonstrates that, for the wedge-like dispersed ions, their intensification during a traversal is more frequently observed after substorms than during a sub-storm. This result is consistent with the long-time eastward drift of the wedge-like dispersed ions as demonstrated by the Viking data (Yamauchi and Lundin, 2006). Conversely, inter-nal striping structures with asymmetric energy–latitude dis-persion directions are more often observed during substorms than during long quiet periods.
The low-energy burst is observed independent of substorm activity, and even during long quiet periods. This is some-what different from the statistics of similar structure ob-served near the equator (e.g., Horwitz and Chappell, 1979).
We made the same plot for local noon where the asymmetric cases are peaked (not shown here), but only a minor associa-tion with AL dependence is obtained with a large uncertainty. Thus, a substantial percentage of the low-energy bursts is generated without substorms, while some low-energy bursts are generated during substorms (Yamauchi et al., 2009a). At the moment, we cannot make a general conclusion on the re-lation between the low-energy burst and substorm activity.
3 Discussion
60%
40%
20%
0%
observation frequency
observation frequency
observation frequency
40% 30% 20% 10% 0%
40% 30% 20% 10% 0%
observation frequency
80% 60% 40% 20% 0%
(a) Vertical stripes / all LT
(c) Wedge-like dispersion / all LT
(d) Low-energy burst / all LT
CIS/CODIF (SC-4) statistics 2001-2006
>300nT 1-5 h nonactive > 5h
>300nT 1-5 h nonactive > 5h
>300nT 1-5 h nonactive > 5h
(b) Vertical stripes / 22-02 LT
>300nT 1-5 h nonactive > 5h
136 116 242
136 116 242
136 116 242
22 10 25
enhance/appear
[image:8.595.60.276.70.533.2]symmetric weak/unclear decay/disappear asymmetric internal dispersion
Fig. 6. Observation frequency (%) of (a) vertical stripes at all LTs, (b) vertical stripes at local midnight, (c) wedge-like structure at all LTs, and (d) short bursts of low-energy ions at all LTs, during Clus-ter SC-4 perigee traversals during the 2001–2006 period. The obser-vation frequency is obtained for different geomagnetic conditions judged by AL threshold of−300 nT (minute value), i.e., active pe-riod, shortly after active period (|AL|<300 nT for 1–5 h), and quiet period (|AL|<300 nT for more than 5 h).
Figures 5 and 6 indicate that the vertical stripe is a mid-night signature associated with AL<−300 nT substorms, while the wedge-like dispersed ions are a dawn signature that appears some hours after a substorm. These results suggest that the vertical structure might be one form of
the wedge-like dispersed ions with very short elapsed time (Ebihara et al., 2001). However, if we take the total obser-vation probability, counting both the wedge-like dispersed ions and the vertical stripes, the distribution is still peaked in the morning sector but not the midnight sector as shown in Fig. 4 (see also Yamauchi et al., 2006). Furthermore, some wedge-like dispersed ions are most likely formed as the re-sult of direct filling of low-energy (less than 100 eV) ions from the ionosphere (Yamauchi et al., 2006; Giang et al., 2009). Therefore, only a fraction of the wedge-like dispersed ions are most likely the result of time-evolved vertical stripes. The local time distribution is also different between the asymmetric internal dispersion and the wedge-like dispersed ions for both symmetric cases and intensifying cases. This also encourages us to classify the asymmetric internal disper-sion as different from the intensifying cases of the wedge-like dispersed ions.
One outstanding result for all three patterns is the high oc-currence rate of traversals with significant changes between the inbound and the outbound passes. Among these traver-sals, intensifying cases dominate over decaying cases for the wedge-like dispersed ions and the vertical stripes, while the intensifying cases and decaying cases show nearly equal ob-servation probability for the low-energy bursts.
The high occurrence rate of intensifying cases at local midnight for the vertical stripes (Fig. 5c) is reasonable be-cause they are directly associated with substorm activity (Fig. 6a), which normally has a timescale of less than 1 h (i.e., shorter than the Cluster traversal time). The nearly equal observation probabilities between the intensifying cases and decaying cases for the low-energy bursts can be understood by a short lifetime, so that the phenomenon decays quickly when the source mechanism turns off. We should still note that there is some connection between the inbound ion signa-ture and the outbound ion signasigna-ture because symmetric cases are observed as often as changing cases at around 16 LT. This indicates that the lifetime is not very much shorter than the traversal time. Since the pitch-angle distribution of this cate-gory is nearly field-aligned in both directions, an ionospheric source is suspected (cf. Quinn and McIlwain, 1979; Horwitz and Chappell, 1979), but no Cluster work has been dedicated to this problem in the inner magnetosphere.
The local time distribution of the enhancing cases in the wedge-like dispersed ions is not intuitively understood be-cause the ion drift at sub-keV range is expected to stagnate near local noon (Ebihara et al., 2001). Although Yamauchi and Lundin (2006) have shown that the drifting speed could be much faster than the model, a numerical work in the fu-ture is needed to examine whether the drifting model alone can explain the enhancement within 1–2 h near local noon or if we need new sources to explain it.
The wedge-like dispersed ions have less sensitivity in the threshold value. A previous study using Viking satellite data (Yamauchi and Lundin, 2006) gave a similar value: 300– 400 nT was the best threshold for hourly AE when examining the wedge-like dispersed ions in the Viking ion data. There-fore, AL= −300 nT is a good estimate of the value, beyond which a substorm accompanies formation of ion stripe struc-tures in the inner magnetosphere.
4 Conclusions
Using Cluster spacecraft-4 CIS/CODIF data during the 2001–2006 period, we statistically examined the local time distribution of structured trapped ions at the sub- to few keV range for both the total observation frequency and the ratio of cases that show significant inbound–outbound differences. We particularly examined three basic energy– latitude patterns of ions in the inner magnetosphere that are commonly observed in the sub-keV range: (1) wedge-like energy–latitude dispersed structured ions at less than a few keV, (2) short-lived ion stripes with weak dispersion over wide energy ranges (0.1–10 keV), and (3) short-lived low-energy ion burst (less than a few hundred eV) that are mostly flowing nearly along the geomagnetic field. The differences are defined either by the energy–latitude dispersion direc-tion or by the changes in energy flux of the eye-identified entire ion patterns by about a factor of 3. Such inbound– outbound differences are attributed to temporal development on the timescale of the traversal when the Cluster orbit was nearly north–south symmetric during the 2001–2006 period. The statistics revealed the following results.
1. The wedge-like dispersed ions are most often observed in the dawn sector (60 % of traversals), which is consis-tent with the past results (e.g., Yamauchi et al., 2006). The correlation between the wedge-like dispersed ions and the AL activity is consistent with the previous re-sults (Yamauchi and Lundin, 2006; Yamauchi et al., 2009b). However, the high occurrence rate of the en-hancing cases at all LTs needs quantitative examination (e.g., by numerical simulation in the future).
2. The short lived ion stripes with weak dispersion over wide energy ranges (vertical stripes) are found predom-inantly near midnight, where most stripes are signifi-cantly enhanced during the traversals and are associ-ated with substorm activities with geomagnetic AL<
−300 nT. Adding this category to the above category does not alter the morning peak of the above cate-gory: the vertical stripes may explain only a part of the wedge-like dispersed ions. The local time distribution is also different between the asymmetric internal disper-sion and the wedge-like dispersed ions, suggesting that asymmetric internal dispersion is also different from the intensifying cases of the wedge-like dispersed ions.
3. The low-energy bursts are observed at all LTs under all geomagnetic conditions, with a moderate peak in the oc-currence rate in the afternoon sector. A large portion of them again show significant enhancement or decay dur-ing the traversals. While the afternoon peak is consistent with similar field-aligned warm ions that are observed near the equatorial plane (e.g., Horwitz and Chappell, 1979), the AE dependences are different between the low-energy bursts observed by Cluster and the similar phenomenon in the past.
The statistics also show that intensifying cases dominate over decaying cases for the wedge-like dispersed ions and the ver-tical stripes, and both the intensifying and decaying cases are nearly comparable for the low-energy bursts. These results indicate significant temporal changes within 1–2 h in the in-ner magnetospheric ion populations, and a short lifetime that is comparable to the traversal time (1–2 h) for the low-energy bursts.
Correlation studies with the geomagnetic AL activities re-vealed that the vertical stripes are directly related to substorm activities of AL<−300 nT, and this relation (occurrence rate of enhancing cases under different AL conditions) is the clearest when we set the threshold value of AL to−300 nT instead of−200 nT or−400 nT. The−300 nT threshold is also found for the wedge-like dispersed ions. Therefore, AL value of about−300 nT corresponds to the minimum energy for a substorm that can form the stripe structure (both non-dispersed and non-dispersed).
Acknowledgements. The AE index from 11 stations is provided
by WDC-C2 for geomagnetism at Kyoto University. The Cluster project is managed by European Space Agency (ESA). This work is partly supported by Swedish National Space Board (RS). Yamauchi thanks programs for disabled people in Sweden, which have made it possible for him to work.
Topical Editor C. Owen thanks two anonymous referees for their help in evaluating this paper.
References
Alfv´en, H. and F¨althammar, C. G.: Cosmical Electrodynamics, Fun-damental Principles, Clarendon, Oxford, 1963.
Ebihara, Y., Yamauchi, M., Nilsson, H., Lundin, R., and Ejiri, M.: Wedge-like dispersion of sub-keV ions in the dayside magneto-sphere: Particle simulation and Viking observation, J. Geophys. Res., 106, 29571–29584, 2001.
Ebihara, Y., Ejiri, M., Nilsson, H., Sandahl, I., Grande, M., Fen-nell, J. F., Roeder, J. L., Weimer, D. R., and Fritz, T. A.: Multiple discrete-energy ion features in the inner magneto-sphere: 9 February 1998, event, Ann. Geophys., 22, 1297–1304, doi:10.5194/angeo-22-1297-2004, 2004.
Engwall, E., Eriksson, A. I., Cully, C. M., Andr´e, M., Tor-bert, R., and Vaith, T.: Earth’s ionospheric outflow domi-nated by hidden cold plasma, Nature Geoscience, 2, 1, 24–27, doi:10.1038/ngeo387, 2009.
Fennell, J. F., Croley Jr., D. R., and Kaye, S. M.: Low-energy ion pitch angle distributions in the outer magnetosphere: Ion zipper distributions, J. Geophys. Res., 86, 3375–3382, doi:10.1029/JA086iA05p03375, 1981.
Ganushkina, N. Y., Pulkkinen, T. I., Sergeev, V. A., Kubyshkina, M. V., Baker, D. N., Turner, N. E., Grande, M., Kellett, B., Fennell, J., Roeder, J., Sauvaud, J.-A., and Fritz, T. A.: En-try of plasma sheet particles into the inner magnetosphere as observed by Polar/CAMMICE, J. Geophys. Res., 105, 25205– 25219, doi:10.1029/2000JA900062, 2000.
Giang, T. T., Hamrin, M., Yamauchi, M., Lundin, R., Nilsson, H., Ebihara, Y., R`eme, H., Dandouras, I., Vallat, C., Bavassano-Cattaneo, M. B., Klecker, B., Korth, A., Kistler, L. M., and McCarthy, M.: Outflowing protons and heavy ions as a source for the sub-keV ring current, Ann. Geophys., 27, 839–849, doi:10.5194/angeo-27-839-2009, 2009.
Horwitz, J. L. and Chappell, C. R.: Observations of warm plasma in the dayside plasma trough at geosynchronous orbit, J. Geophys. Res., 84, 7075–7090, doi:10.1029/JA084iA12p07075, 1979. Kistler, L. M., Mouikis, C. G., and Genestreti, K. J.: In-flight
Cal-ibration of the Cluster/CODIF sensor, Geosci. Instrum. Method. Data Syst. Discuss., 3, 221–250, doi:10.5194/gid-3-221-2013, 2013.
Kovrazhkin, R. A., Sauvaud, J.-A., and Delcourt, D. C.: INTERBALL-Auroral observations of 0.1–12 keV ion gaps in the diffuse auroral zone, Ann. Geophys., 17, 734–742, doi:10.1007/s00585-999-0734-9, 1999.
Lennartsson, W., Shelley, E. G., Sharp, R. D., Johnson, R. G., and Balsiger, H.: Some initial ISEE-1 results on the ring current com-position and dynamics during the magnetic storm of December 11, 1977, Geophys. Res. Lett., 6, 483–486, 1979.
McIlwain, C. E.: Substorm injection boundaries, in: Magneto-spheric Physics, edited by: McCormac, B. M., 143–154, D. Rei-del, Hingham, Mass, 1974.
McIlwain, C. E.: Auroral electron beams near the magnetic equator, in: Physics of the Hot Plasma in the Magnetosphere, edited by: Hultqvist, B. and Stenflo, L., 91–112, Springer, New York, 1975. Nakano, S.: Solar activity dependence of two types of east-west ge-omagnetic disturbances at mid latitudes, Adv. Polar Upper At-mos. Res., 18, 23–34, 2004.
Newell, P. T. and Meng, C. I.: Substorm introduction of 1 keV mag-netospheric ions into the inner plasmasphere, J. Geophys. Res., 91, 11133–11145, 1986.
Olsen, R. C., Shawhan, S.D., Gallagher, D. L., Green, J. L., Chap-pell, C. R., and Anderson, R. R.: Plasma observations at the Earth’s magnetic equator, J. Geophys. Res., 92, 2385–2407, doi:10.1029/JA092iA03p02385, 1987.
Quinn, J. M. and McIlwain, C. E.: Bouncing ion clusters in the Earth’s magnetosphere, J. Geophys. Res., 84, 7365–7370, 1979. R`eme, H., Aoustin, C., Bosqued, J. M., Dandouras, I., Lavraud, B., Sauvaud, J. A., Barthe, A., Bouyssou, J., Camus, Th., Coeur-Joly,
O., Cros, A., Cuvilo, J., Ducay, F., Garbarowitz, Y., Medale, J. L., Penou, E., Perrier, H., Romefort, D., Rouzaud, J., Vallat, C., Alcayd´e, D., Jacquey, C., Mazelle, C., d’Uston, C., M¨obius, E., Kistler, L. M., Crocker, K., Granoff, M., Mouikis, C., Popecki, M., Vosbury, M., Klecker, B., Hovestadt, D., Kucharek, H., Kuenneth, E., Paschmann, G., Scholer, M., Sckopke, N., Seiden-schwang, E., Carlson, C. W., Curtis, D. W., Ingraham, C., Lin, R. P., McFadden, J. P., Parks, G. K., Phan, T., Formisano, V., Amata, E., Bavassano-Cattaneo, M. B., Baldetti, P., Bruno, R., Chion-chio, G., Di Lellis, A., Marcucci, M. F., Pallocchia, G., Korth, A., Daly, P. W., Graeve, B., Rosenbauer, H., Vasyliunas, V., Mc-Carthy, M., Wilber, M., Eliasson, L., Lundin, R., Olsen, S., Shel-ley, E. G., Fuselier, S., Ghielmetti, A. G., Lennartsson, W., Es-coubet, C. P., Balsiger, H., Friedel, R., Cao, J.-B., Kovrazhkin, R. A., Papamastorakis, I., Pellat, R., Scudder, J., and Sonnerup, B.: First multispacecraft ion measurements in and near the Earth’s magnetosphere with the identical Cluster ion spectrometry (CIS) experiment, Ann. Geophys., 19, 1303–1354, doi:10.5194/angeo-19-1303-2001, 2001.
Sauvaud, J.-A., Crasnier, J., Mouala, K., Kovrazhkin, R. A. and Jor-jio, N. V.: Morning sector ion precipitation following substorm injections, J. Geophys. Res., 86, 3430–3438, 1981.
Sheldon, R. B. and Spence, H. E.: Alfv´en boundaries: Noses and zippers, Adv. Space Res., 20, 445–448, 1997.
Vallat, C., Ganushkina, N., Dandouras, I., Escoubet, C. P., Taylor, M. G. G. T., Laakso, H., Masson, A., Sauvaud, J.-A., R`eme, H., and Daly, P.: Ion multi-nose structures observed by Clus-ter in the inner Magnetosphere, Ann. Geophys., 25, 171–190, doi:10.5194/angeo-25-171-2007, 2007.
Woch, J. and Lundin, R: The low-latitude boundary layer at mid-altitudes: Identification based on Viking hot plasma data, Geo-phys. Res. Lett., 20, 979–982, 1993.
Yamauchi, M. and Lundin, R.: Sub-keV ring current ions as the tracer of substorm injection, Ann. Geophys., 24, 355–366, doi:10.5194/angeo-24-355-2006, 2006.
Yamauchi, M., Lundin, R., Eliasson, L., and Norberg, O.: Meso-scale structures of radiation belt/ring current detected by low-energy ions, Adv. Space Res., 17, 171–174, 1996.
Yamauchi, M., Brandt, P. C., Ebihara, Y., Dandouras, I., Nilsson, H., Lundin, R., Reme, H., Vallat, C., Lindquvist, P.-A., Balogh, A., and Daly, P. W.: Source location of the wedge-like dispersed ring current in the morning sector during a substorm, J. Geophys. Res., 111, A11S09, doi:10.1029/2006JA011621, 2006.
Yamauchi, M., Dandouras, I., Daly, P. W., Stenberg, G., Frey, H. U., Lindqvist, P.-A., Ebihara, Y., Nilsson, H., Lundin, R., R`eme, H., Andr´e, M., Kronberg, E. A., Balogh, A., and Hen-derson, M.: Magnetospheric solitary structure maintained by 3000 km/s ions as a cause of westward moving auroral bulge at 19 MLT, Ann. Geophys., 27, 2947–2969, doi:10.5194/angeo-27-2947-2009, 2009a.