IJPAR |Vol.6 | Issue 4 | Oct- Dec-2017 Journal Home page: www.ijpar.com
Research article
Open Access
Development and validation of the quantitative analysis of amlodipine
besylate in tablet formulation by fourier transform infrared spectroscopy
Shital Dange*
1, Tukaram Kalyankar
2, Shailesh Wadher
2, Sai Priyanka
1 1Department of Pharmaceutical Analysis, Sree Dattha Institute of Pharmacy, Hyderabad.
2Department of Quality Assurance, School of Pharmacy, Swami Ramanan d Teerth Marathwada
University, Nanded- 431605, Maharashtra, India.
*Corresponding Author: Mrs. Shital Dange Email:[email protected]
ABSTRACT
A simple, precise, non destructive, rapid, and inexpensive, ecofriendly and reproducible FTIR spectrophotometric method for quantitative determination of amlodipine besylate in tablet formulation was developed and validated. This method concerned with absorbance measurements of bands corresponding to c=o stretch centered by 1731-1687 cm-1. Analytical method validation was carried out to study the parameters as linearity, repeatability, precision, accuracy as well as photo degradation study. The linearity range was found to be 0.3-1.8 % w/w (regression equation: Y=0.585x-0.044, r2 = 0.994). The data show good precision results of this method, since the RSD values observed less than 2 % as per ICH limits. The proposed FTIR m ethod was successfully applied to the assay of amlodipine besylate in tablet formulation.
Keywords:
Fourier Transform Infrared Spectroscopy, Quantitative Determination, Quality Control, Amlodipine Besylate.INTRODUCTION
Chemically, Amlodipine Besylate (AB) (CAS No. 111470-99-6), 3-ethyl-5-methyl (4RS)-2-[(2-aminoethoxy) methyl]-4-(2-chloro phenyl)-6-methyl-1, 4-dihydropyridine-3,5-dicaboxylate benzene sulphonate(empirical formula C20H25ClN2O5.C6H6SO3) is a second generation 1,4-dihydropyridine derivative of the prototypical molecule Nifedipine and used in treatment of chronic stable angina and in the management of
mild to moderate essential hypertension as antihypertensive.[1]
Many methods reported in literature for determination as UV spectrophotometric method
[2-24]
, UV-RP-HPLC[25], UV-TLC[26], UV-HPTLC[27], RP-HPLC[28-36], Stability indicating HPLC[37,38], TLC-HPTLC[39], LC-MS/MS[40], Stability indicating LC[41]and FTIR-Raman-NMR[42], but no such method available for its determination using Fourier Transform Infrared Spectroscopy. Hence the endeavor was made to develop ecofriendly,
Figure 1: Chemical structure of amlodipine besylate
EXPERIMENTAL
Chemicals and reagents
Standard sample of AB was obtained as gift from Lupin Limited, Aurangabad, and (MH) India. For recording spectra, IR spectroscopic grade of KBr obtained from Merck KGaA, Germany. Single dosage form and combination tablets (5mg dose) of different brands were procured from local market of Nanded, (MH) India.
FTIR Instrumentation
FTIR analyses were carried out on IR Affinity-1 (00722) FTIR spectrophotometer, (Shimadzu, Japan) with IR Solution 1.50 version of software for data analysis DLATGS detector with ceramic light source of high luminance. KBr disc spectra recorded in mid IR region 4000cm-1 and 400cm-1, with average 45 scans having resolution of 4cm-1. To carry out the forced photo degradation study, photochemical reactor (Shrinivasan Griffin-Rayonet type) was used.
Calibration curve
Different six concentrations of AB individually prepared in range of 0.3-1.8% w/w for calibration curve. Specific quantity of API diluted with 1000mg KBr and triturated by maintaining homogeneity.
Recovery Efficiency and Method validation
Developed method was validated for its accuracy by addition of known concentration of API to pharmaceutical sample (80, 100, 120% w/w) then total concentration estimatated by developed
method. Reproducibility studied for pure drug in set of sixes and interferences studies for excipients with API in tablet dosage form also carried out. The API and excipients extracted from tablets with help of chloroform. The developed method indicates no interference of excipients in tablet formulation with pure drug.
Accuracy
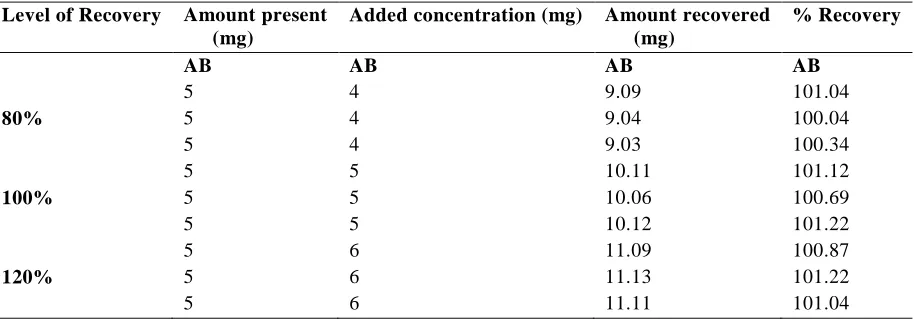
Standard addition method was applied with recovery of pure drug from excipients at three different quantities (80, 100, 120% w/w) to the tablet powder of Amlogold-5 (pure AB) and Amlopress L 5/5 (combination) for each tablet as 1% w/w dilution into potassium bromide in triplet. The sample homogeneity maintained.
Linearity
Linearity of the method studied for six samples of different concentration range 0.3-1.8% w/w. Calibration curve linearity assessed by the linear regression line equation for both API.
Precision
Repeatability for API (In single of each) was studied with pure API at 1% w/w concentration six times on same day (Intraday). Intermediate precision assessed for precision of pharmaceutical formulations on interday.
Analysis of Marketed Tablet Formulations
Five different brands of single dose of AB (Amlogold-5, Amlovas-5, Amodep, Amloz, and Amlokind) were used for estimation of drug content. 20 tablets were weighed and average
weight determined then triturated to fine powder. Appropriate amount of each tablet diluted to potassium bromide for getting 1% w/w concentration. Readings were taken in triplets.
Interference study
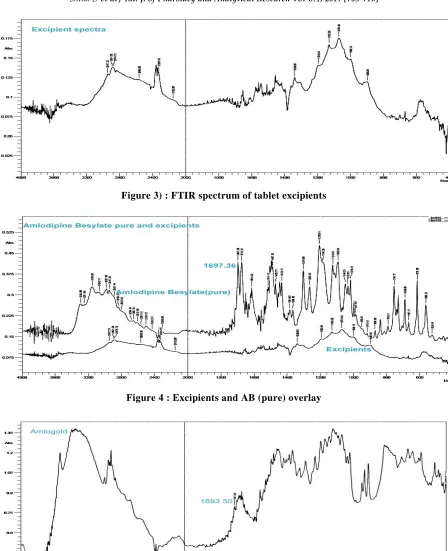
Literature revealed that no such method reported for AB. No sample pretreatment, no use of hazardous chemicals, less time consuming with no requirement of special efficiency. The effect of other components commonly excipients analyzed in pharmaceutical formulation for these studies. Excipients and API separated from marketed preparation of different brands mentioned above with chloroform and spectra were taken. AB and its standard had no interference with absorption bands present in mixture. Fig. 2.
RESULT AND DISCUSSION
The FTIR spectrum for pure sample of amlodipine besylate exhibited absorbance bands in the range of 750, 1715, 1650, 1697, 1735, 1375, 3500-3100, 1100, 3500-3100, 1600-1450, and 1300-1000 cm−1. The low-intensity absorbance bands arising from AB was not much affected by dilution in dry potassium bromide; therefore, in the present study we have used dry potassium bromide as the diluent.
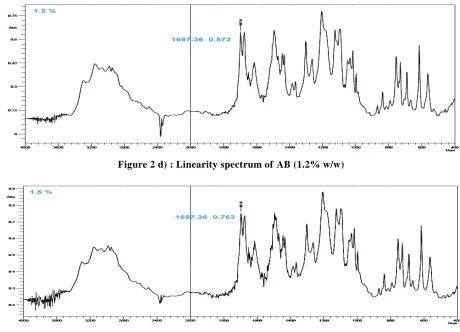
The most prominent absorbance band corresponding to the carbonyl group centered in the range of 1731-1687 cm−1 for the diluted samples of AB in dry potassium bromide was within the 2.0 absorbance units. The absorbance spectra for the
diluted AB samples of various concentrations are shown in Figure 2a-2f.
The peak height (intensity) for the peak centered in the range of 1731-1687 cm−1 for AB was used for the preparation of calibration curve as shown in Figure 4. The calibration curve is described by the equation 𝑦 = c + 𝑏𝑥, where 𝑦 represents peak area and 𝑥 represents concentration of drugs (AB). Initially the samples in the concentration range of 0.5–5.0% w/w, 1-6% w/w, 2-24% w/w were analyzed to determine the linearity.
The calibration curve with good linearity was established ranging from 0.3 to 1.8% w/w for amlodipine besylate in potassium bromide. The corresponding linear regression equation for AB was 𝑦 = - 0.099+0.585x and the correlation coefficient for calibration curve was 0.994 for each drug (AB) (Table 1).
The FTIR spectrum in Figure 3 and 4 indicates that there is no interference of excipients used in the formulation of tablet dosage form.
Five different brands of amlodipine besylate (Figure 5, Table 10, 11) were analyzed using the developed method. The average recoveries of AB and their all the formulations were in the range of not less than 90 % and not more than 110 % as per USP acceptable limits and the % RSD values were in the range of 0.2 -0.5 (i.e. < 2) respectively, The % recovery of label claim was in good agreement and within the acceptable limits of the USP (not less than 90.0 % and not more than 110.0 % of the stated amount of AB)
Figure 2 a) : FTIR Spectrum of Amlodipine Besylate (0.3% w/w)
Figure 2 b) : Linearity spectrum of AB (0.6 % w/w)
Figure 2 d) : Linearity spectrum of AB (1.2% w/w)
Figure 2) e : Linearity spectrum of AB (1.5 % w/w)
Figure 3) : FTIR spectrum of tablet excipients
Figure 4 : Excipients and AB (pure) overlay
Figure 6: FTIR spectra for Amodep-5 tablet (5 mg label claim)
Figure 7 : FTIR spectra for Amlokind-5 tablet (5 mg label claim)
Figure 9: FTIR spectra for Amloz-5 tablet (5 mg label claim)
Table 1: Linear Regression Data For Amlodipine Besylate
Parameters AB
Wave number (cm-1) 1697 cm-1
Linearity range (% w/w) 0.3-1.8% Limit of detection (% w/w) 0.0059 Limit of quantitation
(% w/w)
0.01789
𝑦 𝑥 Y=0.585x-0.044
Slope 0.585
Intercept 0.044
Regression coefficient R2 0.994
Table 2: Statistical validation: analysis of tablet formulation Name of the drug Mean* SD* % RSD*
AB 99.86 0.242212 0.242535
* Indicates average of six determinations
Table 3 : Linear regression data for calibration curve of AB Name of the drug Linearity range (% w/w) R2 Slope Intercept
AB 0.3-1.8 % 0.994 0.585 -0.099
Table 4 : Precision data of marketed formulation (Amlogold-5) Sr. No. Interval of Time Concentration
(% w/w)
% Recovery
AB AB
I 5 100.17
II Day 1 5 100.52
III 5 101.13
I 5 100.34
II Day 3 5 100
Table 5 : Statistical validation of intra-day precision data Name of the drug Mean* SD* % RSD*
AB 100.60 0.485 0.482
* Indicates average of six determinations
Table 6 : Statistical validation of inter-day precision data Name of the drug Mean* SD* % RSD*
AB 100.286 0.264 0.263
* Indicates average of six determinations
Table 7: Statistical data for repeatability of AB Name of the drug Mean* SD* % RSD*
AB 99.93 0.282518 0.282693
* Indicates average of six determinations
Table 8: Recovery study data Level of Recovery Amount present
(mg)
Added concentration (mg) Amount recovered (mg)
% Recovery
AB AB AB AB
5 4 9.09 101.04
80% 5 4 9.04 100.04
5 4 9.03 100.34
5 5 10.11 101.12
100% 5 5 10.06 100.69
5 5 10.12 101.22
5 6 11.09 100.87
120% 5 6 11.13 101.22
5 6 11.11 101.04
Table 9: Statistical validation of recovery study data Level of Recovery % Mean Recovery * SD* % RSD*
AB AB AB
80% 101.80 0.0321 0.355
100% 101.01 0.0321 0.318
120% 101.04 0.02 0.180
* Indicates average of three determinations
Table 10: LOD & LOQ
Name of the drug LOD (% w/w) LOQ (% w/w)
AB 0.059 0.017
Table 11: Statistical data for analysis of different brands of AB
BRANDS % RECOVERY % LABEL CLAIM
useful technique for qualitative and quantitative analysis of solid-state pharmaceuticals. The development and validation of eco-friendly FTIR method for the quantitation of solid-state API and its successful application to pharmaceuticals. This new approach of using transmission FTIR for direct determination of amlodipine besylate in pharmaceutical preparations where several excipients are present provides an alternate to expensive and time consuming procedure. The proposed FTIR method is simple, accurate, precise, validate ecofriendly and reproducible. It can be used for referring quality control analysis of
Educational Institution, Ibrahimpatnam. Hyderabad for providing required support in carrying the research work. I would like to express my special thanks to Dr. S. A. Sreenivas, Principal Sree Dattha Institute of Pharmacy, Ibrahimpatnam. Hyderabad, Telangana, India.
CONFLICT OF INTERESTS
The authors declared that there is no conflict of interests in the publication of the paper.
REFERENCES
[1]. Wilson, C. O., Gisvold, O., Cardiovascular agents, Textbook of Organic Medicinal and Pharmaceutical Chemistry, Block, J. H., Beale, J. M., Philadelphia, Lippincott Williams and Wilkins, l.1, 2004, 19. [2]. Mishra, P., Gupta, A., and Shah, K.,Indian J. Pharm. Sci., 69, 6, 831-833.
[3]. Bhatia, M.S., Kumbhar, S. T., Jadhav, S. D., and Bhatia, N. M., Int. J. Pharm. Pharm. Sci., 3(4), 2011, 195-197.
[4]. Patil, P. R., Rakesh, S. U., Dhabale, P. N., andBurade, K. B., Res. J. Pharm. Technol. 2(2), 2009, 304-307.
[5]. Chaudhari, B. G., Int. J. Pharm. Chem. Biol. Sci., 2(4), 2012, 626-632.
[6]. Misra, M., Kavathia, A., and Suchak. K., Int. J. Pharm. Pharm. Sci., 5(3), 2013.
[7]. Hassan, S. A., Darwish, H. W., Salem, M. Y., and El-Zeany, B. A., Int. J. Spectrosc., 2013, Article ID 273102, 1-8. doi.org/10.1155/2013/273102
[8]. Basnet, N. S., andAryal, S.,Acta Pharm, 58, 2008, 299–308. Doi.10.2478/v10007-008-0012-5.
[9]. Misra, M., Kavathia, A., andSuchak, K., Int. J. Pharm. Pharma. Sci., 5(3), 2013, 371-375. [10]. Chaudhary, J., Jain, A., Kaur, N., andSaini, V., Int. J. Pharm. Pharm. Sci., 4(3), 2012, 191-194. [11]. Patel, A., Int. J. Pharm. Bio. Sci., 4(3), 2013, 379 – 391.
[12]. Chaudhari, B. G., Int. J. Pharm. Chem. Biol. Sci., 2(4), 2012, 626-632.
[13]. Patil, P., Barge, V., More, H., andPiswikar, S., Int. J. Curr. Pharm. Res., 3(2), 2011, 74-79. [14]. Saraf, S., Garg, G., and Saraf, S., Trend. Appl. Sci. Res., 3(3), 2008, 278-284.
[15]. Jaina, N., Jaina, R., Jain, A., Pandeyc, S. P., andJainc, D. K., Eurasian J. Anal. Chem., 5(3), 2010, 212-217.
[16]. Chaudhari, B. G., Patel, A. B., Int. J. Chemtech. Res., 2(1), 2010, 633-639.
[18]. Thomas, A. B., Jagdale, S. N., Dighe, S. B., and Nanda, R. K., Int. J. Pharmtech. Res., 2(2), 2010, 1334-1341.
[19]. Muthu, A. K., Sankala, R., Prasad, C. S., Kumar, D. S., andManavalan, R., Int. Res. J. Pham, 2(5), 2011, 175-180.
[20]. Patil, P. R., Rakesh, S. U., Dhabale, P. N., andBurade, K. B., Asian J. Res. Chem., 2(1), 2009, 183-187. [21]. Patil, P. R., Rakesh, S. U., Dhabale, P. N. andBurade, K. B, Res. J. Pham. Technol., 2(2), 2009,
304-307.
[22]. Rathee, P., Rathee, S., Thakur, S., and Kumar, V., Int. J. ChemTech. Res., 2(1), 2010, 62-68. [23]. Vichare, V., Tambe, V., Kashikar, V., and Dhole, S. N., Int. J. Chem. Res., 2(1), 7-10.
[24]. Pawar, P. Y., Joshi, R. S., Sandhan, V., Wagh, S., andJangale, K., Der Pharm. Lett., 3(3), 2011, 397-403.
[25]. Amin, A., and Parikh, N., Int. J. Pharm. Res. Biosci., 1(3), 2012, 204-219.
[26]. Baheti, K. G., andSwagatika, P., Int. J. Adv. Pharm. Biol. Sci., 2(2), 2012, 155-164. [27]. Kavathia, A., andMisra, M., Arabian J. Chem., 2013.
[28]. Patel, D. B., Mehta, F. A., and Bhatt, K. K., Novel Sci. Int. J. Pharm. Sci., 1(2), 2012, 74-82.
[29]. Lakshmi, K. S., and Lakshmi, S., J. Anal. Methods Chem., 2012, Article ID 108281, 5. doi:10.1155/2012/108281
[30]. Vora, D. N., andKadav, A. A., Indian J. Pharm. Sci., 70(4), 2008, 542-546.
[31]. Altınoz, S., Celebier, M., Kaynak, M. S., andSahin, S., Braz. J. Pharm. Sci., 46(4), 2010, 761-768. [32]. Islam, S. M. A.,Haque, M. A., Naznin, A., Hamidul, A.N.M, andHossain, M. K., Dhaka Univ. J.
Pharm. Sci., 9(2), 2010, 131-138.
[33]. Patil, P. S., More, H. N., andPishwikar, S. A., Int. J. Pharm. Pharm. Sci., 3(3), 2011, 146-149.
[34]. Shabana, M. K., Chapala, D., Puttagunta, and Babu, S., Int. Res. J. Pham., 4(8), 2013, 177-183. DOI:10.7897/2230-8407.04 835.
[35]. Baokar, S. B., Erande, R. S., andShaikh, S. G., Indo Am. J. Pharm. Res., 2(1), 2011, 100-110. [36]. Tengli, A. R., Gurupadayya, B. M., andSoni, N., Int. J. Chem. Anal. Sci., 4, 2013, 33-38.
[37]. Patil, P. R., Rakesh, S. U., Dhabale, P. N., andBurade, K. B., Int. J. ChemTech Res., 1(3), 2009, 464-469.
[38]. El-Gizawy, S. M., Abdelmageed, O. H., Omar, M. A., Deryea, S. M., and Abdel-Megied, A. M., Am. J. Anal. Chem., 3, 2012, 422-430. doi.org/10.4236/ajac.2012.36055.
[39]. Eranki, R. J. V., Inti, G., Jayaraman, V., Vidiyala, S. R., andSreeramulu, J., ISRN Med. Chem., 2013, Article ID 178269, 1-9. doi.org/10.1155/2013/178269
[40]. Shingare, M. S., Naidu, K. R., and Kale, U. N., J. Pharm. Biomed. Anal., 39, 2005, 147–155.
[41]. Shah, D. A., Bhatt, J. U., Bhatt, K. K., Baldania S. L., and Chhalotiya, U. K., Novel Sci. Int. J. Pharm. Sci., 1, 2012, 33-39.
[42]. Ponnerid, V., Ravia, V. B., Inamadugu, J. K., Pilli, N. R., and Sreenivasuluc, V., J. Pharm. Anal., 2(5), 2012, 319–326.
[43]. Shinde, D. B., Patil, K. R., Rane, V. P., Sangshetti, J. N., andYeole, R. D., J. Chromatogr. Sci., 48, 2010, 601-606.
[44]. Szabo, L., Chis, V., Pirnau, A., Leopold, N., Cozar, O., andOrosz, S., J. Mol. Struct., 2009, 924-926, 385-392.
[45]. Sherazi, S. T. H., Ali, M., and Mahesar, S. A., Vib. Spectrosc. 55(1), 2011, 115-118. doi:10.1016/j.vibspec.2010.09.010
[46]. Mahesar, S. A., Bendini, A., Cerretani, L., Carboginin, M. B., and Sherazi, S. T. H., Eur. J. Lipid Sci. Technol., 2010, vol. 112, no. 12, p. 1356-1362. doi:10.1002/ejlt.201000388
[47]. European Pharmacopoeia, 2002. [48]. United States Pharmacopoeia, 2002.
[49]. Matkovic, S. R., Valle, G. M., and Briand, L. E., Latin Am. Appl. Res., 35, 2005, 189-195. [50]. European Pharmacopoeia, 5, 2005.
[51]. Qasim, B. H., J. Eng. Technol., 28(15), 2010, 1-5.Eng.
and Products. 2000


![Crystal structures of an imidazo[1,5 a]pyridinium based ligand and its (C13H12N3)2[CdI4] hybrid salt](data:image/gif;base64,R0lGODlhAQABAIAAAP///wAAACH5BAEAAAAALAAAAAABAAEAAAICRAEAOw==)