Fredy Siegrist, Thomas Singer, and Ulrich Certa
Abstract
MicroRNAs are positive and negative regulators of eukaryotic gene expression that modulate transcript
abundance by specific binding to sequence motifs located prevalently in the 3′untranslated regions of
target messenger RNAs (mRNA). Interferon-alpha-2a (IFNα) induces a large set of protein coding genes mediating antiproliferative and antiviral responses. Here we use a global microarray-based microRNA
detection platform to identify genes that are induced by IFNαin hepatoma- or melanoma-derived human
tumor cell lines. Despite the enormous differences in expression levels between these models, we were
able to identify microRNAs that are upregulated by IFNαin both lines suggesting the possibility that
interferon-regulated microRNAs are involved in the transcriptional repression of mRNA relevant to cytokine responses.
Key words: MicroRNAs, Oligonucleotide Array Sequence Analysis, Interferons, Melanoma,
Hepato-ma, Reverse Transcriptase Polymerase Chain Reaction, Suppressor of Cytokine Signaling Proteins.
1. Introduction
The gene expression patterns of tumor-derived cell lines differ greatly, as do their responses to antiproliferative effects of interferons (IFNs). The cause of this variation has been under investigation for more than 40 years, but only basic regulatory mechanisms of interferon signal-ing are understood today. Small regulatory genome encoded RNAs, such as microRNAs, have recently attracted attention in genomic research. New methods to analyze the levels of these regulatory elements are now commercially available, but the power of these techniques is still discussed extensively. Our study was
Shulin Li (ed.),Biological Procedures Online, Volume 11, Number 1
© to the author(s) 2009
DOI: 10.1007/s12575-009-9012-1 URL:springerprotocols.com; springerlink.com
designed to compare two methods for microRNA detection with respect to usefulness in defined cell culture assays. The experimental design assesses variation between the two cell lines and the treatment effects of IFNα.
A hallmark of the therapeutic activity of type I interferons is the induction of antiproliferative activity mediated by the upregulation of several hundred response genes with pleiotropic functions (1). These genes can be divided into two major classes based on the kinetic properties of induction (2). Primary response genes (PRGs) are upregulated within 24 h after the cytokine signal and the secondary response genes (SRGs) are induced following day1 when the activity of the PRGs decays. In contrast to SRGs, all PRGs studied to date contain bona fide interferon response elements in the promoter region, which are required for binding of the interferon-stimulated gene factor 3 (ISGF3) complex and for janus kinase/signal transducer of transcription (JAK/STAT)-pathway-mediated signaling.
Expression of PRGs is turned off by proteins termed suppressors of cytokine signaling (SOCS) (3). As the nomenclature indicates, this class of polypeptides has the capacity to interfere and silence other cytokine-induced signaling cascades (for reviewsee(4)). SOCS1 for instance is part of the early inducible PRG cluster and down modulation occurs together with the other genes before onset of SRG expression. It is believed that feedback inhibition of JAK/ STAT signaling by SOCS1 represses transcriptome modulation of IFNα signaling (5). Regulation of SOCS protein translation by interferon-regulated microRNAs (IRmiRs) would enhance the potential of cytokine fine regulation. It has been reported that miR-19 antagonists lead to higher SOCS1 levels and miR-19 mimics can repress SOCS1 reporter constructs, thus obviously supporting the bioinformatic predictions that SOCS1 is a direct target of miR-19 (6). Inhibition of SOCS activity could for instance prolong the duration of cytokine activity, which has obvious clinical implications.
stimulation can boost microRNA levels in cell culture together with inhibition of viral replication (9). At this point it is an open question whether this induction is IFNβ specific or a shared feature of all type I interferons. To investigate whether microRNA are also involved in regulation of IFNα response, we used two human-tumor-derived cell lines: the melanoma line ME-15 (10) and the hepatoma line HuH7 (11). We have chosen these cell lines as models, because we have a good understanding of the IFNα responses at the mRNA and the protein levels in these cell lines. Further we chose to use a melanoma cell line because IFN is also used for treatment of this cancer type. HuH7 is commonly used as a model for testing antiviral effects of IFN in the HCV replicon system. In both models efficient responses to IFNα have been shown at the functional and transcriptional level. IFNα response genes carry response elements in their promoter region and these motifs are responsible for gene expression with similar efficiency in many cell types. Therefore we expected to find a similar regulated set of genes in both lines given that IRmiR genes are regulated by the same mechanism, whereas some constitutively expressed microRNA genes were expected to be cell type specific for functional reasons. We have chosen a DNA-microarray-based technology (Illumina) for the multi-parallel expression analysis of all known human microRNAs (http://microrna.sanger.ac.uk/; Release 10.0: August 2007). This method allowed us to process total RNA as template, allowing the possibility of mRNA gene expression profiling in further experiments. Briefly, annealing of microRNA specific primers combined with enzymatic polyadenylation allows multi-parallel polymerase chain reaction (PCR)-mediated amplification of individual microRNAs. The output of this step is a DNA amplicon library that reflects to a large extent the original stoichiometry of mature microRNAs in a cell or tissue (12). PCR amplification is performed with fluorescently labeled primers, which allows quantitative signal detection by conventional confocal laser scanning.
2. Materials
and Methods
2.1. Cell Culture, Interferon Treatment, and RNA Precipitation
(GIBCO®). Roferon (Interferon alpha2a, ROCHE) was diluted in fresh medium to a final concentration of 1,000 U/mL and control cultures were grown without cytokine. Cells were cultured at 37°C in a humidified atmosphere containing 5% CO2. Total RNA
preparation was carried out using TRIZOL (Invitrogen) total RNA extraction using 1/2 volume of 1-bromo-3-chloro-propane (molecular biology grade, SIGMA) as chloroform substitute. For efficient recovery of small RNAs, DNA LoBind tubes (Eppendorf) were used and all centrifugation steps were performed at maximum speed and 4°C in an Eppendorf 5417R centrifuge. Total RNA was precipitated with 2 vol of 2-propanol (Fluka) at−20°C for at least 16 h. The RNA pellet was washed with 75% ethanol (Merck), dried, and dissolved in DEPC-treated water (Ambion). The RNA was quantified with Quant-iT™RiboGreen® RNA Assay (Invitrogen) as suggested by Illumina.
2.2. Illumina Bead Array MicroRNA Detection
Starting with 500 ng/sample of total RNA, mature microRNAs were amplified with the Illumina human v1 MicroRNA expression profiling kit containing primers for 743 human microRNAs. The resulting amplicons were hybridized to a 96 sample universal probe capture array and fluorescent signals were detected by confocal laser scanning. All steps were performed according to Illumina’s instructions manual.
2.3. Data Processing and Statistical Analysis
The data was processed with Beadstudio software (version 3.1.3, gene expression module 3.3.8) including the calculation of detection pvalues based on negative control bead signals. Log-transformation, loess normalization (13) and statistical analysis were performed with R (2.8.1) (14) using the package lumi (1.8.3) (15) and software contained therein, in particular limma (2.16.4) (16). Statistical models were chosen as follows: a linear model (limmatstatistics) with two separate coefficients for HuH7 and ME-15 cells was used for the selection of differently expressed genes shown in Fig.1and Table1. Statistics represented in the tables were calculated by testing the two indicated conditions as independent factors. In Table1,pvalues were adjusted by the false discovery rate method (17). Treatment effects shown in Table2band Fig.3awere modeled with two coefficients (cell line, treatment) for time point 4 h,pvalues arise fromtstatistics. Normalized relative fluorescence levels were calculated by 2^mean (of log2 transformed, loess normalized values). Change factors (CHF) were calculated as fold change on the linear scale minus 1 as previously described (2). Raw data, non-normalized, and normalized microRNA expression data have been submitted to the Gene Expres-sion Omnibus with accesExpres-sion number GSE16421.
2.4. Quantitative PCR and Data Processing
mix (No AmpErase® UNG) as recommended by the supplier. Ten nanograms of total RNA was used as input for amplification using the samples used for microarray analysis. Reversed transcriptase products were diluted 1:15 and measured on an ABI 7900HT fast real-time PCR system. Technical replicates were run on three different plates (one with 40 cycles and two with 50 cycles) and threshold for cycling time (CT) calculation was set for all probes to 0.2. For estimation of endogenous small RNA content, the nucleolar RNA RNU48 was used as control and reference.
Standard error (Δx) was calculated by the average standard error of treated and untreated MNE for biological replicates.
3. Results
and Discussion
The following technical aspects have to be considered for result interpretation. The dataset of the microRNA bead array assay is not directly comparable to gene expression arrays where in vitro translated transcripts are directly hybridized to the probes. Moreover Illumina’s bead array technology tends to have higher background fluorescence levels and lower change factor values than Genechips from Affymetrix. Background (average of negative control signals) and noise (standard deviation of negative probes from each sample) were 528±60 and 229±67, respectively. The density of all samples shows a bimodal distribution peaking around the background fluorescent levels and the robust levels (approximately 12,000). The curve is skewed to the right and peak density height is found in the ratio 4:1 considering all probes (data not shown). The distribution of probes detected in all samples (detectionpvalue
threshold at 0.01) has a plateau ranging from about 2,000 close to the detectors maximum capacity of 2^16 relative fluorescent units (12). As expected, the correlation of data coming from biological replicatesr²=0.952±0.028 (not normalized) andr²=0.956±0.022 (after loess normalization and log-transformation) was lower than for technical replicatesr²>0.97 (12). We preferred loess normaliza-tion to quantile normalizanormaliza-tion because the later was too aggressive for the given small probe numbers.
As a first step we wished to address the robustness of the micro-RNA array in probe detection by selecting micromicro-RNA genes that are detected under all experimental conditions with high statistical significance in all biological triplicates (detectionpvalueG0.01). In each set of triplicate samples (control, 4 h or 24 h, IFNαstimulation) we detect approximately 270 genes that fulfill the above criteria. This corresponds to roughly a third of microRNAs available for detection in the assay system. Furthermore, this result suggests indirectly that IFNαtreatment does not induce global changes in microRNA gene expression, but it modulates rather the expression of individual genes.
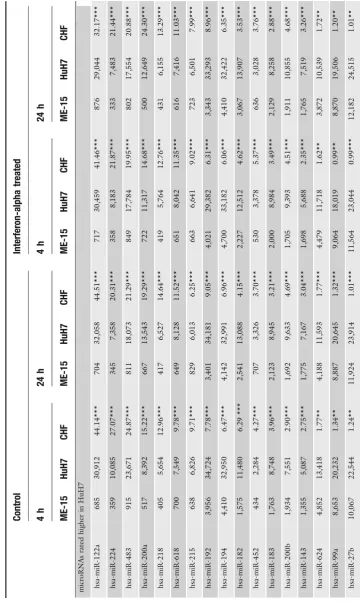
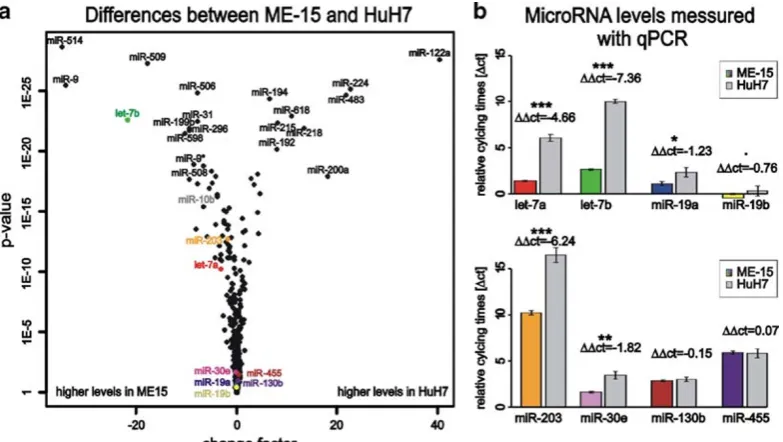
Today it is well established that microRNA expression patterns are cell and tissue type specific, which is consistent with a role in cell differentiation and biological function (8). Thus we expected to detect genes with preferential expression in either hepatoma or melanoma cells as these cell lines are derived from different tumors. Indeed, when all experimental conditions and data points are included in the data analysis about 150 micro-RNAs genes show preferential expression in either HuH7 or ME-15 cells (Fig.1). Table1shows the expression data for the most significant genes including change factors and significance score as reference. Among these differentially expressed genes there are three members of the let-7 family, which has properties of tumor suppressor genes (for reviewsee(18)). Therefore it is not surprising that the members of this well-known microRNA gene family are deregulated in the analyzed cancer cells too. Further-more, the different developmental stage of our cancer cell lines is expected to have left a genomic fingerprint where some micro-RNA genes are expressed in one but not the other cell line (19). Consistent with this, expression of some microRNAs is strictly cell type specific and barely detectable in the other cell type (Fig.2a), for example the liver-specific miR-122a and miR-192 (20).
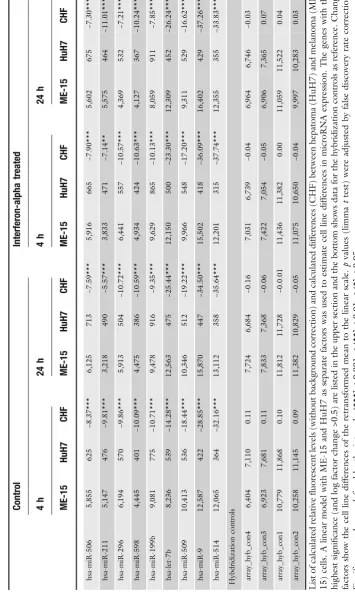
Bead-array-based microRNA detection technology, including the bio-statistic analysis, is currently not well established or widely used and we have applied a commercial PCR-based assay to con-firm the array data for some microRNAs that cover different ex-pression levels and change factors. In contrast to mRNA profiling, where RT-PCR-based assays are considered as gold standard for data validation, new generation deep sequencing is considered as the method of choice for microRNA quantification but is not available in our research institute. For the microRNAs let-7 a/b, miR-19 a/b, and miR-203, the PCR-based quantifica-tion method (Fig.2b) confirmed the direction of change found with microarray technology (Table2a). Expression of miR-130b and miR-455 was at similar levels in both assays. The correla-tion calculated for the eight tested microRNAs was acceptable: multiple r² from f test of mean relative cycling times (ΔCT) to mean log2 microarray expression values was 0.9279. Differences of absolute levels between the microRNA targets probably results from different hybridization properties of the microarray probes and variation in the performance of Taqman primers for the specific microRNA on the other side.
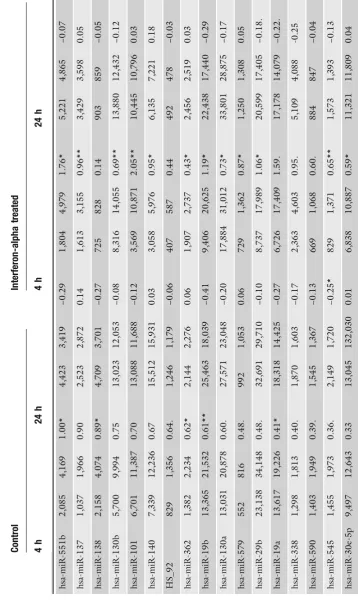
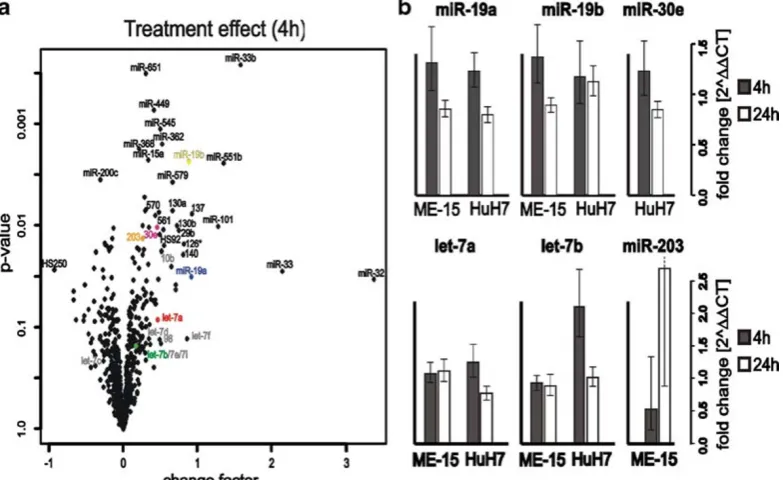
signaling seen for mRNAs. However, the maximal observed change factor with high significance was 1.84 (miR-33b in Table2b) which is clearly lower than the values seen for protein coding mRNAs (2). We also included an expression analysis 24 h after IFNαstimulation in order to detect microRNA genes that show either delayed induction or remain activated at comparable levels to the 4 h stimulus. Based on our data set, the majority of the microRNA response genes show no further induction, but rather moderate downregulation 24 h after induction. This finding is not surprising as we expected immediate early impact of IFNα-mediated primary signaling.
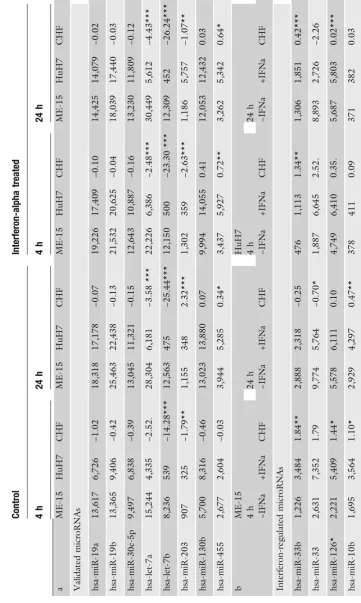
We also measured the IFNαresponse in the same experiment and for the same microRNAs (Table 2c). When we analyze the IFNα effect at the early time point in both cell lines we find all the validated microRNAs to be upregulated (Fig. 3a). The magnitude of upregulation and the basal expression levels of the microRNA-19a and 19b are similar in both cell lines (Fig.3b, top). This and the finding that miR-19 regulates SOCS1 (4) may be relevant for the regulation of cytokine signaling. let-7a and let-7b had higher levels in the melanoma-cell-line-derived samples compared HuH7, but the induction by IFNα in ME-15 could not be reproduced by RT-PCR (Fig.3b, bottom). In both assays accurate fold changes are difficult to calculate, if the baseline expression level is close to background noise or the detection limit. An example of a gene at the detection limit is miR-203, which is not detectable without IFNαtreatment in HuH7 cells (Table2c). Upon IFNαstimulation (24 h in HuH7) the microRNA is detectable above background suggesting minimal induction. Consequently a solid change factor cannot be calculated, which is consistent with the high variance obtained by qPCR (ME-15). This result is in fact not surprising, because both technologies rely on logarithmic PCR amplification of microRNA templates. At low expression levels, both technologies show relatively high variation in biological replicates, which should be considered for data interpretation. Interestingly, miR-203 has a putative binding site for ISGF3 in the promoter region, which would enable IFNα-dependent upregulation. miR-30 has been reported to be IFNβinducible, although the subclass measured was not specified by the authors (9). We decided to analyze the most promising candidate (miR-30e-5p) present in our microarray dataset (Fig.3ain gray). Detection of miR-30e failed in ME-15 cells due to technical problems, but induction in HuH7 was similar to miR-19a/b.
labeled during linear amplification by in vitro transcription. As a consequence, change factor calculations for amplicon-based assays are ambiguous.
In summary, Illumina’s bead array technology is well suited for multi-parallel profiling of microRNAs expressed in different cell types or tissues. We were also able to detect IFNα-inducible microRNA genes although the changes observed were moderate and biological significance remains to be proven. Like most microarray-based detection technologies the technical variability among identical samples is low compared to biological variations of individual cell cultures. At this point it is important to note that variation among biological samples occurs and is independent of the parameters that are measured. Consistent with IFNα -dependent induction of mRNAs we find that virtually all modulated microRNA genes are upregulated. However, the IFNα-induced changes detected in our study are relatively small compared to the changes induced by IFNβin HuH7 cells (9). Finally, it is noteworthy that IRmiRs have similar kinetic properties to their mRNA counter-parts. miR-10b for instance is induced early in ME-15 and remains upregulated, while miR-19 abundance ceases after 24 h. In general, the majority of IRmiR genes were reset to basal levels after 24 h and further studies are needed for kinetic classification. Thus, our study adds another level of complexity to the dynamic regulation IFNα signaling and other mechanisms like epigenetic promoter methyla-tion are currently under intense investigamethyla-tion in our laboratories.
Acknowledgements
We thank Dr. Guido Steiner and Andreas Buness (F. Hoffmann-La Roche Ltd.) for their support in bioinformatics and statistics, Dr. Martin Ebeling (F. Hoffmann-La Roche Ltd.) for the comparative genomic evaluation of microRNA-targeted transcripts and Prof. Dr. Giulio Spagnoli (University Hospital Basel) for the gift of the ME-15 melanoma cell line. Finally, we are grateful to Heather Hinton (F. Hoffmann-La Roche Ltd.) for critical reading of the manuscript and to Dr. Laura Suter-Dick (F. Hoffmann-La Roche Ltd.) for sharing lab space and introduction into GCP sampling.
References
1. Borden EC, Sen GC, Uze G, Silverman RH, Ransohoff RM, Foster GR et al (2007) Interferons at age 50: past, current and future impact on biomedicine. Nat Rev Drug Discov 6(12):975–990
2. Certa U, Wilhelm-Seiler M, Foser S, Broger C, Neeb M (2003) Expression modes of
interferon-alpha inducible genes in sensitive and resistant human melanoma cells stimulat-ed with regular and pegylatstimulat-ed interferon-alpha. Gene 315:79–86
trans-activity of immune effector cells are neg-atively regulated by suppressor of cyto-kine signaling proteins. J Immunol 178 (8):4832–4845
4. Yoshimura A, Naka T, Kubo M (2007) SOCS proteins, cytokine signalling and immune reg-ulation. Nat Rev Immunol 7(6):454–465 5. Song MM, Shuai K (1998) The suppressor
of cytokine signaling (SOCS) 1 and SOCS3 but not SOCS2 proteins inhibit interferon-mediated antiviral and antiproliferative activities. J Biol Chem 273(52):35056–35062 6. Pichiorri F, Suh SS, Ladetto M, Kuehl M, Palumbo T, Drandi D et al (2008) Micro-RNAs regulate critical genes associated with multiple myeloma pathogenesis. Proc Natl Acad Sci U S A 105(35):12885–12890 7. Bartel DP (2004) MicroRNAs: genomics,
biogenesis, mechanism, and function. Cell 116(2):281–297
8. Friedman RC, Farh KK, Burge CB, Bartel D (2009) Most mammalian mRNAs are conserved targets of microRNAs. Genome Res 19(1):92–105
9. Pedersen IM, Cheng G, Wieland S, Volinia S, Croce CM, Chisari FV et al (2007) Interferon modulation of cellular micro-RNAs as an antiviral mechanism. Nature 449(7164):919–922
10. Lüscher U, Filgueira L, Juretic A, Zuber M, Lüscher NJ, Heberer M et al (1994) The pattern of cytokine gene expression in freshly excised human metastatic melanoma suggests a state of reversible anergy of tumor-infiltrating lymphocytes. Int J Cancer 57(4):612–619
11. Nakabayashi H, Taketa K, Miyano K, Yamane T, Sato J (1982) Growth of human hepatoma cells lines with differentiated functions in chemically defined medium. Cancer Res 42(9):3858–3863
Luo S, Mikoulitch I et al (2008) Highly sensitive and specific microRNA expression profiling using BeadArray technology. Nucleic Acids Res 36(14):e87
13. Bolstad B, Irizarray R, Astrand M, Speed T (2003) A comparison of normalization methods for high density oligonucleotide array data based on bias and variance. Bio-informatics 19:185–193
14. R Development Core Team. R: A language and environment for statistical computing. Vienna, Austria: R Foundation for Statistical
Computing 2008. URL:
http://www.R-project.org
15. Du P, Kibbe WA, Lin SM (2008) Lumi: a pipeline for processing Illumina microarray. Bioinformatics 24(13):1547–1548 16. Smyth GK (2005) Limma: linear models
for microarray data. In: Gentleman R, Carey V, Dudoit S, Irizarry R, Huber W (eds) Bioinformatics and computational biology solutions using R and bioconductor. Springer, New York, pp 397–420
17. Benjamini Y, Hochberg Y (1995) Con-trolling the false discovery rate: a practical and powerful approach to multiple testing. J Roy Stat Soc B Stat Meth 57(1):289– 300
18. Roush S, Slack FJ (2008) The let-7 family of microRNAs. Trends Cell Biol 18(10): 505–516
19. Gaur A, Jewell DA, Liang Y, Ridzon D, Moore JH, Chen C et al (2007) Character-ization of microRNA expression levels and their biological correlates in human cancer cell lines. Cancer Res 67(6):2456–2468 20. Baskerville S, Bartel DP (2005)