World Maritime University
The Maritime Commons: Digital Repository of the World
Maritime University
World Maritime University Dissertations Dissertations
2000
Grain and fertilizer handling GBHL terminal : an
analysis of its impact on port fraternity and its post
effects on bulk traffic through the port of Mombasa
Evelyn Umazi Mwamure
World Maritime University
Follow this and additional works at:http://commons.wmu.se/all_dissertations
This Dissertation is brought to you courtesy of Maritime Commons. Open Access items may be downloaded for non-commercial, fair use academic purposes. No items may be hosted on another server or web site without express written permission from the World Maritime University. For more Recommended Citation
Mwamure, Evelyn Umazi, "Grain and fertilizer handling GBHL terminal : an analysis of its impact on port fraternity and its post effects on bulk traffic through the port of Mombasa" (2000).World Maritime University Dissertations. 137.
WORLD MARITIME UNIVERSITY
Malmö, SwedenGRAIN AND FERTILISER HANDLING - GBHL
TERMINAL
An analysis of its impact on port fraternity and its post effects on
bulk traffic through the port of Mombasa.
By
EVELYN UMAZI MWAMURE
Republic of KenyaA dissertation submitted to the World Maritime University in partial fulfilment of the requirements for the award of the degree of
MASTER OF SCIENCE
inPORT MANAGEMENT
2000
DECLARATION
I certify that all the material in this dissertation that is not my own work has been identified, and that no material is included for which a degree has previously been conferred on me.
The contents of this dissertation reflect my own personal views, and are not necessarily endorsed by the University.
……….
………..
Supervised by: Captain Jan Horck Lecturer
World Maritime University
Assessor: Prof. Shuo Ma
Course Professor, Port and Shipping Management World Maritime University
Co-assessor:
Jean-Michael Mancion
ACKNOWLEDGEMENTS
Very sincere thanks go to International Transport Workers Federation (ITF) London, for awarding me the generous scholarship that enabled me to undertake the Masters degree at World Maritime University. I also thank my employer, Kenya Ports Authority for nominating me and especially Personnel and Finance departments with whom most correspondence was done. Special thanks go to Mr. Steve Odaba of KPA, for his great help in obtaining data for this dissertation.
Heartfelt gratitude is extended to Capt. Jan Horck of WMU, for his patient, resourceful, and valuable supervision, and to Cecilia and Susan for their unlimited support and help in the library. Special thanks to my course professors: Shuo Ma, Bernard Francou and Patrick Donner for the knowledge they have imparted upon me.
Special tribute is paid to my husband, my daughter and my family, for believing in me, praying for me and supporting me.
To all Kenyans in WMU and in Malmo, I say “ASANTE SANA” especially Ms Fatima Jenneby and family. To the PM class of 2000 and to friends acquired at WMU, "You made my life bearable, I almost forgot I wasn't home!" I also thank members of the Student Council 2000 for their good support during my tenure in office as Secretary General.
ABSTRACT
Title of dissertation: Grain and fertiliser handling – GBHL Terminal: An analysis of its impact on port fraternity and its post effects on bulk traffic through the port of Mombasa.
Degree: MSc.
The dissertation is a study of the diverse impacts to be wrought to the fraternity of the port of Mombasa, by a transition in the current methods of handling grain and fertiliser from the conventional, to a mechanised way, both in the short and long run.
A brief look is taken at present handling operations of these products, and its inefficiencies. The direct, indirect and induced impact of the terminal is considered through an analysis of a variety of indicators of performance, efficiency, service and output. The industrial, social, employment and economic impacts on the country and its hinterland are also examined. A market analysis of the products is performed through analyses of data from grain and fertiliser market specialists, globally and in particular, to establish present and future market shares for the competing ports in the region of East Africa. The likely throughput of these products, via the port, in the present decade is also forecast.
The concluding chapter examines the terminal as a strategic food store - a regional hub in effect, for the landlocked and neighbouring countries of East and Central Africa. Recommendations are made to convert the GBHL terminal to a leader in its trade in the entire eastern board of Africa, elevating the image and status of Kenya in its wake.
KEYWORDS: Grain handling, Fertiliser handling, Port of Mombasa, Impact,
TABLE OF CONTENTS
Declaration ii
Acknowledgements iii
Abstract iv
Table of Contents v
List of Tables viii
List of Figures ix
List of Abbreviations x
1. Introduction 1
1.1 Aims of the study 2
1.2 Scope of the study 3
1.3 Methodology 4
2. Background information on grain and fertiliser 6
2.1 Grain and fertiliser imports to date 6
2.1.1 Throughput 6
2.1.2 Value 10
2.1.3 Ships sizes and average frequency 11
2.2 Current handling operations 11
2.2.1 Discharging operations 11
2.2.2 Performance indicators 12
2.2.3 Labour 13
2.3 Reasons for change 14
2.3.1 GBHL foresight 14
2.3.2 Discharging chaos 15
2.3.3 Port reform policy 15
2.3.4 Competition 15
3. Grain and Fertiliser handling terminal 17
3.1 Facility description 17
3.1.1 Port installations 17
3.1.2 Transfer galleries 18
3.1.3 Storage and bagging 18
3.1.5 Others 19
3.2 Terminal operations 19
3.2.1 Ship unloading 19
3.2.2 Ship loading 20
3.3 Other aspects of GBHL terminal 20
3.3.1 Performance and capacity levels 20
3.3.2 Funding and revenue 21
3.3.3 Management 21
3.3.4 Employment 22
3.4 Role of government and port authority 22
3.5 Comparison of parallel bulk terminals 23
4. Impact of GBHL terminal on port fraternity 25
4.1 Impact in the port 26
4.1.1 Efficiency 26
4.1.1.1Service 26
4.1.1.2Output 26
4.1.1.3Berth occupancy 30
4.1.1.4Diversity 30
4.1.1.5Other benefits 30
4.1.2 Management 31
4.1.3 Labour unions 31
4.1.4 KPA cash flow – revenue 32
4.2 Impact on port users 33
4.2.1 Bagging plant companies 33
4.2.2 Tally and Ship Contracting companies 34
4.2.3 Freight Forwarders 35
4.2.4 Shippers and ship owners 35
4.3 Impact on the country 36
4.3.1 Employment 37
4.3.2 Industrial impact 38
4.3.3 Social impact 38
4.3.4 Contribution to GDP 38
4.3.5 Import / Export base 40
4.3.6 Balance of payments 41
4.4 Impact on the hinterland 41
4.5 Challenges of the dedicated terminal 42
4.5.1 Capacity 42
4.5.2 Onward transportation by rail or road 42
5. Grain and fertiliser market analysis and forecast 44
5.1 Grain market study 45
5.1.1 International Grain Council 45
5.1.2 World Food Programme 47
5.1.3 Maritime Strategies International 49
5.1.4 Fearnleys statistics 49
5.2 Fertiliser market study 50
5.2.1 Fearnleys statistics 50
5.2.2 International Fertiliser Industry Association 51
5.2.3 Fertiliser trade in Kenya 52
5.3 A market study of the East African region 52
5.4 Expectations of market players 55
5.4.1 Shippers expectations 55
5.4.2 Ship owners expectations 56
5.4.2.1'Transport System' concept 56
5.4.2.2Ship owner's cost reduction 57
5.5 Future traffic influencing events 58
5.5.1 National plans 58
5.5.2 Industrial plans 60
5.5.3 Hinterland plans 61
5.6 Previous forecasts 62
5.7 Estimating growth of traffic up to 2010 63
5.7.1 Wheat 64
5.7.2 Maize 64
5.7.3 Rice 65
5.7.4 Fertiliser 65
5.7.5 Ships sizes and frequencies 66
6. Conclusions and recommendations 67
6.1 Summary of overall impact 67
6.2 Recommendations 69
References 72
Appendices
Appendix A WFP data 76
Appendix B MV KANARIS ship working report 78
Appendix D Forecast regression analysis. 81
LIST OF TABLES
Table 2.1 Grain and fertiliser imports between 1989 and 1998 6
Table 2.2 Performance indicators 12
Table 2.3 Employees by division – as at 31.12.98 14
Table 3.1 Jaffer & Jaffer forecasted traffic, 1995 – 2009 21
Table 3.2 Comparison of grain terminals in Europe and Africa 24
Table 5.1 GMR (No. 260 1st June 2000) 46
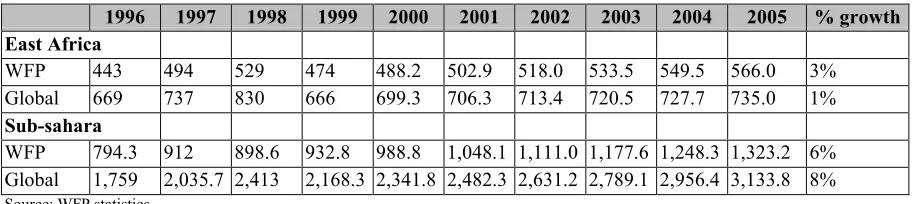
Table 5.2 WFP in comparison to global food aid shipments 53
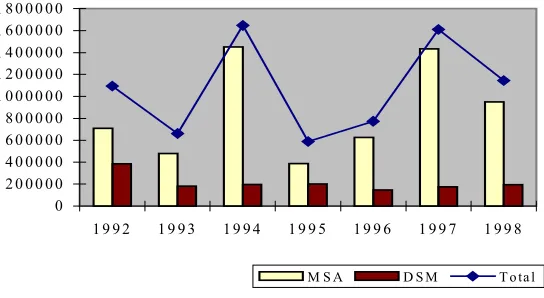
Table 5.3 Grain throughput through MSA and DSM, 1992 – 1998 54
Table 5.4 Fertiliser throughput through MSA and DSM, 1992 – 1998 55
Table 5.5 GDP growth in hinterland countries 61
Table 5.6 Forecasted grain and fertiliser imports up to 2005 62
LIST OF FIGURES
Figure 2.1 Grain and fertiliser throughput 7
Figure 2.2 Trend of total grains 8
Figure 2.3 Trend of fertiliser 8
Figure 2.4 Operating Revenue 10
Figure 2.5 Operating Expenditure 10
Figure 5.1 IGC statistics 47
Figure 5.2 Food aid by country status 48
Figure 5.3 Food aid by region 48
Figure 5.4 Phosphate rock (exporters) seaborne trade 1998 50
Figure 5.5 World fertiliser growth to 2030 52
Figure 5.6 Grain throughput through MSA, DSM 54
Figure 5.7 Fertiliser throughput through MSA, DSM 55
Figure 5.8 Analysis of major costs of running a bulk carrier 58
Figure 5.9 Fertiliser – actual and forecasted 62
Figure 5.10 Grain – actual and forecasted 62
Figure 5.11 Wheat growth up to 2010 64
LIST OF ABBREVIATIONS
ASAL Arid and Semi Arid Lands AV Added Value
BOP Balance of Payments CAF Cost and Freight
CDC Common Wealth Development Corporation CRCS Canadian Red Cross Society
DSM Dar Es Salaam EA East Africa
EC European Community EDI Electronic Data Interchange FAC Food Aid Convention GBHL Grain Bulk Handling Ltd GDP Gross Domestic Product GMR Grain Market Report GNP Gross National Product IBJ International Bulk Journal
IEFR International Emergency Food Reserve IFA International Fertilizer Industry Association IFC International Finance Corporation
IGC International Grain Council IMF International Monetary Fund JIT Just In Time
KPA Kenya Ports Authority Ksh Kenya Shillings
MSI Maritime Strategies International NCPB National Cereals Produce Board NORAD Norwegian Aid
QMS Quality Management Systems UN United Nations
UNCTAD United Nations Commission on Trade and Development
US$ United States Dollar (all in-text conversions into US$ were done at exchange rate of Ksh76.3 to the dollar, as at 15/08/99)
USA United States of America USAID United States Aid
CHAPTER I
INTRODUCTION
The dry bulk trade has grown because of the need for raw materials in several important industries such as steel, aluminium and fertiliser manufacture. A large fleet exists to service this trade. As a result bulk shipping has become a rapidly expanding sector of shipping industry and bulk tonnage now accounts for about three-quarters of the worlds merchant fleet (Stopford, 1997).
E. Naess mirrored these sentiments when he said: "God must have been a ship owner. He placed the raw materials far from where they were needed and covered two thirds of the earth with water."
Transportation of bulk commodities has undergone a radical change due to the tremendous increase in the size and carrying capacity of vessels. This enormous increase in the volume of cargo has emphasized the need for faster and more efficient handling and storage operations, to exploit economies of scale. The scope of global materials handling industry is incredibly varied, from the supply of single pieces of mobile equipment to dedicated turnkey terminals handling millions of tonnes of major bulk commodities annually.
Developing countries have fallen behind in promoting facilities suitable for the reception and handling of essentially large tonnage of most dry bulks. Stopford, had this to say about East Africa:
includes Mozambique, Tanzania, Kenya and Somalia. These countries have an area the size of South Asia, a population of 89 million and a GNP of USD 17 billion. Despite their size, none of these countries have strong economies or rich reserves of primary commodities, so the total volume of trade is very small - only 8mt of imports and 17mt of exports in 1991. The volume of cargo through these ports is small, the facilities primitive, and they have little impact on the shipping market as a whole, other than a continuing source of work for small general cargo ships.”
The author’s inspiration to select this topic came out of the undeniable truth in above statement, and the need to acknowledge the step which Kenya through Jaffer & Jaffer Group of companies has made in elevating the sorry state of the East and Central African region. The Grain Bulk Handlers’ Limited (GBHL) grain and fertiliser terminal started operations at the port of Mombasa (MSA), on February 17, 2000. The author strongly believes this terminal has potential to completely change the face of the port, the country and the region, giving them image and international status as the terminal begins to make some impact in the shipping market.
It shall be noted that the GBHL dedicated terminal, is the first sophisticated purpose built facility dedicated to the discharge of grain and fertiliser between the Suez Canal, and the Cape of Good Hope. The exceptions are certain ports in the region that have grain silos that are now antiquated and in many cases have fallen into disrepair.
1.1 Aims of the study
productivity will improve greatly, however gearing for some negative effects in the short run is inevitable.
This paper is designed to explore the implication of this terminal to the port fraternity and its post effects to bulk traffic through the port of MSA. The paper’s specific objectives are to provide statistics of grain and fertiliser traffic through the port to date, analysing the general performance levels, handling characteristics and establishing the need for change. To present the dedicated terminal by describing aspects of its operations, performance, capacity, management and other economic considerations. In addition, to analyse its impact on the port, port users’ companies, the country and its hinterland. To also point out the role of the port authority and the government in this venture and compare the terminal to parallel terminals in Africa and Europe. A market study will be made to establish the level of the competition, and present and future market shares of these commodities, up to the year 2010. The author intends this paper to be a resource that the port can utilise in strategic planning, in meeting future demands of grain and fertiliser. Finally recommendations for increasing throughput and reducing costs are made, as a measure to attract traffic bound for East Africa, through Kenya - converting the terminal into a regional hub for East and Central Africa.
1.2 Scope of the study
The port of MSA offers shipping services of both scheduled liner operations as well as unscheduled shipments. The former includes mainly container and general cargo vessels servicing the major trading regions of Europe, Far East, Middle East and South Africa. The latter includes individual vessels, chartered for movement of specific cargoes, such as dry and liquid bulk shipments.
This paper covers the major bulks group and in particular, grain and fertiliser. The grain category covered here comprises mainly maize, wheat and rice.
The GHBL dedicated terminal is a reversible loader, but for this paper only the discharge of cargo will be dealt with. For that reason, export cargo will not be covered.
1.3 Methodology
The paper comprises six main chapters. The introduction chapter provides the general overview and evolution of dry bulk market that have deemed necessary the investments of sophisticated storage and handling facilities like GBHL terminal. The second chapter gives an account by volume, value and related resources of the previous and current movements of both grain and fertiliser through the port. The third chapter presents selected aspects of the terminal and parallel terminals comparison. The fourth chapter analyses the impact of the terminal on the port fraternity, both in the short and long run providing a basis for the fifth chapter that examines the grain and fertiliser market globally, and the in region of East Africa in particular. The fifth chapter ends with estimates of growth figures in best, normal and worst case scenarios. The final chapter gives some concluding remarks on the paper and proposes some recommendations.
Field study visits were made to Port of Le Havre in France, Malta Freeport, Ports of Rotterdam and Amsterdam in the Netherlands, Ports of Copenhagen and Aarhus in Denmark and the Swedish Ports of Malmö and Gothenburg.
CHAPTER II
BACKGROUND INFORMATION ON GRAIN AND FERTILIZER 2.1 Grain and fertiliser imports to date
2.1.1 Throughput
Based on the throughput of the last five years, Kenya handles on average, over one million tonnes of grain and fertiliser annually. The total traffic handled in the port in the year 1998 was 8.561 million tonnes of which 6.536 million tonnes was import, making 73% of traffic moved. Grain and fertiliser made up 16.2% of the principal import commodities in the year 1998. This figure has for the last five years averaged at 15%.
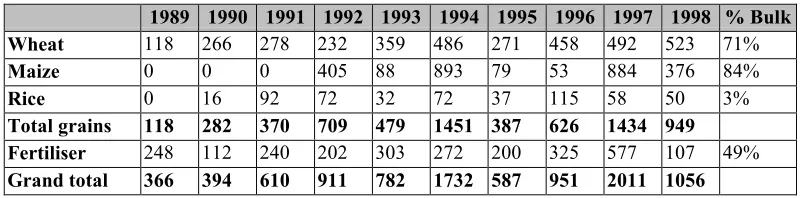
These commodities are imported either bagged or in bulk. Almost all rice, and half of fertiliser imports are bagged, whereas wheat and maize imports are mainly in bulk. Table 2.1 displays actual tonnage moved between 1989 and 1998 and corresponding percentage of bulk. Graphical representation of the data is given as Figure 2.1 in thousand tonnes.
Table 2.1
Grain and fertiliser imports between 1989 and 1998 in '000 tonnes.
1989 1990 1991 1992 1993 1994 1995 1996 1997 1998 % Bulk Wheat 118 266 278 232 359 486 271 458 492 523 71%
Maize 0 0 0 405 88 893 79 53 884 376 84%
Rice 0 16 92 72 32 72 37 115 58 50 3%
Figure 2.1
Kenya is a net exporter of maize and importer of wheat in normal years, however the exports of maize vary depending on the surplus existing in the country and have been quite insignificant during the last decade. Grain imports include regular shipments to support programs such as school feeding programs and provide supplies to Arid and Semi Arid Lands (ASAL), where there is little or no crop production. In addition there are emergency shipments to relieve food shortages in the country, as a result of famine. MSA port receives regular shipments of fertiliser annually for the production of agricultural products within and outside the country, the sudden drop in 1998, is attributed to the high prices in the previous year of fertlisers.
Figures 2.2 and 2.3 show the import trends of these two groups of commodities. Their tonnage has generally increased over the years, however the increment has not been steady. Grain has increased faster than fertiliser for obvious reasons that fertiliser is mainly imported only for the local market and prices have not been very affordable for most of the local farmers. Average increase for grain is 80,000 tonnes per year and
Grain and fertiliser throughput
0 500 1000 1500 2000 2500
1989 1990 1991 1992 1993 1994 1995 1996 1997 1998
13,000 tonnes per year for fertiliser. By tonnage, wheat is the biggest import followed by maize and rice.
Figure 2.2 Figure 2.3
The government had projected production of wheat to reach a target of 400,000 tonnes, far below the forecasted demand of 1 million tonnes this year. About 33-40% of consumption is met by import, thus although production of wheat has been stepped up, the import dependence still persists. The main importers of wheat are the grain-milling companies in the country. Grains are also imported as food aid shipments and mainly come from European Community (EC), U.S.A, Argentina, South Africa and Switzerland. It is imported by among others, World Food Program (WFP), Red Cross, Catholic Relief Services (Kenyan and Sudan program), Fin Aid, and Norwegian Aid (NORAD).
Maize imports were forecasted to decrease progressively to about 20,000 tones by 1991 to meet primarily transit requirements and any special grants which may be made to Kenya (KPA, 1986/2005). After 1991, it was expected that Kenya would be a net exporter of maize, averaging 100000 tonnes/annum - a situation, which did not occur.
0 200 400 600 800 1000 1200 1400 1600
1986 1987 1988 1989 1990 1991 1992 1993 1994 1995 1996 1997 1998 0 100 200 300 400 500 600 700
1986 1987 1988 1989 1990 1991 1992 1993 1994 1995 1996 1997 1998
However these forecasts were subject to government implementing its producer prices' policy and providing storage for strategic reserves. The exceptionally high figures of maize in the years 1994 and 1997 are attributed to the crop failure in Kenya and political instability in the neighbouring countries.
Rice is not a regular import and amounts to a mere 0.2% of Kenya’s arable land. It was forecasted that paddy rice expansion would be negligible because of involvement of high expenditure on irrigation works. The demand for the commodity has not grown much. The importation of rice amounts to 25,000 tons annually.
95% of the fertiliser import in the country is destined for Kenya Tea Development Authority (KTDA). With Kenya not having a manufacturing plant, the government licensed established dealers to import and market fertiliser. This commodity was forecasted to grow by 5% during the period between 2000 and 2005.
The above volume of cargo includes transit traffic to the landlocked countries of Uganda, Rwanda, Burundi, and Eastern Zaire. These cargoes have an alternative route through the port of Dar Es Salaam (DSM) and in the recent years although traffic has increased in MSA, it has been loosing its market share in some commodities. The percentage of grain and fertiliser that is for the non-Kenyan market has also increased showing the importance of the port as a transit port. Grain and fertiliser in MSA port was until very recently entirely being moved in the conventional way, outlined in the handling operations.
to year. The most significant of which are perhaps the El Nino and the Rwanda -Burundi clashes.
2.1.2 Value
The annual revenue of the port of MSA averages Ksh.7.1 billion or US$93 million (KPA, 1999). 29% revenue is earned by conventional cargo currently the biggest revenue earner section for the port. Conventional cargo expenses also make the giant share of operating expenditure (48%). These expenses include labour, equipment operating and maintenance costs and purchase of handling gear. The port statistics do not provide the breakdown by commodity, of the revenue or the expenses, and it is therefore difficult to establish the contribution of grain or fertiliser. However, considering the big range of commodities handled at the port, the contribution by value is small at present but the advent of the terminal is expected to change this situation. The increased throughput will result in higher revenue. Figure 2.4 and 2.5 are provided to compare the revenue and expenditure of the port in 1998.
Figure 2.4 Figure 2.5
Source: KPA Annual bulletin of statistics, 1998
47% 29%
5%
19%
Conventional cargo Marine (shipping) Containerised Dry ports 29%
16% 8%
18% 8%
8%
9% 1%3%
Conventional cargo Stevedoring cargo Marine (shipping) Containerised Wharfage Handling
Storage Dry ports Others:
2.1.3 Ships sizes and average frequency
Grain is expected in consignment sizes of not more than 50, 000 tonnes and fertiliser in 25,000 tonne consignments, which is the average size of grain and fertiliser vessels calling at the port today. The port development plan for MSA 1991-2000 had incorporated an extension of berths as a measure to upgrade their handling capacity and appropriate equipment need thereby enabling the berthing of 75,000dwt vessels.
The average interval between vessel arrivals is determined by dividing the total traffic with the average consignment. For grains, this is estimated at 27 days while for fertiliser the estimate is 23 days.
2.2 Current handling operations
2.2.1 Discharging operations
The port is equipped with 16, deep water berths, with a total quay length of 3044m and a depth of between 10 and 12 meters. This comprises a 3 - berth specialised container terminal, 2 conventional berths recently dedicated to container vessels but using ship’s gear to discharge containers, 2 cruise ships berths, 2 berths dedicated to handle bulk mineral (Magadi soda) and 7 general cargo berths. In addition there are two liquid bulk handling quays, mooring facilities at English Point, a two-berth quay at Mbaraki and various anchorage available in the roads.
destination. Whichever method is employed, there are several disadvantages of the current handling operations. These include:
-♦ Massive spillage amounting to 3-5% losses of the grain.
♦ Congestion of vehicles, equipment and men on the quay
♦ Huge volumes of dust in the air around the quay, which is a potential health hazard
♦ Slippery grounds in the advent of rain and foul smell filling the environment.
♦ Vessels' time in port is too long, making incentives almost compulsory for
satisfactory ship performance.
2.2.2 Performance indicators
The average turnaround time for 25000dwt vessel is 8 to 25 days, corresponding to handling rates of 1000 to 3000 tonnes per day respectively. The discharging rates achieved vary very significantly with the amount of incentive paid. Often the shipping agents will offer an incentive or bonus to ensure a faster turnaround time for their vessels. During such times rates of up to 3000 have been achieved, otherwise 1000 tons per day is the norm. Landside handling of the cargo to some extent also inhibits any higher rates from being reached. It is often felt that quayside bagging plant’s speed and the precision of placing bags onto lorries or wagons, often delays the hook cycle.
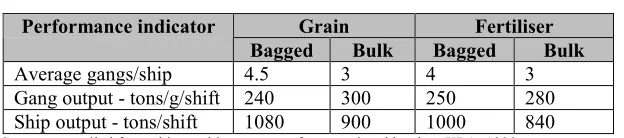
Table 2.2 summarises current performance as analysed from ship reports of selected conventional berths during 1998. The figures are subject to incentive being used.
Table 2.2 Performance Indicators
Grain Fertiliser Performance indicator
Bagged Bulk Bagged Bulk
Average gangs/ship 4.5 3 4 3
Gang output - tons/g/shift 240 300 250 280
Ship output - tons/shift 1080 900 1000 840
The deployment of more gangs to handle bagged cargo rather than bulk, is mainly because of the space required to place a single bagging plant, normally no more than three can be placed alongside one vessel.
The average berth occupancy of the port is 62% denoting congestion at certain times of the year. With the forecast growth of grains and fertiliser traffic and maximum handling rate of 2700 tons per day, there would have been an obvious requirement for more berths unless the seaside and the land side operations of discharging can be separated to achieve much higher ship output per hour.
Suggestions to extend the berths and install a mechanical handling and storage plant was expected to reduce requirements for additional berths by substantially reducing the time alongside of each bulk carrier. Within the context of rationalisation of the existing port it was proposed that a facility for handling grain and fertiliser be developed (Palmer, 1993).
2.2.3 Labour
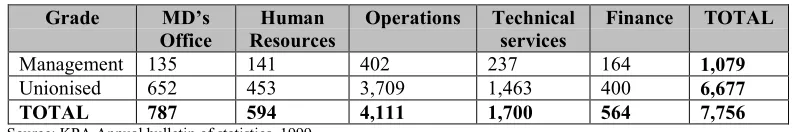
It is generally accepted that staff levels are in excess of those required to fulfil the services to cargo and ship. Not withstanding this excess, gangs for cargo handling are frequently understaffed causing delays to vessels. Table 2.3 shows the staff levels in 1998, by division both management and unionised. Altogether 4,111 people are employed in Operations Division, more than 50% of the total employees. The Personnel department provided that 3265 are employed on conventional side and 846 on container terminal. The combined expense of salaries and overtime wages is grotesque and a good profitability from conventional cargo cannot easily be realised with such numbers.
Table 2.3
Employees by division - as at 31.12.98 Grade MD’s
Office ResourcesHuman Operations Technicalservices Finance TOTAL
Management 135 141 402 237 164 1,079
Unionised 652 453 3,709 1,463 400 6,677
TOTAL 787 594 4,111 1,700 564 7,756
Source: KPA Annual bulletin of statistics, 1999.
2.3 Reasons for change
2.3.1 GBHL foresight
“One can go down to MSA port and see the substantial amount of dust resulting from the bulk discharge of commodities such as sorghum, which clearly shows the environmental problems being faced. Additionally in the wet weather the port quays tend to become a quagmire of wet commodities due to heavy spillage from the grabs and grabbing hoppers and the odour of rotting grain frequently prevails.” (IBJ, 1999)
purpose built modern facility in or adjacent to the port for discharging and storing bulk commodities and fertiliser. The increase in bulk and bagged cargo over the years and the fact that much of the cargo arriving currently in bags could very easily arrive in bulk were such a facility put in place, were a big motivation to change.
2.3.2 Discharging chaos
The region-wide drought in 1992 brought 92,000 tonnes of imported cereals through the port in one year. The ensuing chaos in the port was a sure sign that in the event of it occurring again, only a modern dedicated facility would be able to cope.
2.3.3 Port reform policy
This has been an ongoing debate between the government and the donor companies that provide funds for port development. The deteriorating condition of the port has been a factor of concern, and one of the reasons for the denial of further grants from International Monetary Fund (IMF). An embargo was placed for Kenya to engage in workable reform processes such as privatisation and/or commercialisation before this aid would be resumed. The main focus has been on the container terminal. 1996 saw expatriates arriving from Felixstowe port to “perform miracles” on the terminal, but their mission was cut short when a disagreement arose with the main sponsors and the container terminal has since been waiting for another “saviour”.
KPA leasing two berths to GBHL, is therefore the first real move towards undertaking these reform measures.
2.3.4 Competition
CHAPTER III
GRAIN AND FERTILISER HANDLING TERMINAL
3.1 Facility description
The terminal facility stands on land measuring 1.434ha, 250m from the dedicated berths nos. 3 and 4 of KPA. It will discharge maize, wheat, rice and fertiliser imports using unloading spouts onto conveyor belts and into the Jaffer & Jaffer silos and fertiliser stores. Bagging plants to enable bulk transportation by road and rail have been put in place.
3.1.1 Port installations
Discharge is to take place using two completely mechanical, mobile and environmentally friendly ship unloaders, each with a capacity of 300 tonnes per hour continuous. Discharge is on to fully encased dual conveyor systems, constructed along the top of the walls of berth no. 3. The first stage takes them to the weighing tower constructed between berth nos. 2 and 3 from which an elevated twin conveyor will transport it to the storage facility adjacent to the port. Each conveyor is said to have a capacity of 600 tonnes per hour and can receive directly from two ship unloaders.
The ship unloaders are fully self-sustained and can easily shift between vessels and holds. An area at the south-east end of one of the berths has been secured as the storage of the equipment.
3.1.2. Transfer galleries
Two ranges of three belt conveyors connect berth nos. 3 and 4 to the silos. By design there is expected to be no spillage during discharge. The entire conveyor system will be covered from the vessel to the storage area making the environment dust free, and eliminating any possibility of cross infestation. With particular types of vessels the possibility for discharge during periods of inclement weather, are available.
The weighing tower constructed between berths nos. 2 and 3, establishes exact tonnage discharged, both for operational and customs requirements. These will obviate out-turn disputes that have in the past arisen between the parties.
3.1.3. Storage and bagging
The design of the new storage and handling site incorporates the most modern equipment available to receive store and maintain commodities in prime condition. Infestation and subsequent degradation of any commodities will be eliminated completely. All silos will have temperature monitoring hence facilitating humidity control. Both the warehouses and the storage areas are segregated between food and non-food.
The cereal line
enabling a bagging rate of 2,800 bags per hour. Bagged cereals will be loaded by one wagon loading circuit.
The fertiliser line
This line is equipped with one horizontal silo ("A" Frame warehouse) measuring 1,650m2 with a capacity of 18,000 tonnes. The emptying of which will be enabled by a mechanical grab. In addition the line includes a wagon loading circuit for bulk fertiliser, truck and wagon loading circuit for bagged fertiliser.
3.1.4 Onward transport connections
On reaching the handling complex, commodities can be loaded in bulk direct to rail car or truck, or stored in a controlled environment from which it can be bagged simultaneously. The new terminal expects service by excellent rail connections where two additional rail spurs will join the existing main line. This will facilitate the loading of two block trains independent of the main through line, together with the existing road network, substantial dispatches can be maintained.
3.1.5 Others
A laboratory has been constructed for the surveillance of any commodity on arrival and whilst in storage with attention to humidity, infestation and pest control and a weigh bridge for trucks entering and leaving the premises. Electrical supply is through own power station (including 2 x 600 kW generators).
3.2 Terminal operations
3.2.1 Ship unloading
is separated from the product. The product is then dropped by gravity into the conveyor belt. The belt allows loading at infinite points along its length and also maintains weather and dust closure.
Sufficient time will have to be allocated for the non-productive operations such as removal of hatch covers, relocation of unloaders, intimate contact of vacuum nozzle with the product. The product is taken from the zipper type conveyor belt through several hooded conveyors to the bagging point, or bulk weighing point. At the bagging point, weighed bags are conveyed onto pallets that are carried away by forklifts.
The bulk weigher weighs 4 tonnes at a time. Weighing is an automatic continuos operation. A printed tape displays all the draft weight, time and data commodity weight and a code for origin points. The weighed product is carried by belt conveyor to a bucket elevator and dropped by gravity into a two-way valve. This directs the product to either of two destinations: a silo via a belt conveyor, or to a swivel loading spout for unloading onto rail wagons.
3.2.2 Ship loading
It is expected that the reverse operation can take place.
3.3 Other aspects of GBHL terminal
3.3.1 Performance and capacity levels
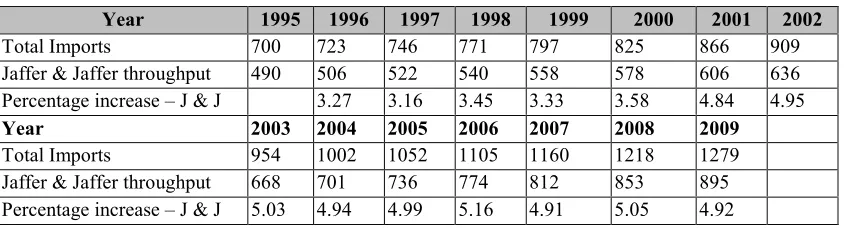
The Jaffer & Jaffer Group is optimistic that the increase in traffic in the next 10 years will be stable, and they projected their figures in a written report compiled by the finance and economic department in 1993 entitled: “Financial and economic appraisal study for a grain and fertiliser handling project”. Table 3.1 displays these figures. The anticipated average growth in traffic is 4.4%
Table 3.1
Jaffer & Jaffer Forecasted traffic, 1995 – 2009 (´000 tonnes)
Year 1995 1996 1997 1998 1999 2000 2001 2002
Total Imports 700 723 746 771 797 825 866 909
Jaffer & Jaffer throughput 490 506 522 540 558 578 606 636 Percentage increase – J & J 3.27 3.16 3.45 3.33 3.58 4.84 4.95
Year 2003 2004 2005 2006 2007 2008 2009
Total Imports 954 1002 1052 1105 1160 1218 1279 Jaffer & Jaffer throughput 668 701 736 774 812 853 895 Percentage increase – J & J 5.03 4.94 4.99 5.16 4.91 5.05 4.92
Source: Financial and economic appraisal study – Jaffer & Jaffer (1993).
3.3.2 Funding and revenue
The US$32 million project was funded by loans from International Finance Corporation (IFC - US$10 million), Common Wealth Development Corporation (CDC - US$10 million), Jaffer & Jaffer Group (US$6 million), Proparco of France (US$4 million) and an equity commitment from Portia (US$2 million) (IBJ - October 1999).
An estimate of the operating costs for the terminal was calculated during the appraisal study in 1993 at average US$4.2 million annually. The company anticipates revenue of US$20 per tonne of commodity.
3.3.3 Management
Company of Liverpool have been appointed to take over the management of the facility. (Captain J.W.S Dunn - Project and Commercial Manager, GBHL)
3.3.4 Employment
The construction of the terminal is a step in promoting private sector investments. It provides opportunity for creation of employment and added value. According to GBHL statistics of 1993, the number of office employment comprises 25 permanent staff, whose monthly salary amounts to Ksh.1315000 (US$17,235). Casual labourers will be employed at the manual bagging plant at the rate of eight gangs of eight men daily (IBJ, 1999). This amounts to 64 casual labourers per day or 23360, annually.
Calculating the number of employees from the bagging rate point of view and port’s experience, the estimated best target of 10,000 tonnes per day would employ on average 270 labourers (approx. 300 tonnes/gang) daily or 98550, annually. Depending on the rate of discharge and the method of employment of casual labour, the number of jobs created at GBHL will range between 23400 and 98600. Some employees are expected to gain through education and training in the new technology.
3.4 Role of government and port authority
complexities and bureaucratic processes of strategy development, hence becoming more focused on improving service levels, productivity and managing costs
The government has a big role to play in providing sufficient well maintained transport links that are necessary for the onward movement of the cargo from the storage facilities of the dedicated terminal to its final destination, which in Kenya is mainly by rail or road. The evolution in customer requirements namely the JIT system, coupled with the fact that production, trade and transport are no longer considered individual isolated activities, has rendered the traditional function of ports, of cargo handling, insufficient. JIT is a logistic system based on the principle of “producing and delivering” i.e. placement of precisely managed and controlled transport and information systems. Ports are shifting from pure transport centres to logistic centres as well corresponding to the new structure of international and maritime transport.
The port’s role is in developing and enhancing international trade. It has a responsibility to maintain good infrastructure with the help of the government and also maintain a conducive social climate within the port for day to day operations. This will initiate a wide range of commercial activities to improve the country’s economy and trade and also ensure that the customer can get the right product at the right time.
The rail and road network of Kenya is in disrepair. The situation got worse when heavy rains damaged roads, railway lines, and bridges making transport between MSA and its hinterland very difficult. If drastic action to repair and restore is not implemented in the short run, GBHL and indeed the port’s precious objectives will never be realised.
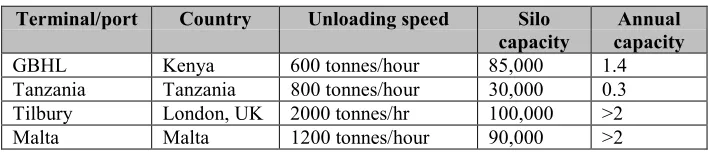
3.5 Comparison of parallel bulk terminals
terminals in Africa and Europe, in table 3.2. The comparison is given as a guide and a challenge for the GBHL terminal which has just started operations, and which hopes to achieve the status of other terminals through hard work and experience. Malta and Tilbury handle both import and export grain shipments. The silo capacity is in tonnes while the annual capacity has been given in million tonnes
The success of the terminals owes much to the skill and training of workforce, experience and dedication. It is vital that every member understands what total flexibility really means and how important it is for customers. A management team needs to guide them who have extensive knowledge of the trade developed through many years of experience.
Table 3.2
Comparison of grain terminals in Europe and Africa Terminal/port Country Unloading speed Silo
capacity capacityAnnual GBHL Kenya 600 tonnes/hour 85,000 1.4 Tanzania Tanzania 800 tonnes/hour 30,000 0.3 Tilbury London, UK 2000 tonnes/hr 100,000 >2 Malta Malta 1200 tonnes/hour 90,000 >2
Source: compiled from Malta field trip data, Port of Tilbury yearbook and Tanzanian review (IBJ). * Calculated, not actual capacity.
CHAPTER IV
IMPACT OF THE GBHL TERMINAL ON THE PORT FRATERNITY
The terminal will have direct, indirect and induced impacts in the short and long run on various players of the port fraternity either negatively or positively. Port fraternity comprises all parties/companies that have similar interests or professions in the port, who enjoy a sort of friendship and mutual support. Different port departments, shipping companies, shippers, ship contracting companies, tally companies, bagging plant companies, freight forwarding companies, the common citizen and the nation as a whole could all be said to belong to the port fraternity. The author will consider each group individually or together wherever relevant.
Short-term effects tend to be more destabilising and unfriendly with often-adverse consequences. However, in the long term, equilibrium is normally achieved, a workable and friendly environment whereby each player eventually finds his or her place or position in the arena of events.
4.1 Impact in the port
4.1.1 Efficiency
Efficiency of the terminal will be measured by ratios concerning time, cost, productivity and capacity, which constitute overall efficiency. A direct impact of better service, higher output, improved berth occupancy, efficient and effective procedures and operations are expected in the immediate short run. In a nutshell the GBHL terminal is expecting to replace an inefficient bulk handling operation with an efficient one.
4.1.1.1 Service
The greatest benefit to be gained at all from the terminal is saving in time. The traditional turnaround time of 8 to 25 days for a 25,000-dwt grain vessel is expected to reduce by 69% to 2.5 days, corresponding to discharging rate of the former being at best 3000 tons per day while the terminal’s best capabilities are up to 10,000 tonnes a day.
Average net waiting days per ship in the port of MSA was about 3.8 days in 1998, 27% more than the previous year at about 3 days, while the number of dry cargo deep sea ships arriving in the two years was 1181 and 960 respectively, a reduction of 19%. It was expected in 1998, that with fewer arrivals, the waiting time should be reduced, but the long turnaround time coupled with lack of enough specialised terminals to which specific types of ships can call directly, has aggravated the time problem. It is believed that with the seclusion of two additional specialised berths for grain and fertiliser, the waiting time will decrease. Eventually all grain and fertiliser vessels will call at these two berths alone.
4.1.1.2 Output
installations at each berth. The productivity of each ship unloader varies according to the characteristics of the ship and cargo, and the position of the cargo in the ship. In the case of GBHL, these two berths are equivalent to effectively only one, because only two ship unloaders serve both berths; therefore only one vessel can be discharged at time.
Considering the situation at KPA berth nos. 3 and 4 – GBHL terminal.
Terminal capacity calculation
Yearly available hours, (working day of 24 hours): 365 x 24 equals to 8,760 hrs
No losses of time are expected from rain. Discharge is possible during rain.
Current berth occupancy of 62% will reduce the maximum yearly available hours by
38%. 0.62 x 8760 equals: 5431 hrs
Subtracting time required in berthing and de-berthing ships (approximate 4 hrs per ship). According to the company’s management, 70% of all grain and fertiliser ships can be handled at the terminal. 1998 KPA statistics recorded a total 91 dry bulk ships, 53 of which were grain or fertiliser (Manifest office – KPA).
70% of 53 is about 38 ships. Manoeuvring time is 38 ships x 4 hours = -152 hrs
Available working hours now reduces to 5279 hrs
Time required for repair of major maintenance & breakdowns as recommended by UNCTAD specialists is 10% of the total working hours giving:
0.1 x 5279 available hours -528 hrs
Ship unloader capacity
Apart from the volumetric capacity of the grab, the following factors also affect its rate of discharge. The density and nature of the materials, grab hoisting speed and acceleration, skill of ship unloader operator, shape of hold and hatch opening, method of trimming in the hold, ship’s beam and ship unloader outreach, depth of hold and tidal height.
The total nominal capacities of the two ship unloaders at the terminal is 300tons/hour x 2 equalling 600 tons/hr/ship, for the calculation their effective capacity is considered, which is affected by:
♦ Time lost in trimming
♦ Cleaning up
♦ Moving between holds
♦ Requisite breaks during the working periods.
♦ More than one pipe into a single receiver
♦ Leaking pipes, choking rotary valve
Ideally, a specialist determines the effective capacity factor, but as a rough check UNCTAD recommends a figure of not more than 0.5 for unloaders (and not more than 0.7 for loaders).
Effective capacity at 0.5 x 600 reduces unloaders capacity to 300 tons/hr/ship
Maximum throughput capacity of the terminal is therefore 300 tons/hour x 4751 hours
giving a total of 1,425,300 tons
be between 3 to 4 days, at the terminal. Fortunately because of the frequency of arrivals of these vessels we have no peak factor to consider. We can succeed not to have any queuing of vessel in-spite of the high berth occupancy ratio. The UNCTAD recommended maximum occupancy ratio for a two-berth terminal with 10% allowable waiting time, is 35%, but because of the explanation given above, the maximum capacity of 1.4 million tonnes obtained, need not be multiplied by this factor of allowed maximum berth occupancy.
This capacity of 1.4 million tonnes is not enough to handle unpredictably high traffic as in the case of 1994 or 1997 (see table 2.1). However, since other conventional berths will continue to handle the remaining about 30% of the ships, for some unforeseeable future, the total port capacity for handling bulk commodities will not be limited to 1.4 million tonnes, just yet.
The above capacity increases the port’s total throughput, very significantly. Factors affecting the annual terminal capacity are:
Berth occupancy
1. Number and effective capacity of ship unloaders
2. Total available working hours
3. Unavoidable time losses from bad weather, idle time or maintenance schedules.
From the point of view of port interests, one high-capacity dry bulk cargo terminal is preferable to two or more terminals with moderate yearly capacity. When growth in traffic seems possible but uncertain, the single terminal can suffice. However allowance should be made for installing additional ship unloaders and higher capacity conveyors and increasing the stockpile area in the future without serious interruptions in the operations. With careful planning, expansion in this way should prove more economical than the construction of a second terminal for the same kind of material (UNCTAD, 1985).
4.1.1.3 Berth occupancy
The terminal's ability to handle 70% of the total grain and fertiliser imports will ensure that other berths are freed. This will lead to better scheduling of vessels, which in turn reduces the ships waiting time in port. The threat that extra berths would have to be constructed is eliminated as the terminal assures grain and fertiliser vessels faster turn round time.
4.1.1.4 Diversity
A diversification of port activities especially in the handling and processing of other cargoes such as heavy metals is now enabled. The port receives good tonnage of steel and heavy metals and has been limited by space in the past to explore the full benefits of supplying value-added activities to these products. During an interview held with the former Operations Controller of KPA, Mr. Rashid Marwan, the author gathered that the advent of freeing several berths through the GBHL terminal is a blessing to the port. It will create substantial amount of extra open storage for the consolidation and distribution of steel imports from the port premises.
4.1.1.5 Other benefits
2. The entire process of covered handling of the cargo will achieve an environment that is free from dust pollution and also eliminate losses incurred as a result of spillage within the port area.
3. Quayside congestion of people and trucks will be eliminated from the port and
shifted to an area outside (where the silos are) from where the daily port operations will not be interrupted.
4. Risk of damage to products like fertiliser which solidify when exposed to humidity,
is minimised by ability to discharge from a partially opened hatch, rather than completely opened hatch that often made the discharging process difficult.
5. The terminal will result in increased efficiency in other berths of the port as well.
The current inefficiency stems from unavailability of equipment due to breakdowns, labour problems etc. The equipment can now be transferred to other berths to boost efficiency there.
4.1.2 Management
The GBHL is a completely private investment, and the relationship with the port is as landlord only. The port has leased to GBHL berths nos. 3 and 4. The everyday running of the terminal is the responsibility of the company. According to the contract signed between GBHL and KPA, the port receives a payment equivalent to US$2 for every tonne of product moved. However there are plans to review this contract, which are now in progress.
4.1.3 Labour unions
protect its members even if they are an obvious liability to the port. The rules that apply to developing countries offer better job security to employees and not just in the port industry. In the developed countries, this venture would provide a good opportunity to decrease the usually very expensive labour.
4.1.4 KPA cash flow - Revenue
KPA has an agreement with the GBHL signed in 1992 for payment of tariff by the company to KPA of US$2 per tonne of grain compared to US$13 being paid by bagging operators at the port. This difference made the port to loose within two months of the company's operations, an alleged amount of Ksh100 million in revenue (US$1.31 million). The loss of revenue for KPA is expected to impact negatively on the operations of the port, which are now focusing more on raising revenue and investing in cargo handling equipment. Although the efficiency of handling will be stepped up, KPA will loose much needed extra revenue at a time it is constrained of cash. It is believed that the loss is about 20% of the total profit earned at the port (Mwakugu, 2000).
A simple calculation has been performed below that determines the opportunity revenue that has been foregone by the port authority, in leasing GBHL the two berths. The US$2 that the port authority earns per tonne is far below the lost revenue from the two berths.
The total revenue earned at the 13 conventional berths from cargo handling operations in 1998 according to figures provided in the bulletin of port statistics have been used.
Foregone opportunity revenue
Stevedoring cargo Ksh.3,443 million
Conventional cargo Ksh.2,896 million
Total Ksh.6,339 million
TOTAL Ksh.4,719million
Each berths earns about 4,719/13 = Ksh.363 million
Hence on average the lost opportunity earning from berths nos. 3 and 4 is about Ksh.726million (US$9.5million). According to GBHL present agreement, with KPA, US$9.5 million will only be realised by discharging over 4 million tonnes of product, which is far beyond the maximum annual berth capacity of the terminal. The lost opportunity revenue as a result of GBHL is very high - US$2.8 million compared to US$9.5 million (over 300% loss).
However, due to improved handling of the cargo, ship owners would be able to commit larger and more vessels to supply grain to MSA port. This would compensate for the losses that KPA is facing through transferring stevedoring charges from itself to the terminal entity, in terms of gaining through other charges like pilotage, wharfage, dockage, storage and shore handling.
The overall response on the money issue has given rise to a lot hot debate and dissatisfaction from the public. The US$11 difference paid by conventional berth users -bagging plant operators, who are engaged in the same trade, has been an issue of enormous dissatisfaction among this category of operators.
4.2 Impact on port users
4.2.1 Bagging plant Companies
three bagging plant companies with altogether 13 units; Kazkazi Maritime Ltd, Norsk Hydro E.A. Ltd and Inter-globe Services Ltd. Each of these companies are paying to the port US$5000 per unit per year in license fees, amounting to US$65,000 annually about 6% of annual profit - soon to be lost to KPA.
During two months following the start of GBHL operations, 111500 tonnes of grain was discharged in the port, all at the terminal. This has had a negative impact on the bagging companies in two folds; one - it puts them out of competition due to their high tariff and two - will soon put them out of business unless they have diversified their services. The terminal is already enjoying a monopolistic advantage arising from its competitive tariff.
The bagging units that were an expensive investment are soon to be laid off as dead inventory. Bagging companies also give business to tens of licensed small sized companies for ship contracts of cleaning and sweeping the berths during discharging process. These companies too will be directly impacted by the fate of their employers.
4.2.2 Tally and Ship Contracting Companies
KPA had licensed by December 1999, a total of 62 ship contractors or tally companies. They each pay an annual fee of Ksh.16,000. A direct negative impact to the port will be the loss of Ksh.992000 (US$13001) annually.
4.2.3 Freight Forwarders
A major shift is expected in the business of a number of clearing and forwarding operations. The fear that the impact could reach as far down the transport chain as C & F business, is making the big operators like Kenya Freighters Ltd, move from bulk sector to other operations such as container (Lloyd’s List, 2000).
4.2.4 Shippers and Ship owners
This category of the port the fraternity is most comfortable with the changes that have taken place, in any run of time. For Kenya’s seven milling companies, currently importing around 600,000 tonnes of product per year, the news is positive. The terminal will mean product is available at US$12 per tonne (port and transport costs included) as required. Some farsighted millers are considering equipping themselves to receive from the terminal in bulk (IBJ, 2000).
Shippers are mainly concerned about getting their cargo on time, and as safe and as whole as it was when sent from the origin. Ship owners on the other hand, want to spend as little time as possible in the port, the only way in which way they make any profit from their business. The dedicated terminal is offering to both, the opportunity to realise these goals, and it is expected that bigger ships and higher tonnage will be committed to the terminal in the future.
The ship owner
Secondly, faster turnaround time increases the vessels' carrying capacity by increasing the total round trips that she can make in a year.
The shipper
The shipper, will benefit from the ship owner’s reduced unit cost, because the freight rates will go down, and the shipper will afford to move more cargo around - increasing the volume of traffic and trade world-wide. It is a vicious cycle and as true as the positive cycle is, so is the reverse, in aggravating a negative trade and volume, where handling characteristics are unfavourable.
Shippers and ship owners are the direct customers of any port and ideally any business is generated, driven and sustained by level of customers. They are an important asset to any organisation and therefore to KPA. Many ports are enhancing changes in the shipping industry by advancing in technology. The winning companies are those who are listening to their customers and who choose to interact with them in whatever way they choose, whenever they choose. Obtaining a way to develop long-term relationship with these customers through advent of GBHL terminal will be very profitable to KPA and is a sure way of winning their loyalty. Relationships will grow stronger, business will get bigger and KPA will lead markets.
4.3 Impact on the country
currently contributes only 19% of GDP, and is a growing source of exports in the East African region. Kenya enjoyed steady economic growth from independence until the 1970s. The average GDP growth rate has declined from 6.5% in the 1970’s to 2.1% in 1990-1998, below the rate of growth of population of 2.4% (World Bank).
The port of MSA has a significant impact on the country, employing directly about 7500 people in its various sections and much more indirectly. GBHL has an indirect or induced impact on the country and in a small but significant way will influence the economy as outlined below.
4.3.1 Employment
The GBHL terminal has lifted the image of the country. In the short run, unemployment will be an issue to be dealt with, at a low but significant level. Scores of permanent and casual labourers may lose temporarily, gainful employment in warehouses, transport firms and bagging factories in the immediate short run. This will result from inevitable favouritism by the terminal operators in providing business to the already existing companies, since the terminal is now expected to have giant share of the grain and fertiliser trade in the country. In a country that already suffers the negative effects of unemployment, this may aggravates the situation some. The high cost of labour in many of the industrialised countries has justified the use of more advanced techniques of mechanisation and automation. In developing countries however, different social factors usually apply. The unemployment rate, in Kenya presently is a shocking 37% (urban), one of the highest in Africa, a population of 29.3million and a growth rate to match (2.4%).
who grasp opportunities like this to start small businesses dependent on the activities of the terminal.
4.3.2 Industrial impact
The economic benefit to be derived from the venture far surpasses the short-term negative effect which time will eventually eliminate as more jobs are created through value added activities arising from the same. The silos and storage for the terminal are located in an industrial zone of the town, where many warehousing companies are situated who are expected to gain through less transport cost. In addition, majority transportation companies will benefit from the elimination of need to enter the port for cargo. Most vehicles are old and not road worthy and were previously constantly barred from entering the port. With that kind of control removed, more trade can go on, as the same constraints do not exist outside the port.
New companies are also likely to mushroom, such as in the field of blending, sorting and packaging.
4.3.3 Social impact
The neighbourhood of the terminal premises, is a housing estate for the port employees. The level of noise and dust resulting from the bagging operations hasn’t been eliminated but rather transferred from within to without the port. Living conditions are bound to be unfavourable for the residents and the dust, a health hazard.
4.3.4 Contribution to GDP
The general impact on national GDP is given by the sum of directly and indirectly aggregated added values. The overall impact is a factor of this, and the ratio of induced added value that comes as a result of multiplier effect. The multiplier value depends on a number of factors such as; revenue generated from terminal, level of trade from these commodities, total employment including indirect employment, salary levels among other factors. It is therefore difficult to determine with certainty what it will be however, 1 represents no effect and 2 represents too much effect. For most economies the multiplier effect value lies within this range.
Studies performed in European ports on the estimates of AV by cargo type, established coefficients that reveal wheat (3.8), gives four times more AV than crude (1.0), but about three and a half times less than break-bulk (15.0) and twice less than containers (8.5). These are conclusions drawn from the "Rotterdam rule" of 1991.
Yearly direct AV aggregate is given by summation of total wages, profits and taxes. Calculating this aggregate for GBHL terminal yields:
Wages of office staff: US$1,972,50
Add wages of casual labourers (at 1.52 USD per tonne and 1 million tonnes 1998
statistic). US$1,520,000
Total Wages US$1,717,250
Profits estimated in year 2000 by financial appraisal report in 1993 U US$6,388400
Taxes estimated in year 2000 by financial appraisal report in 1993: US$2,231700
Total direct contribution to GDP: US$10,337,350
is important since each potential earner on average supports about 6 more persons - the average family size. Even though 0.1% may seem negligible in value terms, the expected dependence in the future of the landlocked countries on the terminal (non-value terms) makes GBHL have a marked contribution.
4.3.5 Import / Export base
Export and import prices include a logistic component, the cost of which may vary from 2% to 100% of the value of commodities. The market prices of imports are a result of their FOB value, costs at port of loading and discharge, the freight and ship owner’s profit margin. Putting these costs in a structure they would reveal something like this:
MARKET PRICE Profit margin
Discharging port costs
Freight
Loading port costs
FOB
Structure of the market price of commodities.
4.3.6 Balance of payments
Efficient handling the product lowers import prices in the way explained above. In addition, more and bigger vessels calling at the port means that foreign exchange earning goes up. Both are positive contributions to the Balance of Payments (BOP) and fasten the cyclic return to equilibrium. The country's burden of investment loan repayment can be lifted and the living standard of its citizens is expected in the medium or long run to improve.
4.4 Impact on the hinterland
The hinterland served by the port of MSA includes land locked countries of Uganda, Burundi, Rwanda, South Sudan and East Zaire. The GBHL terminal is seen as a strategic food store and can become a regional hub for the region. It has potential to eliminate or minimise the necessity for small frequent shipments of products by providing the benefit of economy of scale, allowing larger shipments of bulk, fewer times in the year, thereby saving time and cost. Relief cargo can be stored in advance so that it can be obtained in real time when required.
Food aid shipments to East Africa that in the past have been channelled through the bulks’ port of Richards Bay in South Africa can now find a strategic storage nearer “home”. South Africa has been the strategic hub for the region because of its advantageous location and availability of appropriate handling and storage facility. The GBHL terminal can change this situation in the future.
4.5 Challenges of the GBHL terminal
There are factors that the terminal is faced with that may threaten the successful completion of its mission.
4.5.1 Capacity
The greatest challenge is perhaps the capacity of the terminal. With the intention of converting it into a regional hub, there is some uncertainty that it will satisfy both the capacity requirements of the country and those of the entire region of East and Central Africa, covering countries like Tanzania, Mozambique, Uganda, Rwanda, Burundi, Zaire Sudan, Ethiopia and Somalia. According to World Food Program (WFP) statistics, food-aid shipments to these countries during the period 1998/99 were about 2.1million tonnes (see appendix A). This excludes the commercial shipments for consumption locally within the countries.
4.5.2 Onward transportation by rail or road
Kenya has suffered the problem of ruined infrastructure since the torrent of the El Nino rains. The government, according to the transport act.305 of Kenya, enforced the axle load limit that took effect in October 1998, amidst cries from transport companies and manufacturers’ companies to adjust it. It made transport companies to revert to unscrupulous means of evading weighbridge stops. As a result, much cargo is being moved on the railways with negative effect on road hauliers, many of which have been forced to close shop. The enforcement was placed especially on Uganda bound cargo whose transporters use overly heavy vehicles that damage the roads quickly.
between governments is necessary to refurbish the state of roads and rails to enable not only this movement, but also virtually any kind of transportation at all.
4.5.3 Public opinion
The Kenyan press has published in recent months, several articles about the controversy existing between the bagging plant operators and the GBHL terminal operators. The port is blamed of being unfair in apportioning rates, of only US$2 for GBHL as opposed to US$13 for other conventional berth users. There is an ongoing process to review the agreement that was made with the GBHL terminal seven years ago. The port is obligated as are the terminal management, to review this tariff in order to place all the operators on some reasonable level of competition. In the author's opinion, the step to have uniform tariff for all users is not practical because credit should be given where it is due. For the operator who will have achieved handling efficiencies that reduce overall port time by a greater percentage, more concession on rates, should be given, but reasonably, in order to assure a handsome continuous flow of revenue for the port as well. The step to privatise the port has among others, a commercial objective of generation of more revenue and it will be a shame not to be able to achieve this.
Another question is that of performance. Since operations started in February, it is alledged that the terminal has not been able to achieve satisfactory levels of output to suit the requirements of some major operators. WFP therefore, still continues to use the conventional berths despite the GBHL terminal (Mayoyo, 2000).
CHAPTER V
GRAIN AND FERTILIZER MARKET ANALYSIS AND FORECAST
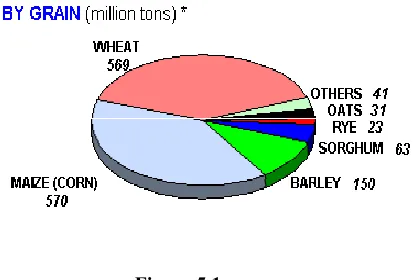
The purpose of this chapter is to perform a market survey of grain and fertiliser and to forecast the likely tonnage to pass through the port in the present decade. Data has been obtained from the World Bank, International Grains Council (IGC), World Food Program (WFP), Fearnleys, International Fetilizer Industry Association (IFA) and Kenyan national statistics. A global market analysis is made in general and the region served by two main ports of MSA and DSM are regarded in particular. The influence of the GBHL terminal is expected to be far reaching in attracting more tonnage to Kenya.
This market analysis tries to identify present users and potential future users. Regarding the present users, identifying who they are, how much traffic they offer, who the authorities are, that make the decision whether or not to ship via the port, factors that influence their decisions and the berthing and cargo handling or other services that they require to accomplish their tasks. Regarding the potential users, finding out the ability of the terminal to influence the market, by determining the regional market shares.