R E S E A R C H
Open Access
Electrical impedance imaging system using
FPGAs for flexibility and interoperability
Harsh Sohal
1, Hun Wi
1, Alistair Lee McEwan
1,2, Eung Je Woo
1and Tong In Oh
1**Correspondence: [email protected] 1Department of Biomedical Engineering and Impedance Imaging Research Center, Kyung Hee University, 446-701 Yongin, Korea
Full list of author information is available at the end of the article
Abstract
Background: Modern EIT systems require simultaneously operating multiple
functions for flexibility, interoperability, and clinical applicability. To implement versatile functions, expandable design and implementation tools are needed. On the other hand, it is necessary to develop an ASIC-based EIT system to maximize its performance. Since the ASIC design is expensive and unchangeable, we can use FPGAs as a prior step to the digital ASIC design and carefully classify which functions should be included in the ASIC. In this paper, we describe the details of the FPGA design adopted in the KHU Mark2.5 EIT system.
Methods: We classified all functions of the KHU Mark2.5 EIT system into two categories. One is the control and processing of current injection and voltage measurement. The other includes the collection and management of the
multi-channel data with timing controls for internal and external interconnections. We describe the implementation of these functions in two kinds of FPGAs called the impedance measurement module (IMM) FPGA and the intra-network controller FPGA. Results: We present functional and timing simulations of the key functions in the FPGAs. From phantom and animal imaging experiments, we show that multiple functions of the system are successfully implemented in the FPGAs. As examples, we demonstrate fast multi-frequency imaging and ECG-gated imaging.
Conclusion: Given an analog design of a parallel EIT system, it is important to optimize its digital design to minimize systematic artifacts and maximize performance. This paper described technical details of the FPGA-based fully parallel EIT system called the KHU Mark2.5 with numerous functions needed for clinical applications. Two kinds of FPGAs described in this paper can be used as a basis for future EIT digital ASIC designs for better application-specific human interface as well as hardware performance.
Keywords: Electrical impedance tomography (EIT), Field programmable gate array (FPGA), Application specific integrated circuit (ASIC), Biosignal-gated imaging, Fast multi-frequency imaging
Background
Electrical impedance tomography (EIT) is a technique for imaging conductivity distribu-tions inside the human body by injecting currents and measuring induced voltages using electrodes on the surface [1-3]. Various EIT systems have been developed by several EIT research groups [3]. As the main component for waveform generation and phase-sensitive demodulation, the existing systems used either digital signal processor (DSP) [4-6] or field programmable gate array (FPGA) [7-13]. Though there have been attempts to design
application specific integrated circuits (ASICs) for EIT [14], there is no ASIC-based EIT system yet available for imaging experiments.
Modern EIT systems require simultaneously operating multiple functions for flexibil-ity and interoperabilflexibil-ity, which are needed in clinical applications. For example, in lung EIT for real-time ventilation and perfusion monitoring, we need ECG-gated imaging, fast multi-frequency imaging, interface to mechanical ventilator and patient monitor, and so on [15,16]. To accomplish all of these, we need an EIT system with add-on functions beyond its basic imaging capability.
Development of a high-performance stable EIT system with numerous functions and high speed requires an iterative process to implement sophisticated digital as well as analog parts. For example, high-quality fast data collections in EIT require careful dig-ital controls of timing signals, switches, and digdig-ital potentiometers, which are used together with analog circuits for current sources and voltage amplifiers [8,17,18]. These are especially important in a parallel EIT system to remove systematic artifacts and max-imize performance since multiple current sources and voltmeters must be operating synchronously. Though there are various studies of analog techniques in EIT including current sources and voltage amplifiers [3,19,20], we found relatively little information on digital techniques in EIT. In this paper, we focus on the digital design of a fully parallel EIT system.
To implement versatile and expandable functions, it is desirable to use programmable and flexible tools during the system development stage. On the other hand, it is neces-sary to develop ASICs to maximize system performance for a given clinical application. Analog ASICs may improve the common-mode rejection ratio (CMRR), signal-to-noise ratio (SNR), reciprocity error (RE), and so on. We may implement numerous functions with reduced power consumption and physical size using digital ASICs. Such ASICs will also be useful for better human interface designs. ASIC designs, however, must be done carefully since the design process is expensive and unchangeable.
Lately, we have developed a fully parallel multi-frequency EIT system called the KHU Mark2.5 with various functions such as the automatic calibration, pipelining, and long-term stability [18]. Since its digital design was based on FPGAs, we could add new functions such as bio-signal gating and fast multi-frequency imaging using frequency multiplexing by changing only the FPGAs. Though Wiet aldescribed the development of the KHU Mark2.5 EIT system [18], they focused on its overall structure and performance evaluation rather that providing technical details of the FPGAs.
In this paper, we describe the details of the FPGA design in the KHU Mark2.5 EIT system to implement all of its functions using two kinds of FPGAs. Carefully classifying and implementing the functions in the FPGAs, we considered future designs of EIT digital ASICs based on the FPGA designs. For ASIC-based EIT system developments, we will propose the FPGA design described in this paper as a basis of future EIT digital ASICs.
Methods
EIT system design using FPGAs
External device
PC
Isolated control
signals
Intra-network controller FPGA
Main controller
Human interface
C
C
S
V
M
IMM
FPGA
C
C
S
V
M
C
C
S
V
M
Isolated USB
IMM
FPGA
IMM
FPGA
Figure 1 Block diagram of the KHU Mark2.5 EIT system.It consists of a DSP-based main controller, FPGA-based intra-network controller, and FPGA-based multiple IMMs. CCS and VM stand for constant current source and voltmeter, respectively.
arbitrates data exchanges among the main controller, IMMs, and external devices. We classified and implemented all functions of the system in two kinds of FPGAs; the intra-network controller FPGA and IMM FPGA.
Intra-network controller FPGA
Figure 2 shows the functional block diagram of the intra-network controller FPGA. We can configure the EIT system with different numbers of IMMs and one intra-network controller FPGA can accommodate up to 32 IMMs. By adding one intra-intra-network controller FPGA, the maximum number of IMMs is increased by 32.
The FPGA handles the command and data exchanges between the main controller and the connected IMMs. In designing the FPGA, we considered the data throughput to the main controller and the connected IMMs. Since the connection to the main controller requires fast exchanges of a large amount of data from all IMMs, we interfaced the FPGA to the main controller DSP in its external memory space.
/CS
/WR
/RD TxRxD
TxRxD
TxRxD
Event trigger
Command trigger
Data [15:0]
SyncOut
From external device To external device
EIT measurement timing
Start acquisition
Instruction decoder
Data controller
Scan time
controller
Serial communication
controller
Main controller
interface
Main controller
IMM
IMM
IMM Address [15:0]
Memory
SyncOut
SyncOut
Figure 2 Functional block diagram of the intra-network controller FPGA.It handles all the data exchanges among the main controller, IMMs, and external devices. The intra-network controller connects to all IMMs through individual synchronous serial communication channels in the star network topology.
Decoding the commands from the main controller, the intra-network controller FPGA may transmit its own commands to the IMMs through the serial communication channels and setup them for a chosen data collection protocol. When it gets a trigger command from the main controller, it initiates a series of data acquisitions by distributing timing synchronization signals calledSyncOut to all connected IMMs. Though all IMMs are independent and operate in parallel, their data acquisitions are synchronized by sharing the common clock and timing signals from the FPGA. After triggering the IMMs for their data acquisitions, the intra-network controller FPGA receives the measured data from the IMMs through the serial communications channels.
In certain applications, it is highly desirable to synchronize EIT data acquisitions and image reconstructions with physiological events such as respiration and cardiac function. For example, ECG-gated EIT imaging may separate relatively small conductivity changes related with cardiac function from larger changes associated with lung ventilation [21]. In the external event trigger mode, the intra-network controller FPGA gets a sequence of external trigger signals to control the subsequent EIT data acquisitions. Each event trigger signal may initiate one or multiple data acquisitions by distributing the synchronization signalsSyncOutto the connected IMMs.
Regardless of the operating mode, the intra-network controller FPGA can send the EIT measurement timing signal to external devices. The signal provides accurate timing infor-mation of EIT data acquisitions, which can be used to synchronize the external device with the EIT system. It may also be used to analyze measured data of the external device together with EIT images in a synchronized way. We implemented all the connections to external devices using the digital signal isolator (ADuM3100, Analog Devices, USA) with the low-voltage differential signaling (LVDS) technique for electrical safety and noise suppression.
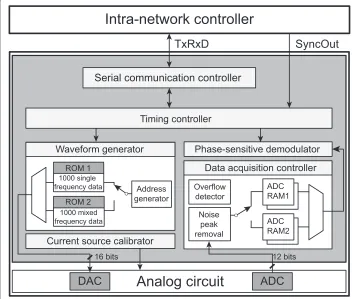
Impedance measurement module FPGA
Figure 3 shows the block diagram of the IMM FPGA. It receives the synchronization
SyncOut
TxRxD
Intra-network controller
Serial communication controller
Waveform generator
Current source calibrator
Analog circuit
Phase-sensitive demodulator
Data acquisition controller
Address generator 1000 single
frequency data ROM 1
1000 mixed frequency data
ROM 2
DAC
Timing controller
Noise peak removal Overflow
detector
12 bits
ADC
ADC RAM2 ADC RAM116 bits
Figure 3 Functional block diagram of the IMM FPGA.Each IMM is independent of all others and all of them operate in parallel. The IMM FPGA controls and manages all functions of current injections and voltage measurements during real-time projections and scans. It also controls the timing of pipelined operations, switchings, and transient removals.
the dedicated serial communication channelTxRxD. Each IMM FPGA operates indepen-dently for current injection and voltage measurement regardless of the behavior of other IMMs [18].
We define a projection as one current injection and simultaneous multiple voltage mea-surements. At least two IMMs are involved in the current injection since we need at least one current source and at least one current sink to form a balanced current source. Usually, all IMMs are used to measure the induced voltages. A scan is a collection of projections to produce a set of measured data for one image reconstruction.
Real-time EIT data acquisitions include a series of scans with multiple projections in each scan. Therefore, we constantly change parameters of current injections such as electrodes, frequencies, and amplitudes. Accordingly, there occur transients in the induced voltage signals. To properly handle all of these switchings and transients in the digitized voltage signals as well as analog signals, the IMM FPGA must carefully imple-ments all critical timing and functional controls of the real-time EIT data acquisition process.
Timing controller
projections and scans. These include the parameters for waveform generation, current source calibration, data acquisition, preprocessing, and switch control.
After receiving the synchronization signalSyncOutfrom the intra-network controller, the timing controller initiates a series of current injections and synchronous voltage data acquisitions. It generates various timing signals to coordinate all the operations of the IMM. Carefully adjusted timing controls are required to properly implement the pipeline operations [18] and the intermittent transient removals. For each projection, it gets the demodulated voltage data and transmits them to the intra-network controller through the serial communication channelTxRxD.
Waveform generator
We chose the memory-based waveform generation method using the register-transfer level (RTL) FPGA design. We used two internal ROMs to separately store 1,000 16-bit data of the single-frequency and mixed-frequency sinusoidal waveforms. The frequency is controlled by using two variables ofgapdataandclkcountas
f = fclock×gapdata
4×(clkcount+1)×100kHz, (1)
tupdate=4×(clkcount+1)×Sclk (2)
wheregapdatadetermines the incremental step size of the ROM address,tupdateis the address update time, andSclkis the period of the system clock. We can choose frequencies in the range of 10 Hz to 500 kHz.
For each projection, the timing controller sends the waveform parameters including the chosen frequencies and amplitudes. The waveform generator reads the waveform data from the memory using the timing signals properly adjusted for the chosen sinusoidal frequency and sends the data to the external 16-bit DAC (AD9783, Analog Devices, USA). It also sets the registers of the DAC for its control.
The waveform generator sends a pulse called Phase0 to the voltage demodulator. The pulse indicates the beginning of each sinusoidal period for the phase-sensitive demodulation of the induced voltage signal.
Current source calibrator
The output voltage of the DAC is converted to current using a trans-conductance ampli-fier, whose output impedance was calibrated beforehand to at least 1 Min the entire frequency range [18]. To achieve the calibrated output impedance, we should properly set the digital potentiometers (DS1267E-010, -050, Maxim Integrated Products, Inc., USA) in the trans-conductance amplifier and also in the generalized impedance converter (GIC) at the output of the amplifier. Getting the values of the digital potentiometers extracted from the calibration table for the chosen frequencies, the current source calibrator sets up the digital potentiometers before current injection in each projection. It also sets the mul-tiplying DAC (AD9783, Analog Devices, USA) to adjust the amplitude of the sinusoidal voltage waveform to reduce the dc offset current within±33 nA.
calibration table in its memory space. The voltmeter calibrations to compensate phase and gain errors are not included in the IMM but in the system software of the PC.
Data acquisition controller
The data acquisition controller provides the control signals to the external 12-bit ADC (AD9235, Analog Devices, USA). To continuously read ADC data, it uses the double buffered structure with two internal RAMs for real-time pipelined data acquisitions. When one of the RAMs is full with a predetermined amount of data, it is connected to the phase-sensitive demodulator and the other RAM is used to store the next set of data. The 12-bit ADC data is sign-extended to the 18-bit representation and the data acquisition controller performs chosen real-time preprocessing functions such as overflow detection, noise peak removal, and averaging of maximum 64 sinusoidal periods of data.
Phase-sensitive demodulator
The phase-sensitive demodulator computes the in-phase (real-part) and quadrature (imaginary-part) components,VrandVq, respectively, of the induced voltageVinas
Vr= 1
M
MN−1
i=0
Vin(i)cos 2πi
N , (3)
Vq= −
1
M
MN−1
i=0
Vin(i)sin 2πi
N . (4)
During the phase-sensitive demodulation, the 18-bit sign-extended ADC data are multi-plied with the 16-bit sinusoidal data stored in the ROM of the waveform generator. To perform 1,000 34-bit additions, we used the 44-bit arithmetic architecture to prevent overflow. It is important to carefully allocate enough memory space to prevent data loss during fast real-time demodulations.
When we measure the induced voltage at multiple frequencies, the phase-sensitive demodulations are simultaneously performed for maximum three different frequencies. For more than three frequencies, the demodulations are repeated using the same acquired ADC data and the stored sinusoidal waveform data at those frequencies.
Functional and timing simulations of FPGAs
We used the software package Quartus II (Altera, USA) for the FPGA design and sim-ulation. For the chosen FPGA (EP3C10F256, Altera, USA) at 45 MHz clock speed, we verified the design for its functions and timing. We assumed that the operating frequency of the EIT data acquisition was 11.25 kHz. We also assumed that current was injected between one neighboring electrode pair and induced voltages were measured between all neighboring electrode pairs. After finishing the simulation of each part separately, we simulated the complete FPGA design including both the intra-network controller FPGA and IMM FPGAs.
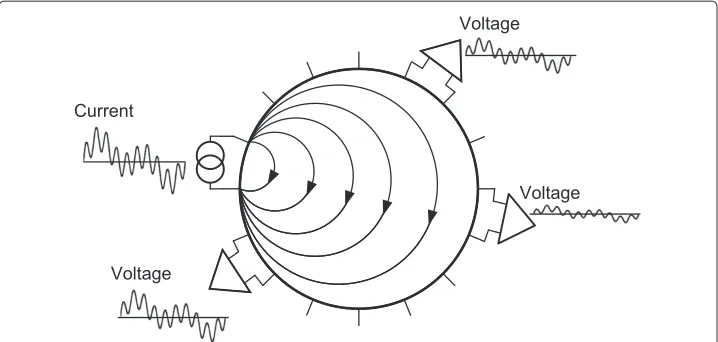
Phantom experiments of fast multi-frequency imaging
Voltage Voltage
Voltage Current
Figure 4 Conceptual diagram of multi-frequency waveform multiplexing.As an example, the mixed sinusoidal waveform with three different frequencies is used for current injection. Phase-sensitive demodulations of the induced voltage signals at the chosen frequencies are performed in parallel.
injecting current with three different frequencies. Each voltmeter simultaneously demod-ulates the induced voltages at those three frequencies at the same time. We used three frequencies considering the safe levels of injection currents and SNRs of induced voltages at chosen frequencies [22].
Animal experiments of ECG-gated imaging
We performedin vivoanimal experiments using a beagle (9 years old, female, 13 kg). The experimental protocol was approved by the Institutional Animal Care and Use Commit-tee at Kyung Hee University. Putting the animal under anesthesia following the process described in Ohet al [23], we shaved the hair around the chest and attached the EIT electrode belt with 16 Ag/AgCl electrodes. We also attached a separate respiration mon-itoring belt and ECG electrodes as shown in Figure 5. The experimental protocol was approved by the Institutional Animal Care and Use Committee at Kyung Hee University (KHUASP(SU)-11-07).
We used a custom designed device to acquire ECG and respiration signals at 500 Hz sampling frequency. Detecting R waves of the acquired ECG signal, we triggered a series of EIT scans at each R wave. We also triggered a series of EIT scans at a predetermined phase of each respiration cycle.
Results
FPGA simulation results
Figure 6(a) and (b) illustrate FPGA simulation results for 11.25 kHz sinusoidal waveform generation and data acquisition, respectively. The time for one projection was 0.58 ms. In Figure 6(a), the intra-network controller FPGA generated two consecutiveSyncOut
KHU Mark2.5
EIT
ECG Trigger
EIT reference electrode
Respiration monitoring belt
PC
ECG electrodes
EIT electrode belt
Respiration
Biosignal monitor
Ventilator with
anaesthesia
Figure 5 Animal experimental set-up.The experimental setup for monitoring of cardiac cycles and respiration with the ECG-gated EIT images on the beagle.
SyncOut TimeTrigger ProjTableSet CCSTableSet
WGOn
Phase0 ProjectionStart AcquisitionTime
SourceData
ResultOn
0us 250us 500us 750us 1ms
(a)
(b)
TimeTrigger
ProjectionStart AcquisitionTimeFlag ResultOn NewResultOn ResultOk NewResultOk FIFOLength
520.869 us 1.569 ms 2.618 ms 3.667 ms 4.175 ms 5.764 ms
Starting at the beginning of the second period, thePhase0signals were produced at every cycle of the waveform. TheProjectionStartsignal was generated at the firstPhase0
signal and properly set all analog switches. The actual data acquisition was delayed by twoPhase0signals to provide enough time for the injection current and induced voltage to be stabilized. Finishing the first projection with single-frequency current injection, the second projection was started using the mixed frequency waveform.
Figure 6(b) shows the timing details of the data acquisition from the ADC. Within each projection, the ADC acquired the voltage data during theAcquisitionTimeFlag sig-nal. Finishing the data acquisition, theResultOnsignal was generated, which turned the phase-sensitive demodulator on. TheResultOksignal indicated the end of the demodu-lation. Two other signals ofNewResultOnandNewResultOkwere used to implement the pipelined operations. TheFIFOLengthsignal indicated the size of the demodulation data stored in the FIFO. The timing controller in the IMM FPGA read the data and sent them to the intra-network controller FPGA.
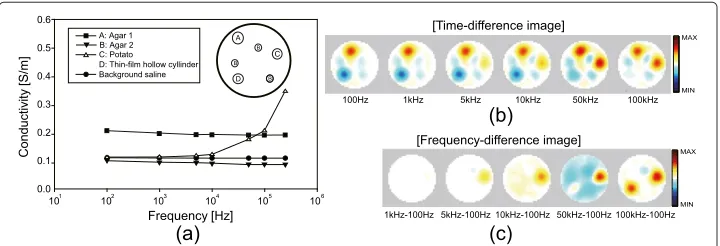
Fast multi-frequency images of phantom
Figure 7(a) shows the configuration of the saline phantom and measured conductivity spectra of the objects using the impedance analyzer (SI1260, Solatron, UK). We chose two sets of three frequencies including (0.1, 1, 5) kHz and (10, 50, 100) kHz. We could reduce the data acquisition time by 9.2% for the first set of frequencies. Amplitudes of the currents at those frequencies were adjusted to be within the safety limits [22]. We used the GREIT algorithm [24] to produce time- and frequency-difference images of the phantom. To better understand the reconstructed multi-frequency images, we summarize the conductivity distribution of the phantom, of which background was 0.12 Sm−1 saline. The object A and B were agar gels with 0.22 and 0.11 Sm−1, respectively, over the entire frequency range. The object C was a cylindrical piece of potato with 30 mm diameter. Its conductivity increased from 0.12 to 0.35 Sm−1at 100 Hz and 500 kHz, respectively. The object D was a thin-film hollow cylinder. Though we did not measure the conductivity spectrum of the object D, we can predict that its effective conductivity was very small at low frequencies and increased to a measurable value at high frequencies.
In Figure 7(b), the objects A and B appeared in all time-difference conductivity images from 100 Hz to 100 kHz since their conductivity values were constant over the frequency
A C B B B D Frequency [Hz] Conductiv ity [S/m ] 0.0 0.1 0.2 0.3 0.4 0.5 Background saline D: Thin-film hollow cyllinder B: Agar 2 C: Potato A: Agar 1
0.6
101 102 103 104 105 106
[Time-difference image] [Frequency-difference image] 100kHz-100Hz 100kHz 50kHz 10kHz 5kHz 1kHz 100Hz 50kHz-100Hz 10kHz-100Hz 5kHz-100Hz 1kHz-100Hz (a) (b) (c) MAX MIN MAX MIN
range. The object C (D) appeared in the time-difference images at high (low) frequencies and disappeared at low (high) frequencies since their conductivity values changed with frequency. Figure 7(c) shows the reconstructed frequency-difference images, which can be interpreted similarly.
Ventilation and ECG-gated images of animal
As shown in Figure 8(a), we defined two regions of interest (ROIs) marked as ROILand ROIH in the lung and heart regions, respectively. We used the mechanical ventilator (M-2002, Hallowell EMC, Pittsfield, MA, USA) to vary the respiration rate from 10 to 40 breaths/min. Figure 8(b) shows the typical EIT images of the chest at 20 breathes/min respiration rate. Figure 8(c) plots a time series of the average pixel values in ROIL, which distinguished different phases of respiration cycles. Figure 8(d) shows that the esti-mated respiration rates from the reconstructed images matched well with those of the mechanical ventilator.
A
B
C
Respiration rate from ventilator [breaths/min]
Respiration rate from images
10 20 30 40
10 20 30 40
Time[s]
MAX
MIN
(a)
)
d
(
)
c
(
ROI ROIH
ECG [mV]
Averaged pixel value in ROI
H
0 0.5 1 1.5 2 2.5 3 3.5
0 0.2 0.4 0.6 0.8
0 0.4 0.8
0.4
(e)
Time[s]
A
B
C
-0.8 -0.4 0 0.4
ROIL
Averaged pixel value in ROI
L
0
(b)
Figure 8 Animal imaging with biosignals.(a)Axial MR image of the beagle at the plane of the attached EIT electrodes.(b)Time series of time-difference images at 11.25 kHz during mechanical ventilation.(c)Plot of the average pixel values of the ROILinside the lung region.(d)Estimated respiration rate from the
reconstructed images is well correlated with the ventilator setting.(e)Plot of the average pixel values of the ROIHinside the heart region, which is well correlated with the ECG signal. ECG-gating imaging was
Figure 8(e) shows the ECG signal used for ECG-gated imaging and the time series of the average pixel values in ROIH. The changes of the pixel values well correlated with the ECG signal. From the pixel values in the heart region, we could observe about 3.2 dB (16.8%) SNR improvement in the ECG-gated images compared with those of conventional time-difference images. When we evaluated the SNR of the pixel values in the lung region, we could observe about 6 dB (13.9%) improvement when we acquired the ventilation images at a fixed time within every cardiac cycle.
Discussions
We have adopted the FPGA-based design method from the development of the KHU Mark1 EIT system to the Mark2.5 system [8,17,18]. We could enhance the performance and add new functions by improving the FPGA designs with a minimal amount hardware changes. For example, the maximum frame rate increased from 6 in the Mark1 system to 100 frames/sec in the Mark2.5 system. The SNR, RE, and stability were also improved by carefully adjusting the complicated timing signals to remove the adverse effects of switch-ings and transients. The KHU Mark2.5 system now provides versatile functions such as reconfiguration of channels, automatic calibration, arbitrary current injection patterns, data averaging, fast multi-frequency imaging, external triggering, timing signal output, and isolated interface with external devices. All of these functions add flexibility and inter-operability which are needed for clinical applications. We believe that the FPGA designs in the KHU Mark2.5 system are fully tested and can be a basis for future EIT digital ASIC designs.
We would like to highlight the parallel processing architecture of multiple indepen-dent IMMs. The intra-network controller can separately send each IMM its command tables including all the parameters of current injections and voltage measurements dur-ing a series projections and scans. Durdur-ing the development cycle, this actually added a significant amount of complexity in the FPGA designs especially for the implementation of the pipeline operation throughout the parallel system. The parallel processing archi-tecture, however, now allows us to easily implement any data collection protocols needed in different applications.
The KHU Mark2.5 system with its parallel processing architecture is, however, bulky and heavy even though it has clear advantages in terms of speed and flexibility. It also requires a large amount of power consumption due to a large number of components. For most image-based clinical monitoring applications, it is highly desirable to reduce its total power consumption as well as physical size and weight. In addition, the human interface must be greatly simplified by placing more electronics on or near electrodes.
To address these practical issues, we plan to develop two digital ASICs. The first will be a main controller ASIC, which will combine the DSP and the intra-network controller described in this paper. Using this digital ASIC, we will be able to connect the future EIT system to a PC or mobile device through wired or wireless communication channels. The second digital ASIC will include all other digital parts, ADC, and DAC to implement the functions of the IMM FPGA. We speculate that future EIT digital ASIC designs will take advantage of the current fully tested FPGA designs.
circuits and the human interface part. To further improve the system performance, it will be also desirable to develop an analog ASIC including a trans-conductance amplifier for current output and a differential voltage amplifier for voltage input.
Conclusions
Modern EIT systems require simultaneously operating multiple functions for flexibility, interoperability, and clinical applicability. In this paper, we described technical details of two kinds of FPGAs, which implemented all functions of the fully parallel multi-frequency EIT system called the KHU Mark2.5. We chose the FPGA-based method to take advan-tage of its programmability, which was needed during the development cycle. To further maximize the performance and minimize the size and weight of the system for a specific clinical application, we plan to develop an ASIC-based system. Since the ASIC design pro-cess is expensive and unchangeable, we suggest using the developed FPGAs as a test bed for future EIT digital ASIC designs.
Abbreviations
ECG: Electrocardiography; FPGA: Field programmable gate array; DSP: Digital signal processor; EIT: Electrical impedance tomography; IMM: Impedance measurement module; USB: Universal serial bus; RAM: Random access memory; CCS: Constant current source; VM: Voltmeter; FIFO: First in first out; PCB: Printed circuit board; ADC: Analog to digital converter; DAC: Digital to analog converter; SNR: Signal to noise ratio.
Competing interests
The authors declare that they have no competing interests.
Authors’ contributions
HS programmed the FPGA code, debugged the system and helped draft the manuscript. HW developed the printed circuit boards and figures for the manuscript. ALM assisted with analysis and gave critical revision for important intellectual content, EJW conceived the idea and revised the manuscript, and TIO designed the system and drafted the manuscript. All authors read and approved the final manuscript.
Acknowledgements
This work was supported by the National Research Foundation of Korea (NRF) grant funded by the Korea government (MEST) (2011-0022779, 2013R1A2A2A04016066) and a grant of the Korean Health Technology R&D Project, Ministry of Health and Welfare, Republic of Korea (HI13C13590000).
Author details
1Department of Biomedical Engineering and Impedance Imaging Research Center, Kyung Hee University, 446-701 Yongin, Korea.2The School of Electrical and Information Engineering, The University of Sydney, NSW2006, Sydney, Australia.
Received: 4 December 2013 Accepted: 25 August 2014 Published: 30 August 2014
References
1. Henderson RP, Webster JG:An impedance camera for spatially specific measurements of the thorax.IEEE Trans Biomed Eng1978,25:250–254.
2. Brown BH:Electrical impedance tomography (eit): a review.J Med Eng Technol2003,27:97–108. 3. Holder DS:Electrical Impedance Tomography: Methods, History and Applications. Bristol, UK: IOP Publishing; 2005. 4. Wilson AJ, Milnes P, Waterworth AR, Smallwood RH, Brown BH:Mk3.5: A modular, multi-frequency successor to
the mk3a eis/eit system.Physiol Meas2001,22:49–54.
5. Raymond DC, Gary JS, David GG, John CG, Newell JC, Isaacson D:Act3: a high-speed, high-precision electrical impedance tomograph.IEEE Trans Biomed Eng1994,41(8):713–722.
6. Halter RJ, Hartov A, Paulsen KD:A broadband high-frequency electrical impedance tomography system for breast imaging.IEEE Trans Biomed Eng2008,55(2):650–659.
7. Zhu QS, McLeod CN, Denyer CW, Lidgey FJ, Lionheart WRB:Development of a real-time adaptive current tomograph.Physiol Meas1994,15:37–43.
8. Oh TI, Woo EJ, Holder D:Multi-frequency eit system with radially symmetric architecture: Khu mark1.Physiol Meas2007,28:183–196.
9. Oh TI, Koo H, Lee KH, Kim SM, Lee J, Kim SW, Seo JK, Woo EJ:Validation of a multi-frequency electrical impedance tomography (mfeit) system khu mark1: impedance spectroscopy and time-difference imaging.
Physiol Meas2008,29:295–307.
10. Gaggero PO, Adler A, Brunner J, Seitz P:Electrical impedance tomography system based on active electrodes.
11. Khan S, Borsic A, Manwaring P, Hartov A, Halter R:Fpga based high speed data acquisition system for electrical impedance tomography.J Phys: Conference Series2013,434:012081.
12. Saulnier GJ, Liu N, Tamma C, Xia H, Kao TJ, Newell JC, Isaacson D:An electrical impedance spectroscopy system for breast cancer detection.InProceedings of the 29th Annual International Conference of the IEEE EMBS. August 23-26. Cité Internationale: Lyon, France; 2007:4154–4157.
13. Yue X, McLeod C:Fpga design and implementation for eit data acquisition.Physiol Meas2008,29:1233–1246. 14. Hong H, Rahal M, Demosthenous A, Bayford RH:Comparison of a new integrated current source with the
modified howland circuit for eit applications.Physiol Meas2009,30(10):999–1007.
15. Frerichs I:Electrical impedance tomography (eit) in applications related to lung and ventilation: a review of experimental and clinical activities.Physiol Meas2000,21:1–21.
16. Victorino JA, Borges JB, Okamoto VN, Matos GFJ, Tucci MR, Caramez MPR, Tanaka H, Sipmann FS, Santos DCB, Barbas CSV, Carvalho CRR, Amato MBP:Imbalances in regional lung ventilation.Am J Respir Crit Care Med2004, 169:791–800.
17. Oh TI, Wi H, Kim DY, Yoo PJ, Woo EJ:A fully parallel multi-frequency eit system with flexible electrode configuration: Khu mark2.Physiol Meas2011,32(7):835–849.
18. Wi H, Sohal H, McEwan AL, Woo EJ, Oh TI:Multi-frequency electrical impedance tomography system with automatic self-calibration for long-term monitoring.IEEE T Biomed Circ S2014,8:119–128.
19. Ross AS, Saulnier GJ, Newell JC, Isaacson D:Current source design for electrical impedance tomography.Physiol Meas2003,24(2):509–516.
20. Wilson AJ, Milnes P, Waterworth AR, Smallwood RH, Brown BH:Mk3.5: a modular, multi-frequency successor to the mk3a eis/eit system.Physiol Meas2001,22(1):49–54.
21. Vonk-Noordegraaf A, van Wolferen SA, Marcus JT, Boonstra A, Postmus PE, Peeters WL, Peacock AJ:Noninvasive assessment and monitoring of the pulmonary circulation.ERS J Ltd2005,25:758–766.
22. Romsauerova A, McEwan A, Holder DS:Identification of a suitable current waveform for acute stroke imaging.
Physiol Meas2006,27:211–219.
23. Oh TI, Jeong WC, McEwan A, Park HM, Kim HJ, Kwon OI, Woo EJ:Feasibility of magnetic resonance electrical impedance tomography (mreit) conductivity imaging to evaluate brain abscess lesion: In vivo canine model.J Magn Reson Imaging2013,38(1):189–197.
24. Adler A, Arnold JH, Bayford R, Borsic A, Brown B, Dixon P, Faes TJ, Frerichs I, Gagnon H, Garber Y, Grychtol B, Hahn G, Lionheart WR, Malik A, Patterson RP, Stocks J, Tizzard A, Weiler N, Wolf GK:Greit: a unified approach to 2d linear eit reconstruction of lung images.Physiol Meas2009,30:35–55.
doi:10.1186/1475-925X-13-126
Cite this article as:Sohalet al.:Electrical impedance imaging system using FPGAs for flexibility and interoperability.
BioMedical Engineering OnLine201413:126.
Submit your next manuscript to BioMed Central and take full advantage of:
• Convenient online submission
• Thorough peer review
• No space constraints or color figure charges
• Immediate publication on acceptance
• Inclusion in PubMed, CAS, Scopus and Google Scholar
• Research which is freely available for redistribution