Research Journal
Volume 10, No. 32, Dec. 2016, pages 184–192
DOI: 10.12913/22998624/65115 Research Article
PERORMANCE EVALUATION OF LIQUID-COOLED PHOTOVOLTAIC SYSTEM
USING NUMERICAL METHOD
Yasamin Khanjari1, Alibakhsh Kasaeian1, Fatolah Pourfayaz1, Reza Alayi2
1 Department of Renewable Energies, Faculty of New Science and Technologies, University of Tehran, Tehran,
Iran, e-mail: [email protected]
2 Department of Mechnical Engineering, Germi Branch, Islamic Azad University, Germi, Iran, e-mail: reza.alayi@
yahoo.com
ABSTRACT
The purpose of present study is establishing a simulation model to consider the
per-formance of a water photovoltaic thermal system (PV/T) via the computational fluid
dynamics method (CFD). The proposed model includes a water riser tube and an ab-sorber plate to consider the conduction and convection heat transfer mechanisms. The
simulation procee was carried out in the ANSYS FLUENT software. The effects of two different parameters on the efficiency and performance of the system were in -vestigated numercically. The performance of the PV/T system versus the changes on
the absorbed radiation on the plate and the inlet fluid temperature were analyzed. The temperature distribiution of different sections of the system was obtained. For
validation of the presented method, a comparison study was carried out with the ex-perimental results in the literature; satisfactory convergences were found between the measured data and the experimental results.
Keywords: photovoltaic thermal; water-cooled; simulation; performance.
INTRODUCTION
Energy is the most essential necessity of any industry in the world. Due to environmen-tal challenges and limitation of traditional fossil resources, renewable energy has been introduced as a clean and environment-friendly substitute
for fossil fuels. Among different types of renew -able energies, solar is one the most promising sources. The conversion of solar radiation into electricity is performed in photovoltaic cells. In-tense radiation of sunlight on PV module in high ambient temperature results in rising temperature
and electrical efficiency drop. With passing a flu
-id behind the PV panel, the electrical efficiency loss will be prevented. The heated fluid can also
be used for various thermal applications. Photo-voltaic thermal or PV/T devices are new hybrid energy capturing tools that that combine photo-voltaic technology and solar thermal collectors
to produce both electricity and heat from solar
radiation at the same time. PV/T can be utilized
in places with limited access to grid power. Also this technology can be implemented in power generation industry to provide preheated water
in industrial scale. Among the fluids that can be
circulated in PV/T, water is the most common.
Water PV/T systems have higher efficiency com -pared to air PV/T systems [15]. Considering dif-ferent structures, sheet and tube is easy to
manu-facture, but has 2% less efficiency compared to
other types of water PV/T [6]. More than 75% of all installed PV/T systems in the world are water types, especially sheet and tube [1].
Zondag et al. [18] investigated the efficiency of different PV/T systems in a theoretical study. The nine different designs were evaluated. The
best thermal performance is gained by the chan-nel-above-PV design, the two-cover sheet-and-tube design and the insulated two-absorber.
thermore, the types of their PV lower channels
reached near the highest efficiency value in nine different designs. Although the sheet and tube de -sign is a better choice due to ease of construction. Modeling of solar irradiation, convection and radiation heat transfer mechanisms are studied via CFD method by Selmi et al. [12]. It was ob-served that the temperature is lower in the case of
using forced flow water than that of without flow.
A similar experimental setup was built to con-sider validation of simulation model. There was a good agreement between the experimental and simulated results. Siddiqui et al. [17] developed a numerical model to compare hybrid PV/T sys-tem and PV module. The electrical and thermal sections were coupled to obtain a multi-physics
model. The effect of some parameters such as ab -sorbed radiation, thermal contact resistance, inlet temperature and inlet velocity were also investi-gated. It was deduced that PV/T systems can be applied in places with high solar irradiance and ambient temperature.
A dynamic simulation was implemented by Bhattarai et al. [3] to compare the performance of sheet and tube PV/T system with solar collec-tor. They developed a one-dimensional model by
solving energy conservation equations in differ -ent sections of the system simultaneously. The numerical results were in a good agreement with the measured data from experimental setup. It
was found that daily thermal efficiency of solar
collector was 18% greater than that of the PV/T
system. While the primary energy saving of the
PV/T system was higher than that of the solar collector.
Cerón et al. [4] developed a
three-dimen-sional model for sheet and tube flat plate collec
-tor. In their investigation, different heat transfer
mechanisms were considered in a steady coupled simulation. The numerical results were validated with experimental data and the common correla-tions of heat transfer. More over Nusselt number
of convection heat transfer for water fluid inside
the tubes was derived.
An innovative design of PV/T system with roll-bond structure was represented by Aste et al. [2]. Also a simulation model was obtained by solving the related energy balances of the sys-tem to evaluate the thermal and electrical per-formance. An experimental PV/T prototypes had been installed and monitored during 18 months by Haurant et al. [11]. They also represented a simulation model for mentioned PV/T system in
TRNSYS. The results of simulation and moni-tored data were compared. Good agreement was observed between simulation and experimental results. A prototype of mono-crystalline silicon module had been experimented to consider the
effect of using water-cooling on performance by
Spertino et al. [13]. Also using a low weight plas-tic-laminated sandwich instead of glass was
test-ed. The results indicate that working fluid must be
used according to the location and the season of the year. Variation of the performance
improve-ment versus flow rates of fluid are studied in daily
simulations.
Tse et al. [16] examined advantages of using
water PV/T system in office scale building. This
system supported electricity and hot water de-mand by computer program. An economic analy-sis was also carried out to consider the time value
of money. The study reflected the potential of ap
-plying PV/T technologies in real office buildings
in a certain climatic region like Hong Kong. As discussed above about the literature, the previous numerical or theoretical studies in the
field of PV/T systems were mainly based on solving energy balance equations for specific
cases. Lack of a general method in which we can perform a parametric analysis is observed in literature. CFD is a suitable tool for predicting
different variable distribution and values in all
sections of system. Literature review reveals that
CFD is applied rarely in field of PV/T. In fact,
the numerical works using CFD are often related to other solar systems such as trough collectors
or flat plate collectors [8,9]. The objective of
the present work is to propose a comprehensive numerical simulation by using CFD method to evaluate the performance of a photovoltaic
ther-mal system. The effects of inlet fluid temperature
and absorbed solar radiation on performance are
investigated in the ANSYS fluent. The results are represented in a form of heat transfer coefficient,
outlet temperature, and absorber plate
tempera-ture and energy efficiencies (both electrical and
thermal).
DESCRIPTION OF THE MODEL
GEOMETRY
The geometry model is drawn in CATIA soft-ware and then imported to ANSYS workbench.
The analysis is carried out in ANSYS fluent. The
a photovoltaic panel and a thermal sheet and tube
collector in the configuration of header and riser.
Five same riser tubes are used. In order to reduce the calculation cost of simulation, the model can be
simplified to just one riser tube [5, 7, 14]. A sketch of initial and final model created in ANSYS are
shown in Figure 1. AlsoRelevant dimensions of
different sections gathered in Table 1.
FLUID FLOW CHARACTERISTICS
The Reynolds number and the Grashof
num-ber are examined to find out the flow regime for
forced convection and natural convection, respec-tively. The Richardson number is calculated to
consider whether the fluid flow is natural, forced
or mixed. Gravitational acceleration as a func-tion of the setup tilt angle must be accounted in the simulation procedure. In constant velocity of
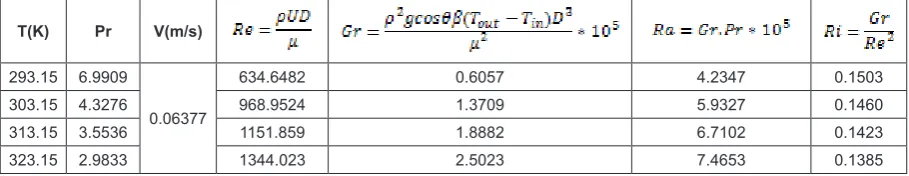
0.06377 m/s and tilt angle of 35ᵒ, the dimension -less numbers are computed. Dimension-less num-bers are tabulated in Table 2. Results show that in
the present work, the fluid flow is laminar, mixed
and fully developed.
Re, Pr, Gr, Ra and Ri are referred to Reyn-olds, Prandtl, Grashof, Rayleigh and Richardson numbers, respectively. In which, T is temperature (K), V is velocity of the water (m/s), µ is the
vis-cosity of water (Pa.s), ρ is density of water (kg/
m3), D is hydraulic diameter (m), g is
gravitation-al acceleration (m/s2) and β is setup tilt angle (°).
The subscripts of out and in represent the outlet and inlet conditions, respectively.
Fig. 1. Sketch of the initial (left) and final model (right)
Table 1. Dimensions and characteristics of different sections of the model
Risers Tubes Absorber Plate Photovoltaic panel Glass
Number: 5 Length:2(m) Number of cells: 60 Length: 1.64(m) Emissivity: 0.88
Thickness: 0.001(m) Width: 1(m) ηr =12% at 0° C Width: 0.99(m)
Outer diameter: 0.01(m) Thickness: 0.002(m) βr=0.0045 °C-1 Absorptance: 0.9
Length: 2(m) Emissivity: 0.88
Spacing: 0.2 (m)
ηr and βr are the nominal cell efficiencyand temperature coefficient (°C-1), respectively. These parameters are supplied by the PV module manufacturer.
Table 2. Dimensionless numbers in constant velocity
T(K) Pr V(m/s)
293.15 6.9909
0.06377
634.6482 0.6057 4.2347 0.1503
303.15 4.3276 968.9524 1.3709 5.9327 0.1460
313.15 3.5536 1151.859 1.8882 6.7102 0.1423
GOVERNING EQUATIONS, BOUNDARY
CONDITIONS AND SOLVER SETTINGS
The conservation laws of mass, momentum and energy in steady-state conditions are present-ed below:
Continuity Equation Momentum
Equation Energy Equation
In the above equations, P, τ, k and Cp represent pressure (N/m2), tension (N/m2), thermal conduc-tivity (W/mK) and specific heat (J/kgK), respec -tively. Also, subscript w is used for water.
The pressure-based solver is activated in present model. Pressure is coupled to veloc-ity by the SIMPLE scheme. The interpolation
scheme for the convection and diffusion is the
second order upwind. The solution is converged when the residual values of velocity, continu-ity and energy reach to 10e-4, 10e-3, and 10e-6, respectively.
The ‘velocity inlet’ and ‘pressure outlet’ boundary conditions are applied at the inlet and outlet of tube, respectively. The no-slip wall and impermeable boundary conditions have been used over the walls. The absorbed solar radiation on the absorber plate is computed by Eq. (1). In
fact, the equivalent heat flux is utilized as a wall
boundary conditions of the plate.
(1)
where: q – heat flux on the plate(W/m2), G – solar radiation intensity(W/m2), τ – transmitivity,
α – absorbtance, η – efficiency.
Subscripts abs, t, g are used instead of ab-sorbed, total and glass cover.
The thermal and electrical efficiencies of the
PV/T system are obtained as followings:
(2)
(3)
(4) (5)
where: ṁ – mass flow rate (kg/s),
A – area (m2),
P – packing factor.
Subscripts P, PV and cell are displayed for plate, photovoltaic and solar cell.
MESH GENERATION AND GRID
INDEPENDENCY TEST
A mesh is a discretization of a domain exist
-ing in one, two or three dimensions. When the ge -ometry is meshed, then the conservation laws can be applied in all elements created. After geometry drawing, grid generation is the second process involved in computing numerical solutions. The result of the solution depends upon the quality of
grid. The absorber plate and fluid body of domain
were meshed with the sweep and Patch-conform-ing mesh method, respectively. In order to make a
boundary layer for fluid body, layers close to tube walls are inflated.
A grid study is carried out to consider the
pre-cision of the obtained results. The findings of four different grids with 882722, 921507, 1075904
and 1449128 element numbers are evaluated. The maximum water outlet velocity, the water outlet
temperature and the average heat transfer coeffi -cient are examined. It is observed that further
re-finement on the grid with 882722 does not have a remarkable effect on the solutions, and just im
-poses heavier computational cost on project. The
percentage of parameter change due to mesh
re-finement even could not reach 3%. Thus, the last
grid with the fewest number of elements (882722)
is selected as an optimized computational domain.
VALIDATION OF SIMULATION MODEL
The represented simulation model of PV/T
system is verified by comparing the obtained re
-sults with experimental findings [3]. Thermal ef
-ficiency is plotted versus (𝑇𝑖𝑛𝑙𝑒𝑡−𝑇𝑎𝑚𝑏𝑖𝑒𝑛𝑡)/G based on following equation:
(6) where: FR and (τα) are flow rate factor and Trans -mitivity–Absorptivity product, respectively. Also amb subscript is used to show ambient conditions.
The solar incident radiation, tilt angle of setup
-mental data of 800 W/m2, 20° and 0.044 kg/s, re
-spectively. In various inlet temperatures, outlet parameters are monitored in numerical model. The obtained results are shown in Figure 2.
A similar trend is observed in data gathered from both simulation and experimental data. In order to evaluate the accuracy of numerical
re-sults and measure the difference between pre -dicted and observed values, statistical formula-tions of RMSE and MAE are calculated in both for mentioned validations. RMSE and MAE are determined by the following equations:
(7)
(8)
RMSE and MAE are Root mean square error and Mean absolute error, respectively. In which, e is Theoretical value, m is Experimental value and n is Number of the values.
In Figure 2, RMSE and MAE are computed 9.9% and 9.8%, respectively. Therefore, it is de-duced that there is a good agreement between ex-perimental and simulation results.
RESULTS AND DISCUSSION
Absorbed Solar Radiation Variations
Absorbed solar radiation is the most important
factor in the heating of the fluid passing the tubes.
When the solar radiation entered the photovoltaic,
a certain percentage of arrived energy converts to electricity. The amount of electricity production
is proportional to efficiency of PV panel. The re -maining part of radiation transmits the PV panel and reaches to absorber sheet and tube. In this
way, energy is transferred to fluid. This procedure
leads to sheet and tube cooling and consequently
fluid heating. In this investigation, the absorbed radiation is varied from 200 W/m2 to 800 W/m2, in
constant inlet water velocity of 0.06377 m/s and inlet water temperature of 303.15 K.
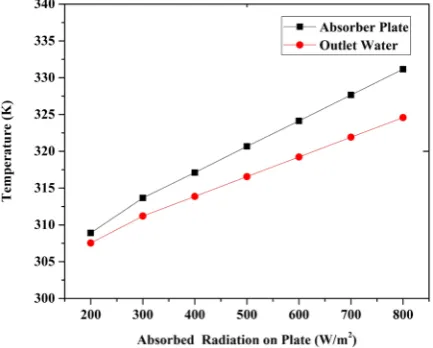
In Figure 3, the variations of the outlet fluid
temperature and absorber plate temperature ver-sus absorbed solar radiation are displayed. As the
absorbed solar radiation increases, the outlet fluid
temperature grows. It is obvious that the greater absorbed solar radiation would lead to higher ab-sorber plate temperature.
The variation of the average heat transfer
coefficient versus absorbed solar radiation is il
-lustrated in Figure 4. Heat transfer coefficient is mainly influenced by heat transfer properties.
In fact, it is not dependent to environmental fac-tors such as absorbed solar radiation. Therefore, increasing the absorbed solar radiation does not
have a significant effect on the heat transfer per -formance of the PV/T system.
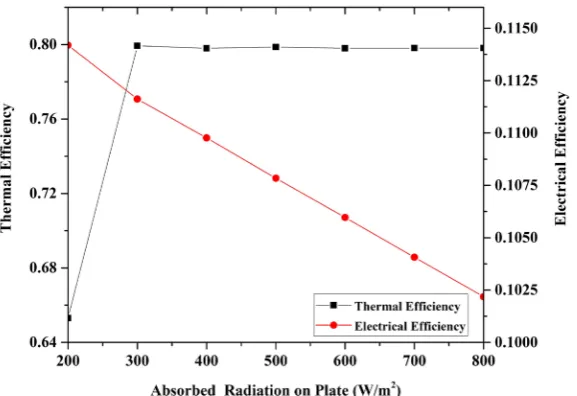
According to Eq. (2), Thermal energy efficien -cy is mostly dependent on outlet temperature and absorbed radiation on the plate. Figure 5 indicates
the variation of efficiencies versus the absorbed
solar radiation. At low absorbed solar radiation,
thermal efficiency increases. While in medium and high absorbed solar radiations, thermal effi
-Fig. 2. Validation of PV/T model via experimental results [3]
Fig. 3. Variation of the outlet fluid temperature and
ciency remains fixed approximately. The reason
may be due to simultaneous increase of absorbed solar radiation and outlet temperature. In fact, outlet temperature increases with increasing the absorbed solar radiation. Consequently, the
ther-mal efficiency remains approximately fixed. The electrical efficiency of the PV/T panel decreases
as the cell temperature increases. This fact is proved by Eq. (4).
Considering variation of thermal efficiency
versus reduced temperature factor is a suitable key for determination of thermal characteristics of PV/T system, according to Eq. (6). Thermal
efficiency of PV/T system is plotted against re -duced temperature factor or (𝑇𝑖𝑛−𝑇𝑎𝑚𝑏)/Gt in Fig. 6. As it can be seen in Fig. 6, the maximum
ther-mal efficiency reaches up to around 80%.
Inlet Water Temperature Variations
Inlet water temperature can influence water
heating and sheet and tube cooling process. In
many references [10], inlet fluid temperature rise is leading to probable reduction of thermal efficiency (or remaining fixed) andalmost definite decrease in electrical and overall efficiency. Absorbed so
-lar radiation has a significant effect on selection of an optimized value for inlet water temperature. At
high absorbed solar radiation amounts, the cooling
effect of passing water with relatively high inlet
temperature, is almost remarkable as well. At low absorbed solar radiation values, high inlet water temperatures lead to heat the PV cells
instanta-neously. While low inlet water temperatures have
a cooling effect at all solar radiation levels. There
-Fig. 4. Variation of the heat transfer coefficient versus
absorbed solar radiation
Fig. 5. Variation of efficiencies versus the absorbed solar radiation
Fig. 6. Variation thermal efficiency against reduced
fore, the lower inlet temperature provides a more appropriate conditions for PV/T system. It must be noted that raising inlet water temperature and consequently operation temperature of system, heat transfer characteristics such as convection
heat transfer coefficient varies.
In the present work, the inlet water
tempera-ture is varied from 20 ᵒC to 50 ᵒC in constant absorbed solar radiation of 600W/m2 and tilt angle of 35ᵒ. The variations of the outlet water
temperature and absorber plate temperature ver-sus the inlet water temperature are indicated in Figure 7. As can be observed in Figure 7, tem-perature increase at tube outlet is mainly
depen-dent to inlet water temperature. So it is realized
that the higher inlet water temperature causes in greater outlet temperature. Also greater inlet
water temperature would lead to higher absorber plate temperature.
Figure 8 displays the variation of the
ef-ficiencies versus the inlet water temperature. Thermal efficiency remains approximately fixed
with respect to increasing the inlet water tem-perature. Increasing the inlet water temperature increases the absorber plate temperature. This would cause in PV panel temperature rise.
Con-sequently, electrical efficiency fall is expected in
such circumstances.
In low inlet water temperature, heat
trans-fer coefficient has not been varied significantly. Whereas in higher inlet water temperature, opera -tional temperature of PV/T system increases. This
results in heat transfer coefficient improvement.
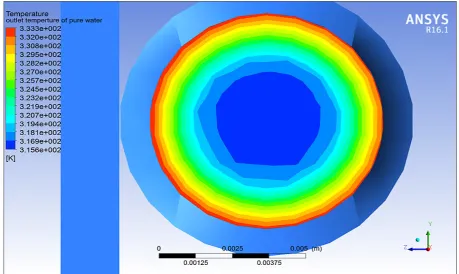
In the current investigation, the temperature distribution is considered in form of contour. The temperature contour for absorber plate and outlet water is illustrated in Figures 9 and 10. The temperature contour is obtained with the
tilt angle of 35ᵒ, inlet water velocity of 0.06377
m/s, inlet water temperature of 303 K, and
so-lar radiation of 800 W/m2. As can be seen in
the sketch of the model in Figure 1, the tube is placed at the middle of the absorber plate. It is observed that temperature increases in the paths of both tube center to the wall, and inlet to the outlet. The temperature contour of the absorber plate shows excess temperature at the edge of the absorber plate. This is due to the fact that this part of absorber plate does not contain the
tube cooling effects. Thus, there is no effective
heat sink at these locations and this results in rising the temperature.
Fig. 8. Variation of efficiencies versus the inlet water temperature
Fig. 7. Variation of the outlet fluid temperature and
Fig. 9. Temperature distribution of absorber plate
Fig. 10. Temperature distribution of outlet water
CONCLUSIONS
The current study aims to consider the per-formance of a liquid-based PV/T system by a nu-merical investigation. An attempt is being made
in this paper to numerically analyze the liquid
cooled PV/T system using the CFD method. In
the present work, a 3D model of a simplified
thermal analysis. For obtaining the numerical
re-sults, the conjugate heat transfer analysis meth
-odology was applied. The effects of varying the
inlet water temperature and absorbed solar radia-tion are considered. The temperature distribution through the absorber plate and the outlet water temperature are evaluated in form of temperature contours. The measured data attained by the CFD simulations were compared with experimental re-sults in the literature. The numerical simulation results are in good agreement with the experi-mental measurements in the literature.
REFERENCES
1. Aragonés-Beltrán P., Chaparro-González F., Pas
-tor-Ferrando J.-P. and Pla-Rubio A. An AHP (Ana -lytic Hierarchy Process)/ANP (Ana-lytic Network Process)-based multi-criteria decision approach for the selection of solar-thermal power plant
in-vestment projects. Energy, 66, 2014, 222–238.
2. Aste N., Leonforte F. and Del Pero C. Design, modeling and performance monitoring of a pho-tovoltaic–thermal (PVT) water collector. Solar Energy, 112, 2015, 85–99.
3. Bhattarai S., Oh J.-H., Euh S.-H., Krishna Kafle
G. and Hyun Kim D. Simulation and model vali-dation of sheet and tube type photovoltaic thermal solar system and conventional solar collecting system in transient states. Solar Energy Materials and Solar Cells, 103, 2012, 184–193.
4. Cerón J.F., Pérez-García J., Solano J.P., García A. and Herrero-Martín R. A coupled numerical model for tube-on-sheet flat-plate solar liquid
collectors. Analysis and validation of the heat transfer mechanisms. Applied Energy, 140, 2015, 275–287.
5. Chow T.T. Performance analysis of photovoltaic-thermal collector by explicit dynamic model. So-lar Energy, 75(2), 2003, 143–152.
6. Chow T.T. A review on photovoltaic/thermal hybrid solar technology. Applied Energy, 87(2), 2010, 365–379.
7. Ekramian E., Etemad S.G. and Haghshenasfard M. Numerical analysis of heat transfer
perfor-mance of flat plate solar collectors. Journal of
Fluid Flow, Heat and Mass Transfer, 1, 2014, 38–42.
8. Kasaeian A., Eshghi A.T. and Sameti M. A review
on the applications of nanofluids in solar energy
systems. Renewable and Sustainable Energy Re-views, 43, 2015, 584–598.
9. Mahian O., Kianifar A., Kalogirou S.A., Pop I.
and Wongwises S. A review of the applications of nanofluids in solar energy. International Journal
of Heat and Mass Transfer, 57(2), 2013, 582–594. 10. Moradi K., Ali Ebadian M. and Lin, C.-X. A
re-view of PV/T technologies: Effects of control pa
-rameters. International Journal of Heat and Mass
Transfer, 64, 2013, 483–500.
11. Perino M., Corrado V., Haurant, P., Ménézo, C.,
Gaillard, L. and Dupeyrat, P. Numerical Model of
a Solar Domestic Hot Water System Integrating
Hybrid Photovoltaic/Thermal Collectors. Energy Procedia 78, 6th International Building Physics Conference, IBPC, Torino, Italy 2015, 1991–1997. 12. Selmi M., Al-Khawaja M.J. and Marafia A. Vali
-dation of CFD simulation for flat plate solar en -ergy collector. Renewable En-ergy, 33(3), 2008, 383–387.
13. Spertino F., D’Angola A., Enescu D., Di Leo P.,
Fracastoro G.V. and Zaffina R. Thermal–electri -cal model for energy estimation of a water cooled photovoltaic module. Solar Energy, 133, 2016, 119–140.
14. Tagliafico L.A., Scarpa F., Tagliafico G. and Val -suani F. An approach to energy saving assessment of solar assisted heat pumps for swimming pool water heating. Energy and Buildings, 55, 2012, 833–840.
15. Tonui J.K. and Tripanagnostopoulos Y.
Air-cooled PV/T solar collectors with low cost per-formance improvements. Solar Energy, 81(4), 2007, 498–511.
16. Tse K.-K., Chow T.-T. and Su Y. Performance evaluation and economic analysis of a full scale water-based photovoltaic/thermal (PV/T) system
in an office building. Energy and Buildings, 122,
2016, 42–52.
17. Usama Siddiqui M., Arif A.F.M., Kelley L. and Dubowsky S. Three-dimensional thermal model-ing of a photovoltaic module under varymodel-ing con-ditions. Solar Energy, 86(9), 2012, 2620–2631. 18. Zondag H.A., de Vries D.W., van Helden W.G.J.,
van Zolingen R.J.C. and van Steenhoven A.A. The yield of different combined PV-thermal collector