Optimization of the pulsed electric field-assisted extraction of
functional compounds from Nepeta binaludensis
Afsaneh Azimi Mahalleh
1, Parvin Sharayei
2*, Seyed Ali Mortazavi
3,
Elham Azarpazhooh
2, Razieh Niazmand
4(1. Ph.D. student, Department of Food Science & Technology, Sabzevar Branch, Islamic Azad University, Sabzevar, Iran; 2. Assistant professor, Agricultural Engineering Research Department, Khorasan Razavi Agricultural and
Natural Resources Research and Education Center, AREEO, Mashhad, Iran;
3. Professor, Department of Food Science & Technology, Sabzevar Branch, Islamic Azad University, Sabzevar, Iran; 4. Associated professor, Department of Food Chemistry, Research Institute of Food Science and Technology, Mashhad, Iran)
Abstract: Pulsed electric field (PEF) treatment was used for extracting effective components from Nepeta (Nepeta binaludensis Jamzad). A response surface method was used to investigate the effects of independent process variables (voltage of pulsed electric field (VPEF): 2, 4 and 6 kV cm-1 and number of pulsed electric field (NPEF): 20, 40 and 60 n) on the yield (Y) and
antioxidant characteristics: total phenolic compounds (TPC), 1,1- diphenyl -2- picrylhydrazyl free radical scavenging (DPPHsc),
ferric reducing-antioxidant power (FRAP), half maximal of radical-scavenging activity (IC50) of Nepeta extract (aerial parts).
According to Derringer’s desired function approach, the optimal conditions based on both individual and combinations of all process variables were VPEF 6 kV cm-1 and NPEF 60 n. At this optimum condition, the Y, TPC, DPPH
SC, FRAP, and IC50 of
the extract were found to be 11.36%, 417.85 mg GA g-1, 74.8%, 1688.53 µmol Fe2+ g-1, and 0.32 mg mL-1, respectively. The
experimental values were in a good agreement with the predicted values. Also, the extract at optimal conditions of PEF (PEFopt-x) had a higher quantity of chlorogenic acid, caffeic acid, rutin, para-coumaric acid, rosemarinic acid, kaempferol, and
apigenin compared with solvent extract. The addition of PEFopt-x to the purified soybean oil at the levels of 6% increased
oxidative stability index (2.65 h) close to butylated hydroxy toluene (2.78 h).
Keywords: phenolic compounds, Nepeta binaludensis, response surface methodology, pulsed electric field, antimicrobial activity
Citation: Azimi Mahalleh A., P. Sharayei, S. A. Mortazavi, E. Azarpazhooh, and R. Niazmand. 2019. Optimization of the pulsed electric field-assisted extraction of functional compounds from Nepeta binaludensis. Agricultural Engineering International: CIGR Journal, 21(4): 184–194.
1 Introduction
Extraction plays a significant and crucial role in the final result and outcome of any medicinal plant. The qualitative and quantitative studies of bioactive compounds from plant materials mostly rely on the selection of proper extraction method. Extraction of plant
Received date: 2018-08-15 Accepted date: 2018-11-01 * Corresponding author: Parvin Sharayei, Agricultural Engineering Research Department, Khorasan Razavi Agricultural and Natural Resources Research and Education Center, AREEO, Mashhad, Iran, PoBox: 488. Email addresses: parvin_sharayei@ yahoo.com.
Pulsed electric field (PEF) has attracted particular attention due to their simplicity, environment friendliness, economy, consistency and high efficiency for the determination of bioactive compounds and microbial decontamination (Aadil et al., 2015). Use of PEF has been shown to be promising for intracellular extraction from plant food materials. The application of PEF treatment before extraction provokes cell membranes damage, thus facilitating subsequent extraction of nutritionally valuable compounds. Depending on electric conditions, such as electric field strength and number of pulses, PEF-treatment could also control the selectivity of extraction by regulating the degree of membrane destruction (Fincan et al., 2004). To the best of our knowledge, the influence of PEF for the recovery of valuable compounds from Nepeta binaludensis has not been reported yet.
Nepeta is a large genus belonging to the Lamiaceae
family. This genus comprises about 280 species distributed in the central and southern parts of Europe, Asia, and the Middle East. Nepeta binaludensis Jamzad is an endemic and rare perennial medicinal plant which distribute in a limited area in Binalud Mountains in the northeast of Iran (Nadjafi et al., 2012). A lot of species of this genus are used in folk medicine as diuretic, diaphoretic, antitussive, antispasmodic, anti-asthmatic, febrifuge, emmenagogue, and sedative effects. Nepeta species contain bioactive phytochemicals such as phenolics, flavonoids, and terpenoids (Formisano et al., 2011).
Response surface methodology (RSM) is a useful tool for evaluating multiple parameters and their interactions using quantitative data; it is an efficacy mathematical and statistical technique for optimizing complex extraction procedures, thus reducing the number of experimental trials required (Bashi et al., 2012).
The main goal of this study was to evaluate and optimize the PEF extraction procedure for maximizing the yield of phenolic compounds and antioxidant activity from aerial parts of Nepeta.
2 Materials and methods
2.1 Plant material
The N. binaludensis were collected during the
flowering stage of the plant, from Binaloud (Khorasan-Razavi province, Iran) in May. The aerial parts of N. Binaludensis were dried in the shade for one week and then were ground to a fine powder in a mill (Mulinex, Depose-Brevete S.G.C.G., France). The powders were sieved in order to maintain particle size unity (400 µm) and then were sealed under vacuum in dark plastic bags to protect from light and were kept at room temperature until used for further studies. Refined, bleached and deodorized soybean oil with no added antioxidants was supplied by Segol (Nishaboor, Iran).
2.2 Chemicals
2, 4, 6-tris (2-pyridyl)-s-triazine (TPTZ), Folin–Ciocalteu reagent, gallic acid, 2, 2-diphenyl-1-picrylhydrazyl (DPPH), and all other chemicals and solvents used in this research were obtained from Sigma-Aldrich and Merck.
2.3 Experimental design
A face centered experimental design (FCED) response surface methodology was constructed using Design-Expert version 10.0.3 software (Minneapolis, USA). It was used to evaluate the effect of independent variables [voltage of pulsed electric field, VPEF (X1) and
number of pulsed electric field, NPEF (X2)] on the
extraction yield (Y; %), total phenolic content (TPC, mg gallic acid equivalents (mg GA) g-1), ferric
reducing-antioxidant power (FRAP, µmol Fe2+ g-1),
1,1-diphenyl -2-picrylhydrazyl free radical scavenging (DPPHSC, %) and the extract concentration providing half
maximal (50%) of radical-scavenging activity (IC50,
mg mL-1). The design comprises 13 sets of test conditions
for each extraction method where three levels were attributed to each factor at high, central, and low levels, with additional five replicated center points. Each variable was coded at three levels of –1, 0 and +1 (Table 1). Maximum and minimum treatment levels were selected by carrying out preliminary screening tests and according to the literature reports and instrumental aspects.
2.4 Pulsed electric field extraction
field treatment was applied using a Pure Pulse and a batch one-liter treatment chamber with two parallel stainless electrodes. A pulse frequency of 1 Hz was used. 10 g dried plant powder was introduced between the electrodes, and 100 mL of ethanol solvent (1:10 w/v) was added. Pulse generator with voltage of 6 kV and 60 pulses was applied at ambient temperature to the treatment chamber
(in preliminary study, extraction conditions, i.e. voltage (4-6 kV cm-1) and number of pulse electric field (20-60 n)
were optimized for achieving the best extraction yield of antioxidant compounds). Then the mixture was agitated for 48 h in dark at ambient temperature. The solvent was evaporated in vacuum at 40°C. The dried extract (PEFx)
was stored at –18°C until use.
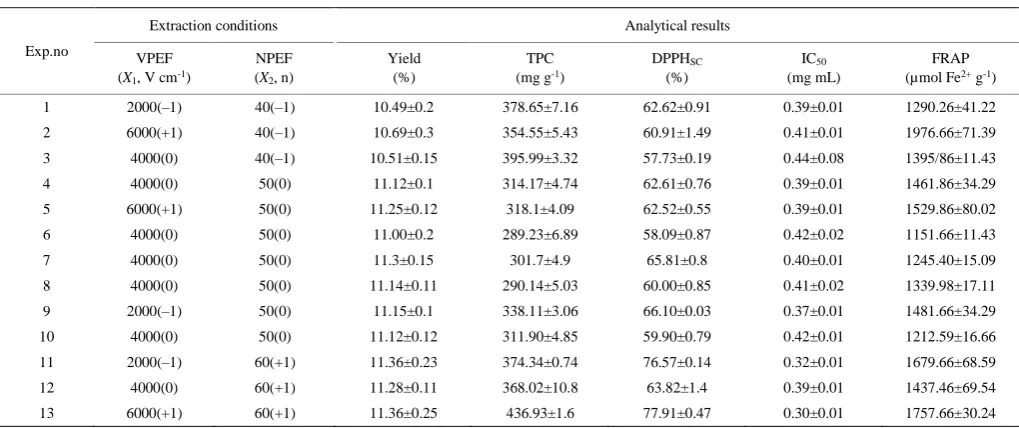
Table 1 Face-centered composite design of PEF with two variables with the resulting quality response parameters of ethanolic
extract of Nepeta
Exp.no
Extraction conditions Analytical results
VPEF (X1, V cm-1)
NPEF (X2, n)
Yield (%)
TPC (mg g-1)
DPPHSC
(%)
IC50
(mg mL)
FRAP (µmol Fe2+ g-1)
1 2000(–1) 40(–1) 10.49±0.2 378.65±7.16 62.62±0.91 0.39±0.01 1290.26±41.22 2 6000(+1) 40(–1) 10.69±0.3 354.55±5.43 60.91±1.49 0.41±0.01 1976.66±71.39 3 4000(0) 40(–1) 10.51±0.15 395.99±3.32 57.73±0.19 0.44±0.08 1395/86±11.43 4 4000(0) 50(0) 11.12±0.1 314.17±4.74 62.61±0.76 0.39±0.01 1461.86±34.29 5 6000(+1) 50(0) 11.25±0.12 318.1±4.09 62.52±0.55 0.39±0.01 1529.86±80.02 6 4000(0) 50(0) 11.00±0.2 289.23±6.89 58.09±0.87 0.42±0.02 1151.66±11.43 7 4000(0) 50(0) 11.3±0.15 301.7±4.9 65.81±0.8 0.40±0.01 1245.40±15.09 8 4000(0) 50(0) 11.14±0.11 290.14±5.03 60.00±0.85 0.41±0.02 1339.98±17.11 9 2000(–1) 50(0) 11.15±0.1 338.11±3.06 66.10±0.03 0.37±0.01 1481.66±34.29 10 4000(0) 50(0) 11.12±0.12 311.90±4.85 59.90±0.79 0.42±0.01 1212.59±16.66 11 2000(–1) 60(+1) 11.36±0.23 374.34±0.74 76.57±0.14 0.32±0.01 1679.66±68.59 12 4000(0) 60(+1) 11.28±0.11 368.02±10.8 63.82±1.4 0.39±0.01 1437.46±69.54 13 6000(+1) 60(+1) 11.36±0.25 436.93±1.6 77.91±0.47 0.30±0.01 1757.66±30.24 Note: a Analytical results are the means ± SD (n = 3).
VPEF: Voltage of Pulsed Electric Field NPEF: Number of Pulsed Electric Field Y: Yield
TPC: Total Phenolic Compound. FRAP: Ferric Reducing Antioxidant Power DPPHSC: scavenging activity of DPPH
IC50: The Concentration of extract required to scavenge 50% of 2, 2-diphenyl-1-picrylhydrazyl free radical.
2.5 Solvent extraction
Ten grams of dried powder was extracted with ethanol (1:10 w/v) by agitation in a dark place at ambient temperature for 48 h. The solvent was evaporated in vacuum at 40°C. Then, the concentrate was dried in a freeze drier (Operon-Korea, –55°C, 0.15 mmHg) for 48 h. The dried samples (SOx) were kept in the dark at –18°C
for further analysis.
2.6 Determination of extraction yield
The mass ratio of freeze-dried extract and dried powder before extraction was taken as the extraction yield. Indeed, the yield of each extract was calculated from the following equation:
Extraction yield % = 2
1
100
w
w (1)
where, w1 and w2 are the weight of dried powder and
weight of freeze-dried extract, respectively.
2.7 Total phenolic content (TPC)
Total phenolic content (TPC) was determined by Folin–Ciocalteau method (Singleton et al., 1999). Solution samples (100 mg extract in 10 mL of methanol) of 100 µL of the mixed with 6 mL of double distilled water and 500 µL of Folin-Ciocalteau reagent were added and allowed to remain at room temperature for 8.8 min, 1.5 mL of sodium carbonate (20% w/v) were then added. After standing for 30 min at room temperature, absorbance was measured at 765 nm. Results were expressed as mg gallic acid equivalents (GAE) per g sample. A mixture of water and reagents was used as a blank. A calibration curve of gallic acid (concentration range of 0.04-0.40 mg mL-1) in methanol was prepared so
2.8 HPLC Analysis of phenolic compounds
The HPLC analyses of phenolic components were performed according to Zheng and Wang (2001). The plant extract was dissolved in 4 mL of methanol, and 20 µL aliquots an then were passed through a 0.45-µm filter (Millipore, MSI, Westboro, MA) before injection into a C18 reverse phase column (Spherisorb ODS-2,
4.6 mm × 25 cm, particle size 5 µm) at room temperature. A Waters 600E system controller coupled with a photodiode array detector (Waters 990 series) was used. The mobile phase was acetonitrile (A) and acidified water containing 2.5% formic acid (B). The gradient was as follows: 0 min, 5% A and 95% B; 10 min, 15% A and 85% B; 30 min, 25% A and 75% B; 35 min, 30% A and 70% B; 50 min, 55% A and 45% B; 55 min, 90% A and 10% B; 57 min, 100% A and then held for 10 min before returning to the initial conditions. The flow rate was 1.0 mL min-1 and scanning was carried out between 200
and 400 nm. The data were collected by the chromatography data system (Water 990 3-D). The phenolic components were identified according to their retention time in comparison to the commercial standard. Quantification was carried out using the external standard method and the final concentrations were expressed in mg per g of extract.
2.9 Evaluation of antioxidant activity
2.9.1 DPPH free radical scavenging assay
The 2, 2-diphenyl-1-picrylhydrazyl (DPPH) free radical-scavenging activity of the extracts (pre-diluted to 90 mg L-1 concentration) was measured by DPPH assay
as described by Liu et al. (2009) with a slight modification. Aliquots of each extract (200 μL) were added to 3 mL of ethanolic DPPH solutions (0.1 mM). Discolorations were measured at 517 nm using a UV-1601 spectrophotometer (Shimadzu, Kyoto, Japan) after remaining for 30 min in the dark. The DPPH which was scavenged (DPPHsc) was estimated using the
Equation (2):
DPPHsc %= [(ADPPH – AS)/ADPPH]×100 (2) where, AS is the absorbance of the solution when the sample has been added at a particular level and ADPPH is the absorbance of the DPPH solution.
The sample concentration providing half maximal (50%) of radical-scavenging activity (IC50) is a measure
of the effectiveness of a substance in inhibiting a specific biological or biochemical function. This sample concentration corresponding to 50% of radical-scavenging activity was calculated by interpolation of the graph of radical-scavenging activity percentage against sample concentration.
2.9.2 Determination of ferric reducing/antioxidant power (FRAP assay)
FRAP assay was carried out by the method of Thaipong et al. (2006) with minor modifications. The principle of this procedure is based on the reduction of the ferrictripyridyl triazine complex to its ferrous, colored form in the presence of antioxidants. The stock solutions comprised 300 mM acetate buffer (pH 3.6), 10 mM TPTZ (2, 4, 6-tripyridyl-s-triazine) solution in 40 mM HCl, and 20 mM FeCl3·6H2O solution. The working solution was
made freshly by mixing 25 mL of acetate buffer, 2.5 mL of TPTZ solution and 2.5 mL of FeCl3·6H2O solution.
The mixed solution was incubated at 37°C for 30 min and was referred to as FRAP solution. Sample (150 μL) was mixed with 3 mL of FRAP solution and kept for 30 min in dark. Readings of the colored product (ferrous tripyridyltriazine complex) were then taken at 593 nm. Different concentrations of FeSO4·7H2O were used to
obtain the calibration curve.
2.10 Oxidative stability index (OSI)
2.10.1 Purification and preparation of soybean oil The soybean oil for eliminate natural antioxidant was purified with multilayer column (Aluminum oxide and silica gel) chromatography with modified method previously reported by Belhaj et al. (2010). Aluminum oxide and silica gel were used as absorbent which had been activated at 200°C for 3 h and 160°C for 3 h before use, respectively. 100 g of oil were added at the top of the multilayer chromatographic column. The bottom layer of chromatographic column (50×3 cm i.d.) was Aluminum oxide 60 (55 g, active, neutral) and the top layer was silica gel (85 g, activate, 60-200 mesh). Aluminum foil was used for wrapping chromatographic column and collection vessels, and the oil was drawn by suction without any solvent.
of BHT, and then exposed to the following stability test (Rancimat test).
2.10.2 Rancimat test
The oxidative stability index (OSI) was measured using a Metrohm Rancimat model 743 (Herisau, Switzerland) set for 3 g oil samples (in duplicate) at 120˚C, and at an airflow rate of 20 L h-1 (Méndez et al.,
1996).
2.11 Statistical analysis
Since the various responses were the result of various interactions of independent variables, the following second order polynomial regression equation was fitted to the experimental data of all responses, Equation (3).
1 2
0 1 2
1 1
k k
j k
j j ij j i j ij i j
j j
Y β β X β X β X X ε
(3) where, Y represents predicted response; β0 is a constant; βj, βjj and βij are linear, squared, and interaction coefficients, respectively; Xi and Xj are the independent variables and ε is noise or error (Azarpazhooh and Ramaswamy, 2012). The quality of the fitted polynomial models was expressed by regression coefficient (R2),
adjusted R2, adequate precision (AP), and coefficient of
variation (CV).
3 Results and discussion
3.1 Model fitting
Extraction variables were voltage of pulse electric field (VPEF; X1) and number of pulse electric field
(NPEF; X2). The design for combined effects comprised
of 13 experiments according to Table 1. Also, the levels of experimental variables used in this study are presented in Table 1. The extraction yields ranged from 10.51% to 11.36 %, TPC from 289.23 to 436.93 mg GA g-1 sample,
FRAP from 1151.66 to 1976.66 µmol Fe2+ g-1, DPPH SC
from 57.73% to 77.91 %, and IC50 from 0.3 to 0.44 mg mL-1.
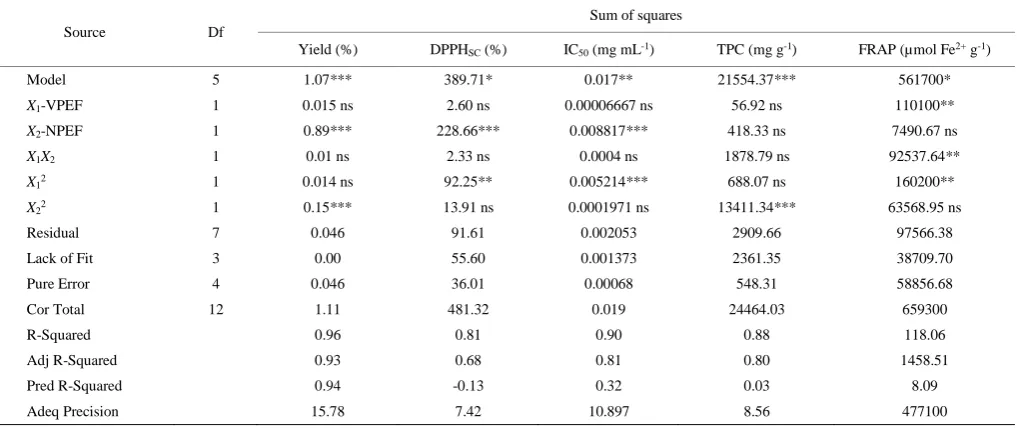
Table 2 presents the analysis of variance (ANOVA) for the response surface quadratic model. Non-significant variables were omitted, and the remaining coefficients were used in final predictive equations. The data showed a good fit with Equation (1), which was statistically acceptable at p<0.05, p<0.01 and p<0.001 and high R2
values (Myers et al., 2004). The lack of fit was not significant (p>0.05). The linear, quadratic were significant and used for the construction of three-dimensional response surface plots to assess the relationship between independent and dependent variables.
Table 2 Analysis of variance for predicted quadratic polynomial models for properties of extracted Nepeta polyphenols
Source Df
Sum of squares
Yield (%) DPPHSC (%) IC50 (mg mL-1) TPC (mg g-1) FRAP (µmol Fe2+ g-1)
Model 5 1.07*** 389.71* 0.017** 21554.37*** 561700*
X1-VPEF 1 0.015 ns 2.60 ns 0.00006667 ns 56.92 ns 110100**
X2-NPEF 1 0.89*** 228.66*** 0.008817*** 418.33 ns 7490.67 ns
X1X2 1 0.01 ns 2.33 ns 0.0004 ns 1878.79 ns 92537.64**
X12 1 0.014 ns 92.25** 0.005214*** 688.07 ns 160200**
X22 1 0.15*** 13.91 ns 0.0001971 ns 13411.34*** 63568.95 ns
Residual 7 0.046 91.61 0.002053 2909.66 97566.38
Lack of Fit 3 0.00 55.60 0.001373 2361.35 38709.70
Pure Error 4 0.046 36.01 0.00068 548.31 58856.68
Cor Total 12 1.11 481.32 0.019 24464.03 659300
R-Squared 0.96 0.81 0.90 0.88 118.06
Adj R-Squared 0.93 0.68 0.81 0.80 1458.51
Pred R-Squared 0.94 -0.13 0.32 0.03 8.09
Adeq Precision 15.78 7.42 10.897 8.56 477100
Note: ns, Not significant (p>0.05).
* Significant at (p<0.05); ** Significant at (p<0.01); ***Significant at (p<0.001).
3.2 Effects of extraction conditions on the extraction
yield
The extractions yield and the regression analysis of the data are presented in Tables 2 and 3, respectively. The
2
2 2
11.15 0.38 0.21
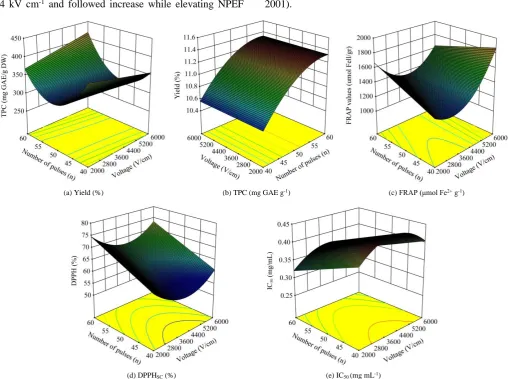
Y X X (4) The three-dimensional response surface plot (Figure 1a) illustrates the effects of experimental variables on the yield of extract. The maximum yield was achieved at a higher number and voltage pulse. They are synergic and therefore the combination of the two can be expected to enhance the extraction yield.
It has been well demonstrated that PEF increased the permeability of cell membrane (Wiktor et al., 2011). As the major effect to permeabilization, electroporation was still proposed to explain the extraction mechanisms of PEF treatment. Electroporation is the phenomenon in which a cell exposed to electric field pulses temporarily destabilizes the lipid bilayer and proteins of cell membranes. Therefore, the membrane molecules in the cell membrane separate according to their charge under their dipole nature. When the trans-membrane potential exceeds a critical value (typically 0.2-1.0 V for most cell membrane), pore occurs in weak areas of the membrane and causes a drastic increase of permeability. Pore formation is a dynamic process and can be reversible or irreversible depending on the treatment intensity. When the size and number of pores reach the critical value related to the total membrane surface, reversible breakdown turns into the irreversible breakdown, which causes the perpetual mechanical destruction of the cell membrane (Janositz and Knorr, 2010). Some research suggested that the expansion of the pores depend on the intensity of the electric field, pulse duration, and the ionic strength of the medium. Yi et al. (2006) found that when the PEF intensity was increased from 5 to 20 kV cm-1, the
extraction recovery of polysaccharide from Rana
temporaria chensinensis was increased rapidly from
17.11% to 26.87%. Similar results were reported in the extraction of chondroitin sulfate from fish bone (He et al., 2014). When the electric field intensity exceeded 15 kV cm-1, the growth rate of content of chondroitin
sulfate leveled off, and when the electric field intensity reached 25 kV cm-1, the content was maximized to
5.84 g L-1.
Pulse duration is one of the important indicators that measure PEF treatment, defined as the product of the pulse numbers and pulse width. An increase in either of pulse numbers and pulse width enhances cell
inactivation. As it can be shown in Figure 1a, the disruption of cell membranes increases gradually with increased number of pulses. The increase of disruption of cell membranes causes extraction of intracellular components from damaged cells. Parniakov et al. (2015) reported that increase PEF treatment number on papaya seeds caused by increasing extraction polyphenol yields.
3.3 Effects of extraction parameters on TPC
Total phenolic content data from PEFx based on the
Faced-central composite design is shown in Table 1. Multiple regression analysis was performed on the experimental data. Besides, the coefficients of the model were evaluated for significance. The values of the coefficients for TPC are presented in Table 2 were used for arriving at the final predictive model by neglecting the non-significant cross-terms as given below (Equation (5)):
2
1 2 1 2 1
309.05 3.085 8.35 21.67 75.70
TPC X X X X X (5)
To illustrate the influence of variables on TPC, three-dimensional surface plots (Figure 1b) were constructed according to Equation (5). TPC increased slowly with the increase of VPEF and nearly reached a peak at 6 kV cm-1, while it decreased by increasing NPEF
from 40 to 50 n to approximately 290.14 mg g-1 and then
the TPC increased with increasing number of pulses to 60 n.
It seems increasing number and voltage of pulses cause an increment in the number of permeated cells or in the permeabilization area of the cells by increasing the number or the size of pores, resulting in increasing of polyphenol extraction with release intracellular compounds into the solvent. Our results are in agreement with Álvarez et al. (2003) that reported an increment in the extraction efficiency by increasing the electric field strength applied.
3.4 Effect of process variables on antioxidant
compounds
The analytical results of antioxidant activities (FRAP, DPPHSC, and IC50) of PEFx are shown in Table 2. The
regression equation for the response of antioxidant activities (FRAP, DPPHSC, and IC50) are given below
FRAP=1320.69–135.43X1+33.95X2–152.10X1X2+
298.61X12 (6) DPPHSC=61.14–0.66X1+6.17X2+6.63X12 (7) IC50=0.41+3.33X1–0.038X2–0.047X12 (8)
The response surface plots are shown in Figure 1, c, d, e. Both VPEF and NPEF had a positive effect (Figure 1c) on FRAP which decreased with increasing VPEF up to 4 kV cm-1 and followed increase while elevating NPEF
resulted in increasing FRAP. FRAP assay is usually applied to study the antioxidant capacity of plant materials. The antioxidant capacity of PEFx is determined
by the ability of the antioxidants in these extracts to reduce ferric iron to ferrous. The reduction of ferric iron in FRAP reagent will cause the formation of a blue product (ferrous-TPTZ complex) (Jayaprakasha et al., 2001).
(a) Yield (%) (b) TPC (mg GAE g-1) (c) FRAP (μmol Fe2+ g-1)
(d) DPPHSC (%) (e) IC50 (mg mL-1)
Figure 1 Response surface plots of the yield, total phenolic contents and antioxidant activity of PEFx as affected by voltage (V cm-1) and
number of pulses (n).
When PEF are applied, the electroporation creates pores in the membrane so helps to extract the phenolic compounds. As it was finally observed, the antioxidant activity is related to the phenolic content and is strongly dependent on the concentration of extract. This strong dependence in many studies has shown that phenolic compounds are responsible for the antioxidant activity (Craft et al., 2012; Moure et al., 2001). Proven by many studies, plant polyphenols have good antioxidant activities. Thanks to the antioxidant properties of phenolic compounds, they play an important role in removing free radicals, heavy metals, and preventing the
formation of hydroperoxides in plants’ cell (Nogala-Kalucka et al., 2005). As it mentions the extraction of polyphenols was improved by increasing the PEF voltage and number of pulses.
The DPPH free radical is commonly used for evaluation of antioxidant activities of compounds. Figure 1d shows the interactive effect of VPEF and NPEF on DPPH activity. Again, the DPPH values decreased by increasing VPEF up to 4 kV cm-1, while it increased
antioxidants than vitamins E or C. Phenolics are compounds possessing one or more aromatic rings with one or more hydroxyl groups. The reduction activity of phenolic acids and their esters depends on the number of free hydroxyl groups in the molecule, which is manifested in high capacity to donate protons and thus stabilize DPPH radical (Rice-Evans et al., 1996). Therefore, the increment of the % DPPHSC of the orange
peel extract by increasing the electric field strength intensity and number of pulse is probably correlated with the higher content of polyphenols in the extract. Moreover, Luengo et al. (2013) reported that the extraction of polyphenols of orange peel improved by pulsed electric fields.
There was an inverse relationship between IC50 and
inhibition power. IC50 represents the concentration of the
extract required for inhibiting 50% of DPPH free radicals. Response plots of VPEF and NPEF on the IC50 are
illustrated in Figure 1e. Again, a decrease was observed in IC50 with the increase in VPEF until 4 kV cm-1, and
while further increase in VPEF increased.
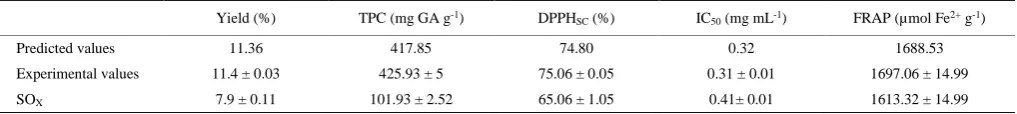
3.5 Optimization of PEF and verification
After the development of the models for various responses (yield, TPC, FRAP, DPPH, and IC50),
optimization of the process variables for achieving targeted outputs was considered. The input parameters were constrained, for example, VPEF and NPEF within the experimental range, and the target was to obtain maximum yield, TPC, FRAP and DPPH, and minimum IC50 from PEFx. The predicted values of responses have
been summarized in Table 3. The suitability of the model equation for predicting the optimum response values as targeted was tested using the selected optimal conditions. The predicted optimum value for VPEF and NPEF were: 6 kV cm-1 and 60 n, respectively. Under this processing
conditions, the experimental outputs of yield, TPC, FRAP, and DPPHSC were increased from 7.9% to 11.33%, from
101.93 to 413.36 mg GA g-1, from 1613.32 to 1688.53
µmol Fe2+ g-1 and from 65.06% to 74.80% respectively,
but also IC50 decreased from 0.41 to 0.32mg mL-1 the
SOx (Table 3).
Table 3 Predicted and experimental values of the responses at optimum conditions
Yield (%) TPC (mg GA g-1) DPPH
SC (%) IC50 (mg mL-1) FRAP (µmol Fe2+ g-1)
Predicted values 11.36 417.85 74.80 0.32 1688.53
Experimental values 11.4 ± 0.03 425.93 ± 5 75.06 ± 0.05 0.31 ± 0.01 1697.06 ± 14.99 SOX 7.9 ± 0.11 101.93 ± 2.52 65.06 ± 1.05 0.41± 0.01 1613.32 ± 14.99
Note: a Predicted using response surface quadratic model; bMean ± standard deviation of triplicate determinations from experiments
Barba et al. (2015) found also that the TPC recovery of PEF on blackberries after supplementary extraction was 6-fold and 4-fold higher after hot water and ethanol extraction, respectively. It has been observed that PEF treatments improve the extraction of polyphenols from grape skin by-products (Vorobiev and Lebovka, 2010) or increase concentration of polyphenols in juices obtained from apple mash and whole grapes (Grimi et al., 2009, 2011; Jaeger et al., 2012). Moreover, Corrales et al. (2008) reported that the anthocyanin extraction yields up to 17% by applying electrical field at 3 kV cm-1 and ethanol
concentration of 50% compared to the conventional extraction from the grape. Also, It has been observed that PEF treatment increased the antioxidant activity of grape byproduct extracts, Orange peel and apple juice extracted by PEF approximately two-fold higher than that to the control (press extraction) (Corrales et al., 2008; Grimi et
al., 2011; Luengo et al., 2013).
3.6 Identification and quantification of TPC
The amounts of phenolic components in extracts (SOx
and PEFOPT-X) determined by HPLC are shown in Table 4.
The identification of phenolic compounds helps to explain the strong antioxidant properties of the extract. The chlorogenic acid, caffeic acid, rutin, vanillin, para-coumaric acid, rosemarinic acid, kaempferol and apigenin determined in the ethanolic extract of Nepeta
binaludensis. The most abundant phenolic compounds in
both treated and untreated samples were rosemarinic acid (235.70 mg g-1) and apigenin (105.78 mg g-1) (Table 4).
et al., 1999).
Table 4 The individual phenolic composition (mg/g extract) of
the extracts
Phenolic composition RT (s) SOx PEFopt-x
Total phenolic compound - 117.80 449.25 Chlorogenic 17.48 7.51 16.30 Caffeic acid 19.68 0.77 22.24
Rutin 28.18 0.46 29.71
Vanillin 31.83 7.42 2.54
Para-coumaric acid 32.87 6.63 16.21 Rosemarinic acid 35.15 33.37 235.71 Kaempferol 36.08 20.68 20.78 Apigenin 41.13 40.97 105.78
Also, the result showed that in comparison with solvent extraction, PEF treatment increased the quantity of chlorogenic acid, caffeic acid, rutin, para-coumaric acid, rosemarinic acids, Kaempferol and apigenin in extract 117.04%, 788.31%, 6358.70%, 144.49%, 606.35%, 0.48% and 158.18%, respectively. However, the PEF decreased vanillin content from 7.42 to 2.54 mg g-1
(63.34% decreases) compared with solvent extraction.
3.8 Oxidative stability of PEFOPT-X
The effects of adding 0.5%-6% of PEFOPT-X and also
0.02% of BHT on the OSI (oxidative stability index) of the purified soybean oil (PSO) at 120˚C and air flow rate of 20 liters per hour are shown in Table 5. Rancimat test is one of the most widely-known accelerated methods for measuring the oxidative stability of oils and edible fats, which automatically measures the electrical conductivity of the changing of conductivity caused by volatile organic acids produced in oxidation (essentially formic acid). The moment when a rapid rise in conductivity occurs is the endpoint of Rancimat test and is known as OSI (Frankel, 2012).
Table 5 The oil stability index (OSI, h) of the PSO as affected
by BHT (200 mg kg-1), and different concentrations of PEF opt-x
(0.5%-6%) at 120°C
Sample OSI (h)
PSO 0.77 ± 0.11 e
PSO+BHT 2.70 ± 0.1 a
PSO+PEF opt-x
0.5 1.40 ± 0.03 d 2 1.59 ± 0.03 c
4 1.89 ± 0.04 b 6 2.65 ± 0.01 a Note: Means ± SD (standard deviation) with the same lowercase letters are not differet significantly at p<0.05.
The presence of high levels of unsaturated fatty acids (linoleic acids and linolenic acids), has made PSO very susceptible to oxidation (OSI=0.77 h). The PEFOPT-X
increased the OSI of the PSO from 0.77 to 2.65 h. The OSIs increased as the concentration of extract increased. The highest significant OSI was found in the PSO containing 6% PEFOPT-X that improved 3.44 times the
oxidative stability of PSO. The higher amounts of phenolic compounds especially rosemarinic acid caused to desirable antioxidative effects of PEFOPT-X (Table 5).
These antioxidant compounds with free radical scavenging effects prevent the formation of hydroperoxides and also delay the production of secondary oxidative compounds (Farhoosh et al., 2011). Pedro et al. (2018) showed that organic Goji berry extract had more effective antioxidative effects in soybean oil in comparison with BHT and BHA because of the presence of different antioxidant compounds.
4 Conclusions
The present study revealed that Nepata binaludensis
extract has a potential source of active ingredients such as polyphenols that are well-known for their antioxidative properties. Pulse electric field extraction is an effective technique for extraction of these compounds. Optimization voltage of pulsed electric field and number of pulse electric field number strongly influence the number of bioactive components in terms of quantity, quality and antioxidative activity.
Abbreviates
PEF Pulsed electric fields
FCD Face-centered experimental design RSM Response surface methodology
Y Yield (%)
TPC Total phenolic compounds
DPPHSC Radical scavenging activity of DPPH
FRAP Ferric reducing-antioxidant power IC50 50% of radical-scavenging activity
VPEF The voltage of pulsed electric field (V cm-1)
NPEF The number of pulsed electric field PEFopt-x The extract at optimal conditions of PEF
PEFx The pulsed electric field extract
References
Aadil, R. M., X. Zeng, D. Sun, M. Wang, Z. Liu, and Z. Zhang. 2015. Combined effects of sonication and pulsed electric field on selected quality parameters of grapefruit juice. LWT-Food Science and Technology, 62(1): 890–893.
Álvarez, I., R. Pagán, S. Condón, and J. Raso. 2003. The influence of process parameters for the inactivation of Listeria monocytogenes by pulsed electric fields. International Journal of Food Microbiology, 87(1-2): 87–95.
Azarpazhooh, E., and H. S. Ramaswamy. 2012. Modeling and optimization of microwave osmotic dehydration of apple cylinders under continuous-flow spray mode processing conditions. Food and Bioprocess Technology, 5(5): 1486–1501. Barba, F. J., C. M. Galanakis, M. J. Esteve, A. Frigola, and E.
Vorobiev. 2015. Potential use of pulsed electric technologies and ultrasounds to improve the recovery of high-added value compounds from blackberries. Journal of Food Engineering, 167: 38–44.
Bashi, D. S., S. A. Mortazavi, K. Rezaei, A. Rajaei, and M. M. Karimkhani. 2012. Optimization of ultrasound-assisted extraction of phenolic compounds from Yarrow (Achillea beibrestinii) by response surface methodology. Food Science and Biotechnology, 21(4): 1005–1011.
Belhaj, N., E. Arab-Tehrany, and M. Linder. 2010. Oxidative kinetics of salmon oil in bulk and in nanoemulsion stabilized by marine lecithin. Process Biochemistry, 45(2): 187–195. Boussetta, N., E. Soichi, J. L. Lanoisellé, and E. Vorobiev. 2014.
Valorization of oilseed residues: extraction of polyphenols from flaxseed hulls by pulsed electric fields. Industrial Crops and Products, 52: 347–353.
Corrales, M., S. Toepfl, P. Butz, D. Knorr, and B. Tauscher. 2008. Extraction of anthocyanins from grape by-products assisted by ultrasonics, high hydrostatic pressure or pulsed electric fields: a comparison. Innovative Food Science & Emerging Technologies, 9(1): 85–91.
Craft, B. D., A. L. Kerrihard, R. Amarowicz, and R. B. Pegg. 2012. Phenol-based antioxidants and the in vitro methods used for their assessment. Comprehensive Reviews in Food Science and Food Safety, 11(2): 148–173.
Farhoosh, R., M. H. Tavassoli-Kafrani, and A. Sharif. 2011. Antioxidant activity of the fractions separated from the unsaponifiable matter of bene hull oil. Food Chemistry, 126(2): 583–589.
Fincan, M., F. DeVito, and P. Dejmek. 2004. Pulsed electric field treatment for solid-liquid extraction of red beetroot pigment. Journal of Food Engineering, 64(3): 381–388.
Formisano, C., D. Rigano, and F. Senatore. 2011. Chemical constituents and biological activities of Nepeta species. Chemistry &Biodiversity, 8(10): 1783–1818.
Frankel, E.N. 2012. Lipid oxidation. 2nd ed. Sawston, Cambridge,
UK: Woodhead Publishing Ltd.
Grimi, N., N. I. Lebovka, E. Vorobiev, and J. Vaxelaire. 2009. Effect of a pulsed electric field treatment on expression behavior and juice quality of chardonnay grape. Food Biophysics, 4(3): 191–198.
Grimi, N., F. Mamouni, N. Lebovka, E. Vorobiev, and J. Vaxelaire. 2011. Impact of apple processing modes on extracted juice quality: pressing assisted by pulsed electric fields. Journal of Food Engineering, 103(1): 52–61.
He, G.,Y. Yin, X. Yan, and Q. Yu. 2014. Optimisation extraction of chondroitin sulfate from fish bone by high intensity pulsed electric fields. Food Chemistry, 164: 205–210.
Jaeger, H., M. Schulz, P. Lu, and D. Knorr. 2012. Adjustment of milling, mash electroporation and pressing for the development of a PEF assisted juice production in industrial scale. Innovative Food Science & Emerging Technologies, 14: 46–60.
Janicsák, G., I. Máthé, V. Miklóssy-Vári, and G. Blunden. 1999. Comparative studies of the rosmarinic and caffeic acid contents of Lamiaceae species. Biochemical Systematics and Ecology, 27(7): 733–738.
Janositz, A., and D. Knorr. 2010. Microscopic visualization of pulsed electric field induced changes on plant cellular level. Innovative Food Science & Emerging Technologies, 11(4): 592–597.
Jayaprakasha, G. K., R. P. Singh, and K. K. Sakariah. 2001. Antioxidant activity of grape seed (Vitis vinifera) extracts on peroxidation models in vitro. Food Chemistry, 73(3): 285–290.
Liu, L., Y. Sun, T. Laura, X. Liang, H. Ye, and X. Zeng. 2009. Determination of polyphenolic content and antioxidant activity of kudingcha made from Ilex kudingcha C.J. Tseng. Food Chemistry, 112(1): 35–41.
Luengo, E., I. Álvarez, and J. Raso. 2013. Improving the pressing extraction of polyphenols of orange peel by pulsed electric fields. Innovative Food Science & Emerging Technologies, 17: 79–84.
Mazumder, A., N. Neamati, S. Sunder, J. Schulz, H. Pertz, E. Eich, and Y. Pommier. 1997. Curcumin analogs with altered potencies against HIV-1 integrase as probes for biochemical mechanisms of drug action. Journal of Medicinal Chemistry, 40(19): 3057–3063.
Méndez, E., J. Sanhueza, H. Speisky, and A. Valenzuela. 1996. Validation of the Rancimat test for the assessment of the relative stability of fish oils. Journal of the American Oil Chemists’ Society, 73(8): 1033–1037.
Moure, A., J. M. Cruz, D. Franco, J. M. Domı́nguez, J. Sineiro, H. Domı́nguez, M. J. Núñez, and J. C. Parajó. 2001. Natural antioxidants from residual sources. Food Chemistry, 72(2): 145–171.
S. M. Kowalski. 2004. Response surface methodology: a retrospective and literature survey. Journal of Quality Technology, 36(1): 53–77.
Nadjafi, F., A. Koocheki, P. Rezvani Moghaddam, and B. Honermeier. 2012. First experiments on cultivation of Nepeta binaludensis Jamzad, an example of domestication of a highly endangered medicinal plant of Iran. Zeitschrift fur Arznei-und Gewurzpflanzen, 17: 64–71.
Nogala-Kalucka, M., J. Korczak, M. Dratwia, E. Lampart-Szczapa, A. Siger, and M. Buchowski. 2005. Changes in antioxidant activity and free radical scavenging potential of rosemary extract and tocopherols in isolated rapeseed oil triacylglycerols during accelerated tests. Food Chemistry, 93(2): 227–235.
Parniakov, O., E. Roselló-Soto, F. J. Barba, N. Grimi, N. Lebovka, and E. Vorobiev. 2015. New approaches for the effective valorization of papaya seeds: extraction of proteins, phenolic compounds, carbohydrates, and isothiocyanates assisted by pulsed electric energy. Food Research International, 77: 711–717.
Pedro, A. C., J. B. B. Maurer, S. F. Zawadzki-Baggio, S. Ávila, G. M. Maciel, and C. W. I. Haminiuk. 2018. Bioactive compounds of organic goji berry (Lycium barbarum L.) prevents oxidative deterioration of soybean oil. Industrial Crops and Products, 112: 90–97.
Rice-Evans, C. A., N. J. Miller, and G. Paganga. 1996.
Structure-antioxidant activity relationships of flavonoids and phenolic acids. Free Radical Biology and Medicine, 20(7): 933–956.
Singleton, V. L., R. Orthofer, and R. M. Lamuela-Raventós. 1999. Analysis of total phenols and other oxidation substrates and antioxidants by means of folin-ciocalteu reagent. Methods in Enzymology, 299: 152–178.
Thaipong, K., U. Boonprakob, K. Crosby, L. Cisneros-Zevallos, and D. H. Byrne. 2006. Comparison of ABTS, DPPH, FRAP, and ORAC assays for estimating antioxidant activity from guava fruit extracts. Journal of Food Composition and Analysis, 19(6-7): 669–675.
Vorobiev, E., and N. Lebovka. 2010. Enhanced extraction from solid foods and biosuspensions by pulsed electrical energy. Food Engineering Reviews, 2(2): 95–108.
Wiktor, A., D. Witrowa-Rajchert, and T. Chudoba. 2011. The influence of pulsed electric field on electrical conductivity and cell disintegration index of apple tissue. Problematic Journals of Agricultural Sciences, 569: 293–300.
Yi, Yongguang , Y.Z., Han, and Y. Han. 2006. Pulsed electric field extraction of polysaccharide from Rana temporaria chensinensis David. International Journal of Pharmaceutics, 312(1-2): 33–36.