The Application of Clinical Genetics 2017:10 1–8
The Application of Clinical Genetics
Dove
press
submit your manuscript | www.dovepress.com 1
R E V I E W
open access to scientific and medical research
Open Access Full Text Article
Genetics of tuberous sclerosis complex:
implications for clinical practice
Carolina Caban1,2
Nubaira Khan1,2
Daphne M Hasbani3
Peter B Crino1,2
1Department of Neurology, 2Shriners
Hospitals Pediatric Research Center, Temple University School of Medicine, 3Department of Neurology,
St. Christopher’s Hospital for Children, Drexel University College of Medicine, Philadelphia, PA, USA
Abstract: Tuberous sclerosis complex (TSC) is a multisystem disorder that results from hetero-zygous mutations in either TSC1 or TSC2. The primary organ systems that are affected include the brain, skin, lung, kidney, and heart, all with variable frequency, penetrance, and severity. Neurological features include epilepsy, autism, and intellectual disability. There are more than 1,500 known pathogenic variants for TSC1 and TSC2, including deletion, nonsense, and missense mutations, and all pathogenic mutations are inactivating, leading to loss of function effects on the encoded proteins TSC1 and TSC2. These proteins form a complex to constitutively inhibit mechanistic target of rapamycin (mTOR) signaling cascade, and as a consequence, mTOR signal-ing is constitutively active within all TSC-associated lesions. The mTOR inhibitors rapamycin (sirolimus) and everolimus have been shown to reduce the size of renal and brain lesions and improve pulmonary function in TSC, and these compounds may also decrease seizure frequency. The clinical application of mTOR inhibitors in TSC has provided one of the first examples of precision medicine in a neurodevelopmental disorder.
Keywords: TSC, epilepsy, genetics, mTOR, rapamycin
Introduction
Tuberous sclerosis complex (TSC) was first fully clinically detailed by Bourneville.1
TSC is a multisystem disorder associated with hamartomas or benign tumor growths in the brain, heart, lung, eye, or kidney.2 Over the past 25 years, knowledge about
genetic and cell signaling abnormalities in TSC has rapidly advanced, based on both animal model and clinical research, culminating in 2012 in the US Food and Drug Administration approval of a targeted therapy for renal and central nervous system involvement in TSC. Currently, TSC is estimated to affect one in 50,000 individuals worldwide and to occur in one in 6,000 to one in 10,000 live births across all ethnic demographies.3 This review summarizes some of the recent developments in TSC
genetics, diagnostic criteria, evaluation, and surveillance, as well as evaluates some of the salient cell biology of the TSC-mechanistic target of rapamycin (mTOR) pathway.
Clinical presentation
The symptoms and severity of TSC vary widely between individuals, and there is great phenotypic variability. Even across family pedigrees with identical genotypes, there can be great clinical variability (a phenomenon known as pleiotropy) where, for example, some family members develop severe neurological diseases (seizures and autism), whereas others have TSC features confined to the skin or kidneys with Correspondence: Peter B Crino
Department of Neurology, Temple University School of Medicine, Sixth Floor Medical Education and Research Building, 3500 North Broad Street, Philadelphia, PA 19140-4106, USA Tel +1 215 926 9370
Email [email protected]
Journal name: The Application of Clinical Genetics Article Designation: REVIEW
Year: 2017 Volume: 10
Running head verso: Caban et al Running head recto: Genetics of TSC DOI: http://dx.doi.org/10.2147/TACG.S90262
The Application of Clinical Genetics downloaded from https://www.dovepress.com/ by 118.70.13.36 on 27-Aug-2020
For personal use only.
This article was published in the following Dove Press journal: The Application of Clinical Genetics
21 December 2016
Dovepress
Caban et al
minimal neurological involvement.4 The most common organ
systems affected in TSC are the brain, skin, kidney, lung (in females), and heart. Hamartomas lead to impaired organ function, typically by compression of surrounding structures; in female TSC patients, lymphangioleiomyomatosis (LAM) results in cystic changes and parenchymal lung destruction. The major causes of neurological disability in TSC, including seizures, intellectual disabilities, and autism, are linked to structural developmental abnormalities in the brain known as cortical tubers, a type of focal cortical dysplasia.5 Tubers
form during fetal brain development and remain throughout life. Seizures remain the most common presenting sign for TSC (>80% of TSC patients have seizures) and can develop at any point in life from infancy (infantile spasms) to adult-hood. The incidence of autism and intellectual disability in TSC is ~40% and follows a bimodal distribution, with some individuals exhibiting severe intellectual disability, whereas others having only mild impairments.6 Indeed,
normal intellectual function occurs commonly in TSC. Benign glial brain tumors known as subependymal giant cell astrocytomas (SEGAs) may grow within the lateral, third, or fourth ventricles in ~10%–20% of TSC patients, lead-ing to hydrocephalus, increased intracranial pressure, and even death. Progressive LAM in some individuals leads to irrevocable loss of pulmonary function. LAM cells express estrogen and progesterone receptors, which might in part explain the predominance in females. Renal angiomyoli-pomas (AMLs) are hamartomas deriving from the renal parenchyma and may be multiple and bilateral. AMLs often spare renal function until they are bilateral and extensive in size and number. AMLs cause destruction of renal tissue by direct compression in the kidney. In addition, the vascular supply of AMLs may contain aneurysmal dilations, leading
to a risk of rupture and hemorrhage, especially when AMLs exceed 4 cm in size. Additionally, there is a link to polycystic kidney disease (PKD) in TSC, as the PKD1 locus is adjacent to the TSC2 gene on chromosome 16, and the appearance of PKD may be associated with hypertension and renal failure.7
Indeed, lung and kidney disease in TSC patients can lead to a shortened life span compared with the unaffected individuals, with renal disease being the most common cause of death. Interestingly, cardiac rhabdomyomas spontaneously resolve in >50% of TSC patients and cause no clinical difficulties. In babies with TSC, cardiac rhabdomyomas may cause conges-tive heart failure or dysrhythmias.
TSC is diagnosed by clinical criteria, which were recently updated in 2012.3 The current clinical criteria dictate two
types of TSC diagnosis – definite and possible – predicated on the detection of “major” and “minor” diagnostic criteria (Table 1). The major criteria include cortical tubers, subep-endymal nodules, SEGAs, retinal astrocytic hamartomas, pulmonary LAM, renal AMLs, cardiac rhabdomyomas, facial angiofibromas (previously called adenoma seba-ceum), ungual fibromas, hypomelanotic macules (previously referred to as ash leaf spots), and the Shagreen patch (col-lagenous fibroadenoma). Individuals with two major features or one major feature with two minor features or positive genetic testing meet criteria for “definite” TSC.3 Those with
either one major feature, one major and one minor feature, or two or more minor features meet criteria for “possible” TSC. Once a definite diagnosis is made, determination of a familial or sporadic occurrence is necessary for appropriate genetic counseling, and then, long-term clinical surveillance can be implemented. As an autosomal dominant disorder, inheritance is 50% in children of an affected proband. A new feature of the updated diagnostic criteria includes the use
Table 1 TSC diagnostic criteria3
Definite diagnosis: two major features or one major feature with two minor features or positive genetic testing Possible diagnosis: either one major feature, one major and one minor feature, or two or more minor features
Major features Minor features
Hypomelanotic macules (three or more, at least 5 mm diameter) Confetti skin lesions
Angiofibromas (two or more) or fibrous cephalic plaque Dental enamel pits (three or more)
Ungual fibromas (two or more) Intraoral fibromas (two or more)
Shagreen patch Retinal achromatic patch
Multiple renal hamartomas Multiple renal cysts
Cortical dysplasias (three or more, includes tubers and white matter radial migration lines) Nonrenal hamartomas SENs (two or more)
SEGA
Cardiac rhabdomyoma LAM
AMLs (two or more)
Note: Adapted from Pediatr Neurol 2013;49(4), Northrup H, Krueger DA, Tuberous sclerosis complex diagnostic update: recommendations of the 2012 international tuberous sclerosis complex consensus conference. Copyright (2012), with permission from Elsevier.3
Abbreviations: TSC, tuberous sclerosis complex; SENs, subependymal nodules; SEGA, subependymal giant cell astrocytoma; LAM, lymphangioleiomyomatosis; AMLs,
The Application of Clinical Genetics downloaded from https://www.dovepress.com/ by 118.70.13.36 on 27-Aug-2020
Dovepress Genetics of TSC
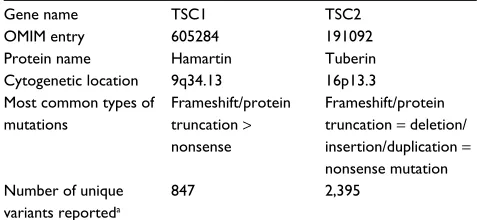
Table 2 Genes associated with TSC
Gene name TSC1 TSC2
OMIM entry 605284 191092
Protein name Hamartin Tuberin
Cytogenetic location 9q34.13 16p13.3 Most common types of
mutations
Frameshift/protein truncation > nonsense
Frameshift/protein truncation = deletion/ insertion/duplication = nonsense mutation Number of unique
variants reporteda
847 2,395
Note:aAs of April 2016 in the Leiden Open Variation Database.
Abbreviations: TSC, tuberous sclerosis complex; OMIM, Online Mendelian Inheritance in Man.
of genetic testing as a major diagnostic criterion such that a TSC diagnosis can be made solely with the identification of a clearly pathogenic genetic mutation, eg, nonsense variant, even in the absence of clinical signs and symptoms. However, genetic testing is not an absolute requirement for diagnosis, and most cases are diagnosed based on clinical findings alone in the absence of genetic testing. The reasoning behind this is that a mutation in TSC1 or TSC2 will not be identified (no mutation identified or the so-called NMI) in 10%–15% of patients with clinically defined TSC.8 Therefore,
nega-tive genetic testing does not exclude the diagnosis of TSC.
TSC genetics
TSC1 is located on chromosome 9q34, and TSC2 is located
on chromosome 16p13 (Table 2).9,10 TSC1 is a 23 exon gene
encoding an 8.6 kb transcript and a 30 kDa protein, known as TSC1 or hamartin. TSC2 encodes a 5.5 kb transcript and a 180 kDa protein, known as TSC2 or tuberin.11 TSC1 and
TSC2 are widely expressed across cell types and organ sys-tems, and there is high interspecies sequence conservation of these genes and proteins, from Drosophila to humans. TSC1 and TSC2 bind with a third protein, TBC1D7, to function as part of a heteromeric protein complex to regulate cell growth, cell size, cell cycle, and proliferation12,13 through the mTOR
pathway (see “Cell Biology and mTOR signaling in TSC”). Patients with TSC have mutations in either TSC1 or
TSC2, not both genes. In addition, mutations in the genes
that encode other regulatory components of the mTOR pathway, eg, TBC1D7 and Rheb, have not been associated with TSC, ie, there is no known TSC3 gene. Mutations in
TSC1 are often small insertions or deletions (indels) that
result in shortened (truncated) protein, whereas TSC2 muta-tions include large delemuta-tions, indels, nonsense, and missense mutations.14,15 Splicing errors account for a small number of
TSC1 and TSC2 mutations. Each mutation type is believed to
either functionally inactivate TSC1 or TSC2 or prevent TSC2 from forming the complex with TSC1, culminating in loss of tonic inhibition of the mTOR pathway. Indeed, deleterious variants are functionally validated in vitro based on their effect (enhancement) on mTOR signaling. A potential disease causing mutation may be identified in ~75%–90% of patients with TSC. All commercially available testing is performed on DNA extracted from peripheral blood lymphocytes, and more recently, analysis of buccal swab or saliva has been shown to be successful for genotyping. Germline mutations found in blood are also detected in tissue samples, eg, brain, lung, kidney, from the same individuals. In ~10%–15% of TSC individuals, a pathogenic TSC1 or TSC2 mutation is not detected (NMI) using conventional testing methods.
Estimates are that two out of three TSC cases are sporadic mutations not linked to a family pedigree and, thus, arise de novo at the initial time of zygote formation. In contrast, approximately one out of three TSC cases can be linked to a pedigree and are inherited in an autosomal dominant manner. Currently, a comprehensive listing of TSC1 and TSC2 variants with results of functional assays and predicted pathogenicity can be found at the Leiden Open Variation Database managed by the Leiden University Medical Center (www.lovd.nl/TSC1 and www.lovd.nl/TSC2). As of 2016, there are 847 unique
TSC1 variants and 2,395 unique TSC2 variants accounted
for in this database.16
Multiple studies have suggested that TSC2 mutations account for the majority (~51%–82%) of all patients in whom a pathogenic mutation was identified.15,17 Indeed, sporadic
TSC cases more often result from TSC2 than TSC1 muta-tions, with a range of 3:1–7:1. In contrast, inherited TSC cases result nearly equally from TSC1 and TSC2 mutations. In a small number of patients with TSC, large genomic muta-tions affecting TSC2 and the adjacent PKD1 gene can lead to a contiguous gene syndrome with clinical features of both TSC and PKD (autosomal dominant PKD). These patients are distinguished from those with typical TSC-associated renal disease by the severity and early onset of the cystic kidney changes.18
Different mutations in the TSC1 and TSC2 genes sug-gest that missense and small in-frame shift mutations may be pathogenic. For example, in one series, of the 152 amino acid substitutions and in-frame insertions/deletions, 86 (56%) were found to be pathogenic in vitro systems, and they increased the phosphorylation of p70 S6 kinase (p70S6K), reflecting activation of mTOR. Variations in TSC2 resulted in a wider variety of protein changes in the TSC1/2 complex.19
Fifty-five variations resulted in changes to the N-terminal,
The Application of Clinical Genetics downloaded from https://www.dovepress.com/ by 118.70.13.36 on 27-Aug-2020
Dovepress
Caban et al
whereas 54 variations caused changes to the C-terminal amino acid region. Changes in these amino acids decreased the binding stability of the TSC1/TSC2 complex as well as decreased production of TSC1. Changes in the N-terminal amino acids seemed to have a higher effect on the stability to the TSC1/2 complex than the changes in the C-terminal ones did. Overall, variations to either TSC1 or TSC2 that inhibited or had no effect on phosphor activation of the downstream p70S6 kinase were deemed not pathogenic.9
Genotype–phenotype relationships
Genetic testing is not required for the diagnosis of TSC. How-ever, in cases when the diagnosis is not clear by clinical criteria, genetic testing can help establish a diagnosis. Additionally, with the current criteria, the diagnosis of TSC can be made with genetic testing even in the absence of any signs or symptoms of the disease. In these cases, individuals for whom a diagnosis has been made with genetic testing can be referred for appro-priate clinical screening and management as some features of TSC will appear over the course of a lifetime, ie, renal AML or LAM, and thus, clinical evaluation can be updated.A number of series with long-term follow-up have provided insights into disease spectrum in TSC. Broadly speaking, patients with TSC2 mutations tend to have more severe disease than those with TSC1 mutations. For example, patients with TSC2 mutations exhibit an earlier onset of sei-zures and epilepsy, lower scores on tests of cognition, more skin findings, higher incidence of SEGAs, more numerous renal and hepatic AML, and greater tuber burden than those with TSC1 mutations.20,21 However, there may be significant
overlap in disease severity between TSC1 and TSC2 patients, and many individuals with TSC1 mutations have severe multiorgan system involvement. Patients within a pedigree, ie, same mutation, can have different disease manifestations, eg, pleiotropy or can exhibit variable penetrance of any one phenotypic feature. Therefore, making predictions about dis-ease severity in any individual patient based on their genotype alone is not yet feasible in clinical practice.
The “two-hit” hypothesis is an important concept in understanding lesion formation in TSC as well as the variable clinical expression in TSC. For example, all patients with either germline or sporadic TSC are heterozygotes (excep-tions are somatic mosaic and germline mosaic individuals), with each cell in the body containing a single heterozygous
TSC1 or TSC2 mutation. It is widely believed among
inves-tigators that lesion formation in TSC likely results from a somatic “second-hit” mutation in the other unaffected TSC1 or TSC2 allele, resulting in loss of heterozygosity (LOH) or
biallelic inactivation. When both alleles contain mutations, the result is biallelic inactivation, thus reducing the function of the TSC1–TSC2 complex. From a functional perspective, this means that the mTOR signaling cascade no longer has inhibitory modulation by the TSC1–TSC2 complex and can signal unchecked. Thus, AML in the kidney or SEGAs in the brain have been shown to exhibit LOH, while LOH has been difficult to confirm in cardiac rhabdomyomas and cortical tubers.22,23 Single-cell DNA sequencing or deep sequencing
of tuber DNA has identified somatic mutations in subpopula-tions of tubers, suggesting that other factors or modifier genes may be involved in the development of hamartomas in TSC.24
Conceptually, phenotypic severity in each patient with TSC is largely, though not exclusively, dictated by hamartoma burden, and in most cases, hamartomas in TSC result from a combination of germline and somatic second-hit mutations. More recently, epigenetic changes may contribute to lesion formation in TSC, including microRNAs that regulate TSC1 and TSC2 protein expression.25,26
Recommendations for genetic
testing in TSC
Genetic testing may be important for counseling and manage-ment of TSC patients. Although TSC is usually diagnosed on clinical criteria alone, results of genetic testing are now considered as major diagnostic criteria if a clearly deleterious mutation is identified and certain circumstances dictate that a clinician might want to pursue genetic testing. For example, genetic testing should be offered to any TSC individual of reproductive age for family planning purposes in the case where a couple with an affected child wishes to have addi-tional children. The risk of having a second child with TSC when the parents have no signs or symptoms of TSC is very low (~2%), though not zero, and near the risk within the gen-eral population. If parents wish to undergo genetic testing, the affected child should be tested first to detect the pathogenic mutation. Then, parental testing can be performed targeting that specific mutation. If the same mutation is identified in either parent, the risk of having a subsequent affected child is ~50%. If the parent is found to be negative, then the recur-rence risk is ~2%. For parents with positive testing who wish to have further children, preimplantation genetic testing is available. Because positive genetic testing is considered as an independent diagnostic criterion for TSC, the condition of asymptomatic carrier does not exist. Individuals with positive genetic testing should undergo thorough evaluation using the consensus guidelines for newly diagnosed individuals with TSC even in the absence of any obvious signs or symptoms.
The Application of Clinical Genetics downloaded from https://www.dovepress.com/ by 118.70.13.36 on 27-Aug-2020
Dovepress Genetics of TSC
Genetic testing might also be considered in individuals who have a possible diagnosis of TSC based on the diag-nostic criteria listed in Table 1 (either one major feature or two or more minor features). Detection of a mutation would impact future surveillance of the patient as well as prognosis. A unique situation arises when, for example, an individual has a single manifestation of TSC, eg, a single cortical tuber or AML, without any other signs of TSC. While these individuals may have a very mild phenotype, an alternative possibility is somatic mosaicism in which either TSC1 or TSC2 mutations are confined to single or a few organ systems. Commercial genetic testing in this case will likely not detect a mutation, although high coverage deep sequencing in a research laboratory might, which is highly relevant for family planning counseling for prospec-tive parents.
When evaluating a possible family pedigree, the clos-est three generations of living patient relatives should be screened for signs using the diagnostic criteria, being vigilant because some family members may have a very mild disease phenotype. Family members (parents, siblings, children) should have a thorough evaluation using the consensus guidelines for newly diagnosed individuals with TSC. Parents who wish to find out whether a seemingly unaffected sibling of the proband is affected should first undergo genetic test-ing themselves. If the parents of a child with a known TSC mutation do not have the same mutation, it is exceedingly unlikely that a clinically unaffected sibling has TSC.
Cell biology and mTOR signaling in
TSC
The mammalian target of rapamycin or mTOR is a serine/ threonine protein that belongs to the phosphatidylinositol 3-kinase-related kinase family.27 It acts through two distinct
protein complexes, mTORC1 and mTORC2. mTORC1 is characterized by the presence of regulatory-associated protein of mTOR (Raptor) and is effectively inhibited by rapamy-cin,28 a macrolide produced by Streptomyces hygroscopicus
bacteria. mTORC1 responds to amino acids leucine and arginine, stress, oxygen, energy, and growth factors to control and promote anabolic processes such as protein synthesis, lipid synthesis, and limiting of catabolic reactions such as autophagy.29 mTORC2 is characterized by the presence of
rapamycin-insensitive companion of mTOR (Rictor) and nonresponsiveness to rapamycin.30,31 This complex responds
to growth factors and regulates cell survival, metabolism, and cytoskeletal integrity.28 mTORC1 has five components in
its catalytic subunit: Raptor, mammalian lethal with SEC13
protein 8 (mLST8), proline-rich AKT substrate 40 kDa (PRAS40), and DEP domain-containing mTOR-interacting protein (Deptor). mTORC2 has six different components: Rictor, mammalian stress-activated protein kinase interacting protein 1 (mSIN1), protein observed with Rictor-1 (Protor-1), mLST8, and Deptor.30
The mTOR pathway provides rheostatic control of cell growth and autophagy and serves as a primary regulator of cell growth and proliferation in response to cellular nutrition, energy levels, and growth factor stimulation.32 The mTOR
signaling pathway responds to different environmental fac-tors and then integrates the diverse environmental cues into appropriate cellular responses.31,33,34 Homologous pathways
have been found in yeast, Drosophila, and other eukaryotes, suggesting that they are highly conserved among species.27,35
TSC1 and TSC2 are genes that encode proteins hamartin and
tuberin, the proteins that form the TSC1 and TSC2 complex (TSC1:TSC2). The complex functions as the main nega-tive regulator of mTOR through GTPase-activating protein (GAP), acting on Ras-homolog enriched in the brain (Rheb). If GTP is bound to Rheb, it becomes a potent activator of mTOR. Therefore, TSC1:TSC2 inhibits this activation by stimulating the GTPase activity of Rheb, which in turn cleaves a phosphate group from GTP, resulting in the inactive GDP-bound form.28,35 In the absence of TSC1:TSC2, the
levels of Rheb-GTP increase leading to the activation of the mTOR–Raptor pathway and constitutive deregulation of protein synthesis and cell growth.35
Deregulation of mTOR signaling pathway has been linked to a wide variety of neurodevelopmental disorders, including TSC as well as focal cortical dysplasia, hemimegalencephaly, and megalencephaly.31 The mTOR pathway has also been
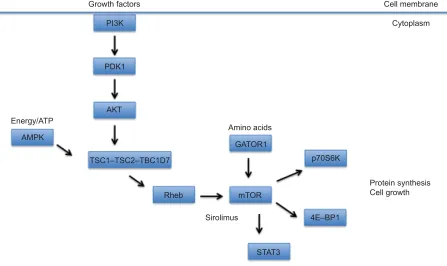
directly linked to a number of cancer subtypes. mTOR is regulated upstream by several protein kinases, such as PI3K, PDK1, PTEN, AKT, LKB1, and AMPK (Figure 1). LKB1 is an important inhibitor of the mTOR pathway since it responds to energy starvation and is necessary to protect the cell from death triggered by stress. LKB1 also enhances phosphoryla-tion of AMPK-dependent phosphorylaphosphoryla-tion sites on TSC2, suggesting its importance in activating TSC2:TSC1 under conditions of energy starvation.36 However, the
identifica-tion of TSC1 and TSC2 genes, as causal to TSC, has served as a pivot point for understanding mTOR regulation. TSC1 and TSC2 proteins serve as a meeting point for the complex intracellular signaling pathways that include insulin signal-ing (PI3K–AKT), mitogenic signalsignal-ing (MAPK), and energy sensing (AMPK). The main output pathway of TSC2:TSC1 is the mTOR protein complex, and under normal homeostatic
The Application of Clinical Genetics downloaded from https://www.dovepress.com/ by 118.70.13.36 on 27-Aug-2020
Dovepress
Caban et al
conditions, TSC2:TSC1 stops mTOR activation.34,36 The
activity of both TSC1 and TSC2 is mediated by phosphory-lation at multiple sites. TSC1 is phosphorylated by cyclin-dependent kinase 1 (CDK1)/cyclin B and by IKKβ.TSC2 is phosphorylated by AKT and AMPK as well as extracellular signaling-regulated kinase (Erk) and glycogen synthase kinase 3 (GSK3).
In eukaryotic cells under normal physiological conditions, TSC1 and TSC2, along with TBC1D7, form a heteromeric complex that serves as a crucial upstream negative regula-tor of mTOR activity. The complex acts as a guanosine triphosphatase activator (GAP) protein that prevents the phosphorylation of the G-protein Rheb. When Rheb is inac-tive, it is unable to activate mTORC1, thus inhibiting cell growth.4,31,37 Under growth-promoting conditions, growth
factors activate the intracellular PI3K–AKT–mTOR pathway and TSC2 is then phosphorylated by Akt, decreasing GAP activity and increasing mTOR activity. When hypoxic or low energy (ATP) conditions are signaled to the pathway, TSC2 is phosphorylated and GAP activity is increased.28,37 A
muta-tion in either TSC1 or TSC2 genes interferes with inhibitory control of mTOR, leading to hyperactivation, continued cell proliferation, and in some cases, oncogenic transformation.36
Activation of mTOR pathway leads to enhanced protein synthesis via the downstream effectors of mTOR, p70S6K, ribosomal protein S6, and translation initiation factors, such as 4E-binding proteins (4E-BP1). Indeed, deleterious puta-tively pathogenic variants are functionally validated in vitro based on their effect (enhancement) on mTOR signaling, eg, increased phosphorylation of p70S6K. Loss of TSC2:TSC1 can also lead to endoplasmic reticulum stress, which leads to protein unfolding. This stress response impacts mTOR-mediated negative feedback inhibition and raises the cell’s vulnerability to apoptosis.36 TBC1D7 is the stably associated
and ubiquitous third core subunit of the TSC2:TSC1 complex. A knockdown of the TBC1D7 subunit has been shown to decrease the association of TSC1 and TSC2, reducing GAP activity toward Rheb, along with increased mTOR activity, delayed induction of autophagy, and enhanced cell growth under low energy conditions.38
In many organ systems, TSC lesions, including renal AMLs, cortical tubers, and SEGAs, exhibit constitutively activated mTOR signaling evidenced by enhanced phos-phorylation of p70S6K, ribosomal S6, and STAT3 proteins. It is believed that TSC1 or TSC2 heterozygosity will not confer mTOR activation and that a somatic second-hit mutation in
Growth factors Cell membrane
Cytoplasm PI3K
PDK1
AKT
TSC1–TSC2–TBC1D7
GATOR1 Amino acids
mTOR
p70S6K
Protein synthesis Cell growth
4E–BP1
STAT3 Sirolimus
Energy/ATP
AMPK
Rheb
Figure 1 A schematic diagram depicting the TSC-mTOR signaling pathway.
Notes: mTOR is modulated by the TSC1–TSC2–TBC1D7 complex, integrating inputs from growth factors via PI3K, amino acids via the GATOR1 complex, and cellular
energy levels (ATP) via AMPK. Enhanced mTOR signaling in response to these cues or as a consequence of TSC1 or TSC2 mutations leads to increased protein synthesis
and cell growth.
Abbreviations: TSC, tuberous sclerosis complex; mTOR, mechanistic target of rapamycin; PI3K, PI3 kinase; p70S6K, p70 S6 kinase.
The Application of Clinical Genetics downloaded from https://www.dovepress.com/ by 118.70.13.36 on 27-Aug-2020
Dovepress Genetics of TSC
the unaffected allele is needed.4,39 Biallelic inactivation in
the form of LOH or small mutations has been identified in renal and brain lesions.
Death-associated protein kinase has also been identi-fied as a negative regulator of TSC2:TSC1. Its subsequent phosphorylation of TSC2 leads to the dissociation of the heterodimer. TSC2:TSC1 is also inhibited by the binding of forkhead transcription factor (FoxO1) to TSC2, ultimately activating the mTOR signaling cascade.2 Abnormal β-catenin
signaling has also been argued as a component of TSC patho-genesis.40 Another inhibitor of the mTOR signaling pathway
is p53, through the regulation of AMPK, PTEN, and TSC2.2
TSC2:TSC1 activation is mediated by AMPK and GSK3. Depletion of ATP results in enhanced phosphorylation of TSC2 and decreased phosphorylation of mTOR effectors, S6K and 4E-BP1. Energy depletion also induces LKB1-dependent activation of AMPK, which then activates the TSC2:TSC1 complex.
The mTOR complex phosphorylates S6K1 and 4E-BP1. Catalytic activity of S6K1 is regulated by multiple phos-phorylation events, and it is a kinase that activates ribo-somal subunit protein S6, which leads to the recruitment of ribosomes and protein translation.37 Additionally, S6K1
establishes a negative feedback loop on mTOR signaling by negative regulation of insulin receptor substrate-1. Taking a step back, it is evident that enhanced activation of the PI3K–AKT pathway leads to activation of the mTOR cas-cade, which results in enhanced phosphorylation of S6K1, and later, attenuation of PI3K–AKT signaling. 4E-BP1 has been implicated in the regulation of metabolism and adipogenesis41 and inhibits translation initiation factor
(eIF4E). When phosphorylated by mTOR, 4E-BP1 loses control of eIF4E.37
VEGF has also been suggested as a biomarker for abnor-mal TSC2:TSC1 function due to its high presence in TSC1 heterozygous animals with hepatic hemangiomas. Further-more, treatment of TSC1 heterozygous animals with repeated doses of rapamycin decreases serum VEGF levels and results in histological changes in the tumors. Phosphorylation of TSC1 by IKKβ results in dissociation of the TSC2:TSC1 complex, enhanced levels of GTP-bound Rheb, and subse-quent increase in the activation of mTOR, causing an increase in VEGF and accelerated angiogenesis.2
Clinical utility of mTOR inhibitors
in TSC
Inhibition of mTOR can be achieved pharmacologically by rapamycin (sirolimus), which causes dissociation of
mTORC1 from its binding partner Raptor, thus successfully inactivating it. Rapalogs (rapamycin derivatives) have also been proven to be valuable candidates to inhibit mTORC1 and are being used to treat different cancer malignancies in addition to TSC.4 Everolimus, a derivative of sirolimus, has
been successfully used to treat SEGA.42 Everolimus
treat-ment led to a reduction in SEGA volume within 3 months, an effect that persisted for 5 years. Additional studies suggest that everolimus may be useful for the treatment of epilepsy in TSC.
Summary and future directions
The mTOR cascade has now been linked to a host of neu-rological disorders at both ends of its signaling spectrum. In disorders characterized by exuberant mTOR signaling, inhibition of mTOR itself or targeting downstream substrates provides hopeful avenues for therapy. Indeed, advances over the next 5–10 years will hopefully identify specific substrates, eg, precision targets, for distinct neurological disorders. In contrast, enhancing mTOR signaling in disorders where mTOR activation is diminished will be a challenge since few if any pharmacological compounds can target mTOR for activation. For both types of neurological disorders, establishment of appropriate timing and duration of therapy will be of paramount importance.Disclosure
The authors report no conflicts of interest in this work.
References
1. Bourneville DM. Sclerose tubereuse des circonvolutions cerebrales.
Arch Neurol. 1880;1:81–91. French.
2. Orlova KA, Crino PB. The tuberous sclerosis complex. Ann N Y Acad
Sci. 2010;1184:87–105.
3. Northrup H, Krueger DA. Tuberous sclerosis complex diagnostic update: recommendations of the 2012 international tuberous sclerosis complex consensus conference. Pediatr Neurol. 2013;49(4):243–254. 4. Kohrman MH. Emerging treatments in the management of tuberous
sclerosis complex. Pediatr Neurol. 2012;46(5):267–275.
5. Jansen FE, Vincken KL, Algra A, et al. Cognitive impairment in tuberous sclerosis complex is a multifactorial condition. Neurology. 2008;70(12):916–923.
6. Curatolo P. Mechanistic target of rapamycin (mTOR) in tuberous sclerosis complex-associated epilepsy. Pediatr Neurol. 2015;52(3): 281–289.
7. Henske EP, Neumann HP, Scheithauer BW, Herbst EW, Short MP, Kwiatkowski DJ. Loss of heterozygosity in the tuberous sclerosis (TSC2) region of chromosome band 16p13 occurs in sporadic as well as TSC-associated renal angiomyolipomas. Genes Chromosomes Cancer. 1995;13(4):295–298.
8. Tsai V, Crino P. Tuberous sclerosis complex: genetic basis and manage-ment strategies. Adv Genomics Genet. 2012;2012:19–31.
9. European Chromosome 16 TSC Consortium. Identification and char-acterization of the tuberous sclerosis gene on chromosome 16. Cell. 1993;75:1305–1315.
The Application of Clinical Genetics downloaded from https://www.dovepress.com/ by 118.70.13.36 on 27-Aug-2020
Dovepress
The Application of Clinical Genetics
Publish your work in this journal
Submit your manuscript here: https://www.dovepress.com/the-application-of-clinical-genetics-journal
The Application of Clinical Genetics is an international, peer-reviewed open access journal that welcomes laboratory and clinical findings in the field of human genetics. Specific topics include: Population genetics; Functional genetics; Natural history of genetic disease; Management of genetic disease; Mechanisms of genetic disease; Counselling and ethical
issues; Animal models; Pharmacogenetics; Prenatal diagnosis; Dysmor-phology. The manuscript management system is completely online and includes a very quick and fair peer-review system, which is all easy to use. Visit http://www.dovepress.com/testimonials.php to read real quotes from published authors.
Dove
press
Caban et al
10. van Slegtenhorst M, de Hoogt R, Hermans C, et al. Identification of the tuberous sclerosis gene TSC1 on chromosome 9q34. Science. 1997;277(5327):805–808.
11. Xu L, Sterner C, Maheshwar MM, et al. Alternative splicing of the tuber-ous sclerosis 2 (TSC2) gene in human and mtuber-ouse tissues. Genomics. 1995;27(3):475–480.
12. Santiago Lima AJ, Hoogeveen-Westerveld M, Nakashima A, et al. Identification of regions critical for the integrity of the TSC1-TSC2-TBC1D7 complex. PLoS One. 2014;9(4):e93940.
13. Huang J, Manning BD. The TSC1-TSC2 complex: a molecular switch-board controlling cell growth. Biochem J. 2008;412(2):179–190. 14. Rendtorff ND, Bjerregaard B, Frödin M, et al. Analysis of 65 tuberous
sclerosis complex (TSC) patients by TSC2 DGGE, TSC1/TSC2 MLPA, and TSC1 long-range PCR sequencing, and report of 28 novel mutations.
Hum Mutat. 2005;26(4):374.
15. Dabora SL, Jozwiak S, Franz DN, et al. Mutational analysis in a cohort of 224 tuberous sclerosis patients indicates increased severity of TSC2, compared with TSC1, disease in multiple organs. Am J Hum Genet. 2001;68(1):64–80.
16. Povey S, Ekong R [webpage on the Internet]. Tuberous Sclerosis Data-base. Leiden Open Variation Database; 2016. Available from: http:// chromium.lovd.nl/LOVD2/TSC. Accessed May 14, 2016.
17. Sancak O, Nellist M, Goedbloed M, et al. Mutational analysis of the TSC1 and TSC2 genes in a diagnostic setting: genotype – phenotype correlations and comparison of diagnostic DNA techniques in Tuberous Sclerosis Complex. Eur J Hum Genet. 2005;13(6):731–741. 18. Boehm D, Bacher J, Neumann HP. Gross genomic rearrangement
involv-ing the TSC2-PKD1 contiguous deletion syndrome: characterization of the deletion event by quantitative polymerase chain reaction deletion assay. Am J Kidney Dis. 2007;49(1):e11–e21.
19. Hoogeveen Westerveld M, Wentink M, van den Heuvel D, et al. Functional assessment of variants in the TSC1 and TSC2 genes iden-tified in individuals with tuberous sclerosis complex. Hum Mutat. 2011;32(4):424–435.
20. Kothare SV, Singh K, Chalifoux JR, et al. Severity of manifestations in tuberous sclerosis complex in relation to genotype. Epilepsia. 2014;55(7): 1025–1029.
21. Rakowski SK, Winterkorn EB, Paul E, Steele DJ, Halpern EF, Thiele EA. Renal manifestations of tuberous sclerosis complex: incidence, prog-nosis, and predictive factors. Kidney Int. 2006;70(10):1777–1782. 22. Crino P, Aronica E, Baltuch G, Nathanson KL. Biallelic TSC gene
inactiva-tion in tuberous sclerosis complex. Neurology. 2010;74(21):1716–1723. 23. Niida Y, Stemmer-Rachamimov AO, Logrip M, et al. Survey of somatic mutations in tuberous sclerosis complex (TSC) hamartomas suggests different genetic mechanisms for pathogenesis of TSC lesions. Am J
Hum Genet. 2001;69(3):493–503.
24. Qin W, Chan JA, Vinters HV, et al. Analysis of TSC cortical tubers by deep sequencing of TSC1, TSC2 and KRAS demonstrates that small second-hit mutations in these genes are rare events. Brain Pathol. 2010;20(6):1096–1105.
25. Patursky-Polischuk I, Kasir J, Miloslavski R, et al. Reassessment of the role of TSC, mTORC1 and microRNAs in amino acids-meditated translational control of TOP mRNAs. PLoS One. 2014;9(10):e109410. 26. Dombkowski AA, Batista CE, Cukovic D, et al. Cortical tubers: win-dows into dysregulation of epilepsy risk and synaptic signaling genes by microRNAs. Cereb Cortex. 2016;26(3):1059–1071.
27. Yang Q, Guan KL. Expanding mTOR signaling. Cell Res. 2007;17(8): 666–681.
28. Menon S, Manning BD. Common corruption of the mTOR signaling network in human tumors. Oncogene. 2008;27(S2):S43–S51. 29. Laplante M, Sabatini DM. MTOR signaling in growth control and
disease. Cell. 2012;149(2):274–293.
30. Laplante M, Sabatini DM. mTOR signaling at a glance. J Cell Sci. 2009;122(20):3589–3594.
31. Crino PB. mTOR: a pathogenic signaling pathway in developmental brain malformations. Trends Mol Med. 2011;17(12):734–742. 32. Inoki K, Corradetti MN, Guan KL. Dysregulation of the TSC-mTOR
pathway in human disease. Nat Genet. 2005;37(1):19–24.
33. Xu K, Liu P, Wei W. MTOR signaling in tumorigenesis. Biochim Biophys
Acta. 2014;1846(2):638–654.
34. Huang K, Fingar DC. Growing knowledge of the mTOR signaling network. Semin Cell Dev Biol. 2014;36:79–90.
35. Napolioni V, Curatolo P. Genetics and molecular biology of tuberous sclerosis complex. Curr Genomics. 2008;9(7):475–487.
36. Kingswood JC, de Vries PJ. Tuberous sclerosis complex. Paediatr Child
Health. 2015;25(10):467–473.
37. Curatolo P, Bombardieri R, Jozwiak S. Tuberous sclerosis. Lancet. 2008;372(9639):657–668.
38. Dibble CC, Elis W, Menon S, et al. TBC1D7 is a third subunit of the TSC1-TSC2 complex upstream of mTORC1. Mol Cell. 2012;47(4): 535–546.
39. Crino PB, Nathanson KL, Henske EP. The tuberous sclerosis complex.
N Engl J Med. 2006;355(13):1345–1356.
40. Mak BC, Kenerson HL, Aicher LD, Barnes EA, Yeung RS. Aberrant
β-catenin signaling in tuberous sclerosis. Am J Pathol. 2005;167(1): 107–116.
41. Tsai S, Sitzmann JM, Dastidar SG, et al. Muscle-specific 4E-BP1 signaling activation improves metabolic parameters during aging and obesity. J Clin Invest. 2015;125(8):2952–2964.
42. Krueger DA, Care MM, Holland K, et al. Everolimus for subepen-dymal giant-cell astrocytomas in tuberous sclerosis. N Engl J Med. 2010;363(19):1801–1811.
The Application of Clinical Genetics downloaded from https://www.dovepress.com/ by 118.70.13.36 on 27-Aug-2020