A Computerized Constructionist Approach
To Simulation And Modeling Pedagogy
Benjamin K. S. Khoo, New York Institute of Technology, USA
ABSTRACT
A major limitation in traditional class lectures on simulation and modeling, that uses assignments, handouts, transparencies, and textbooks, is that students often are unable to appreciate the "experience" of simulating a real problem. This limitation can be overcome by using an active real case study approach to allow students to simulate a real-time queuing problem through interactive visual simulation software (EXTEND®). Actual raw data had been collected prior to the case assignment and students are taught to develop the simulation model, based on the actual raw data. The intent is that by "doing" or "constructing" the simulation model from actual data, the students will understand better and remember.
Keywords: Simulation; Modeling; Pedagogy; Constructionist; EXTEND®
INTRODUCTION
roblems can be structured, semi-structured, or unstructured. In structured problems, the variables and model relationships are precisely defined and amenable to solution with analytical solution procedures. Unstructured processes are those, which are "fuzzy" and complex relationships, for which there are no standard solutions. Semi-structured processes are those that have some structured elements and some unstructured elements (Simon, 1977). Using simulation can solve semi-structured problems.
Simulating is essentially experimenting with a model and observing the consequences. As such, the method involves trial and error (Goldsman et al., 2010). Pilots, for example, can be trained on the ground by allowing them to experiment with a working model that "simulates" an aircraft's flight. In operational research, the models involved are usually mathematical models for complex problems.
A major limitation in traditional class lectures on simulation and modeling, that uses assignments, handouts, transparencies, and textbooks, is that students often are unable to appreciate the "experience" of dealing with a real problem. This paper describes an effort to enhance student learning of simulation modeling by using actual data from a real queuing problem at a metropolitan bus depot by allowing them to have a hands-on experience through constructing the simulation model on a computer for the queuing problem through an interactive visual simulation software (EXTEND®). The objective is to motivate learning through activity.
LITERATURE REVIEW
been shown that learning is more effective when it is activity-based rather than passively received (Brown, 1989). The active "constructing" or "doing" tasks leads to discovery. The constructionist approach uses constructive tasks to impart knowledge. Its goal is to develop creativity and motivate learning through activity.
Constructionism asserts that knowledge is not simply transmitted from the teacher to students, but is actively constructed in the mind of the learner through various hands-on activities. In addition, it suggests that learners make their ideas by constructing their own knowledge structures. It has been shown that learning is more effective when it is activity-based rather than passively received (Brown et al., 1989). Active learning provided the approach for this project while the interactive simulation software is an excellent vehicle to deliver the system. This project is intended to get the students involved in an interactive simulation exercise yet come away with an experience or knowledge of what simulation and modeling requires.
MOTIVATION
Students often are unable to grasp the full implications of the techniques found in textbooks in learning simulation and modeling. The knowledge found in the written text and in mathematical formulations does not fully illustrate the process of simulation to its readers. Spreadsheet models do not provide the interactive, visual nor experiential knowledge necessary. The theoretical models and formulas do not fully illustrate the process of simulation. In directly applying the simulation formulas, students do not have the “experience” of constructing the simulation model itself. A project to overcome this limitation was initiated which resulted in the development and use of an interactive simulation model to teach simulation and modeling.
It is also important that students be exposed to real cases in the world. Data from a real case had been collected earlier. This project requires that the students process then analyze the raw data from a real-time queuing case study and develop a simulation model with its various characteristics using simulation software. At the end of the simulation, students are to provide a quantitative evaluation of the model compared with the results from theory.
EXTEND® is a tool used for such purposes. The latest version is called ExtendSim® (http://www.extendsim.com). This tool is a professional interactive simulation tool. Its main role, to the students, is to serve as a building or development kit to construct the simulation model for the queuing problem. In this way, it serves as a teaching tool for the students.
There are two motivations for this project. The first motivation pertains to the simulation software: To allow the student to interactively experience an industrial strength simulation tool and learn what it is like to construct a simulation model. The second motivation pertains to the model: To help the students to discover what basic criteria or features are required for a reasonable or “satisficing” solution (Simon, 1977) and/or the effects of bad queuing models.
APPROACH
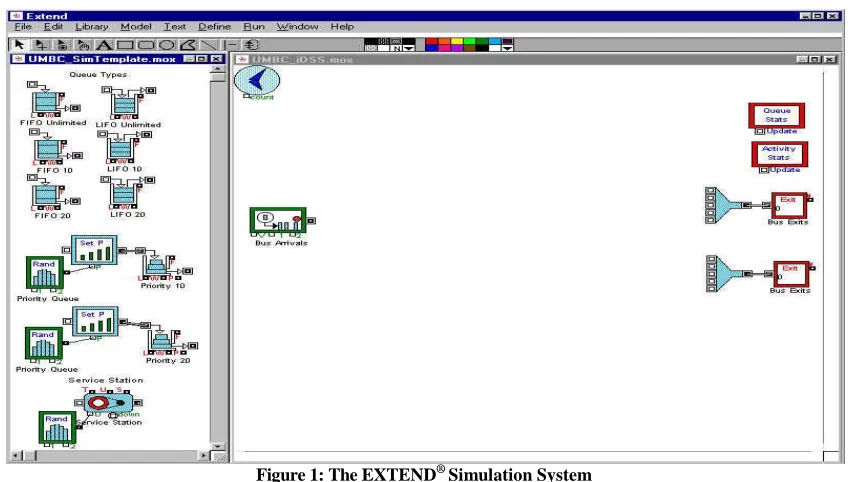
The procedure for this project is to train students in simulation and queuing theory and in the use of the simulation software until they were all familiar with the features available. The interactive simulation software allows the students to define the various parameters in the simulation and to have complete control of the controllable parameters to derive the “best” possible outcome among those tested. Simulation software usually has many features that are used in the various types of simulation modeling. In this project, the frills and thrills have been reduced to a minimum while the basics features of a queuing model simulation are emphasized. All the required parameters are assembled on a palette as icons where the students can copy and paste on the sketchpad to construct the model. See Figure 1.
Figure 1: The EXTEND® Simulation System
A few criteria are necessary for the successful implementation of this project for teaching simulation and modeling. One major criterion is that the students should be able to interact with a complete simulation system, so as to experience the importance of simulation modeling. The simulation system should be complete so that it mimics a real-life system that has options for generating arrivals, different types of queues, service stations, exit collector, and also queue and activity statistics. The EXTEND® simulation software met all of these requirements.
In addition, EXTEND® is the ideal vehicle to deliver the interactive simulation system. All the students have access to EXTEND® in the PC labs on campus through their individual user accounts at the university. This project harnessed the strengths of EXTEND® to provide students with a hands-on learning experience in building the simulation model. A picture of EXTEND® is illustrated in Figure 1.
The students are required to formulate the arrival and service distributions based on the data gathered for the number of service stations at the depot (See Appendix 1). They were then required to simulate queuing models with various possible configurations to determine the “best” queuing model. The criteria for the "best" model are based on the minimum waiting time with a minimum number of service stations. The intent of allowing the students to construct and experiment with the various queuing models is for the students to experience a 'real' dynamic simulation with its associated outcomes and learn through 'doing and experiencing' (Papert, 1980b).
In this simulation environment, users will be able to interact with the various features or components of a simulation model via a direct manipulation paradigm. Through constructing the model by building a component at a time, the student can gain an experiential knowledge of what basic components are required for a simulation model to derive the “best” solution.
CASE SCENARIO
1. It can cost money for an item to be idle in a queue. The smaller the service facility, the longer the queues and the higher the costs.
2. On the other hand, it costs money to increase the service facility. The larger the service facility, the quicker it will disperse queues and, therefore, the more often it will stand idle.
This case study is a real-life scenario based on a study to improve the queuing situation at a bus terminal or depot in a major city. The bus transportation company has a total fleet of 2,633 buses and 61 terminals or depots, serving an area about 26 miles by 13 miles with an operation of 228 bus services. In an effort to improve productivity, this study was initiated to improve the servicing system, where the queue at peak servicing hours can be as long as 24 buses. The servicing involves refueling and topping up the engine oil. Buses are scheduled to return to the depot at the end of the day between 9:00 PM and 1:15 AM for servicing. A bus coming in through the entrance will go to an empty station or join in the queue in a first-come-first-serve manner. There is in principle no constraint in the queue length as the buses can queue outside the entrance along the road. The maximum number of stations in use is five and is manned by a maximum of five operators at the peak time. This is a semi-structured problem, as most of the parameters in this case cannot be known with certainty. This is a stochastic problem, therefore, the technology of management that is ideally suited for this case is management science and the methodology that can be used is simulation.
A model of a single queue, multi-server queuing system is to be built and simulated. Clearly, one reason for studying queues is to enable the optimum service facility size to be selected so that the overall cost of a service is minimized. All queuing situations reveal four basic features as follows:
a. The Arrival Pattern
Queue components can arrive at the queue in a variety of patterns. They can arrive in large groups, regularly or irregularly, or steadily, or at random. A crucial figure in queuing theory is the average arrival rate (l). This is the average number of arrival per unit time. For this project, the calculated rate = 1.28 bus/min (see Appendix 1).
b. The Service Pattern
Servicing similarly takes a variety of patterns and can be regular, or virtually instant but with periods of no service at all, or again random. Another crucial figure is the average service rate (m). This is the average number of queue components that can be serviced per unit time. Note that arrivals involve discrete distributions but service usually involves continuous distributions. For this project, the calculated rate = 0.61 bus/min (see Appendix 1).
c. The Number of Service Channels
Arrival and service patterns are often beyond our immediate control, but one factor we usually have full control is the number of service channels. Indeed, the object of most queue analyses is to determine the optimum number of service channels.
d. The Queue Discipline
Although most queues are based on a first-come-first-serve (similar to FIFO) system, this is not always so. There are some cases where certain queue components have priorities; other cases where a LIFO (last-in-first-out) system operates and cases where component are served at random.
Having defined the operation of the particular system being studied, a system requirement definition needs to be done - including the relevant variables and their frequency distributions, then some sort of model will need to be constructed based on the actual data from the system. There are a few basic assumptions that were made as one start developing this model:
1. the queue discipline is FIFO
3. there is an unlimited waiting area 4. this is a next-event type model 5. that all service stations are identical
6. that the service time distribution and arrival time distribution is constant
The objective of this case study is to develop a simulation model of a single queue, multi-server queuing system of a bus depot that is able to reproduce the effects or conditions of the existing system, as well as be able to model the effect of changes in system components so as to improve the efficiency of the system. As space is a critical factor at the bus terminal, we want to limit the maximum queue length to about 10 buses.
Five timekeepers were used to collect actual data for the arrival time, service time, and the derived inter-arrival time.
IMPLEMENTATION
The interactive simulation system is based on the queuing problem at the metropolitan bus depot. It has a windows-like interface that uses icons as components of the queuing model. The template on the left of the window contains the possible components that can be used in the model. The components of a queuing model include: an arrival generator, various types of queue, the service station, exit collector, and also queue and activity statistics.
Values of uncontrollable variables are determined by the data collected. The uncontrollable variables are the arrival and service distribution, the queue discipline, and the random number generator. The controllable (decision) variables are the number of servers, the simulation duration and the number of queues. The controllable variables will be used for output sensitivity analysis to choose the optimal solution among the alternatives.
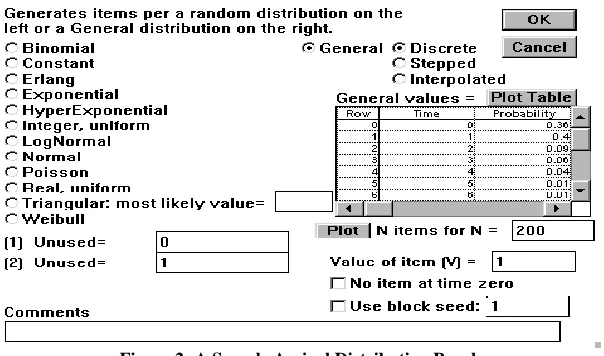
From the raw data collected, students have to derive a probability distribution for the arrival and service pattern. The arrival probability distribution is then used to feed the arrival generator, which will simulate the arrival of buses at the depot. See a sample on Figure 2. The service distribution will be used to feed the service station, which will generate a service time for each bus serviced. See Figure 3.
Figure 3: Service Distribution Panel
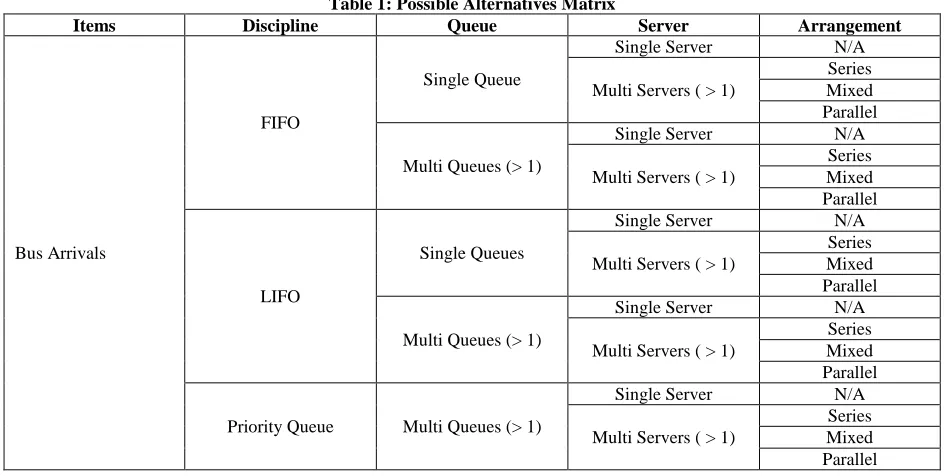
There are various types of queue - First-In-First-Out (FIFO), Last-In-First-Out (LIFO), and Priority queues each can be of various lengths. For this case study, the queue lengths have been limited to 10, 20, and unlimited. In modeling the queuing problem, students have the option of having 1 or more queues of the same type or of different types, having 1 or more service station (we are assuming that there is only 1 type as there are no reason to assume otherwise), having parallel, series or mixed configuration of the service stations and having a simulation duration of about 4800 ticks. There are an infinite number of possible alternatives. The alternatives can be categorized based on the type of items, queuing discipline, number of queue/s, number of server/s, and the arrangement of the servers. The possible alternatives for this queuing problem are illustrated in the Table 1.
Table 1: Possible Alternatives Matrix
Items Discipline Queue Server Arrangement
Bus Arrivals
FIFO
Single Queue
Single Server N/A
Multi Servers ( > 1)
Series Mixed Parallel
Multi Queues (> 1)
Single Server N/A
Multi Servers ( > 1)
Series Mixed Parallel
LIFO
Single Queues
Single Server N/A
Multi Servers ( > 1)
Series Mixed Parallel
Multi Queues (> 1)
Single Server N/A
Multi Servers ( > 1)
Series Mixed Parallel
Priority Queue Multi Queues (> 1)
Single Server N/A
Multi Servers ( > 1)
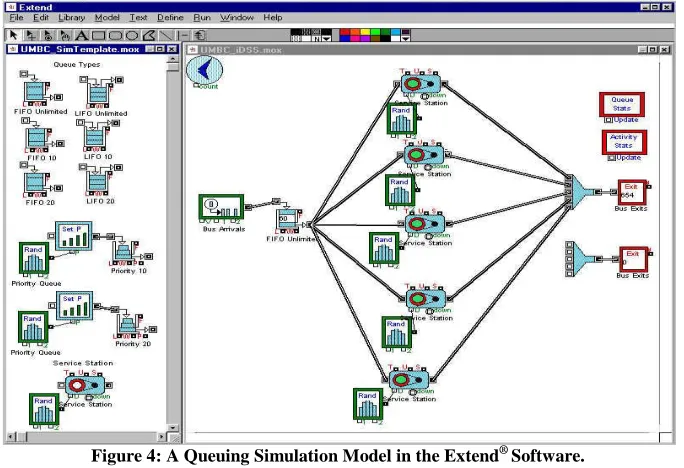
Figure 4: A Queuing Simulation Model in the Extend® Software.
An example of a simulation model in Extend® is illustrated in Figure 4. This model is formed by the student dragging icons from the left palette and relating the dragged icons in the right palette. The value of an alternative is judged in terms of its ability to attain the goal/s of the problem.
RESULTS
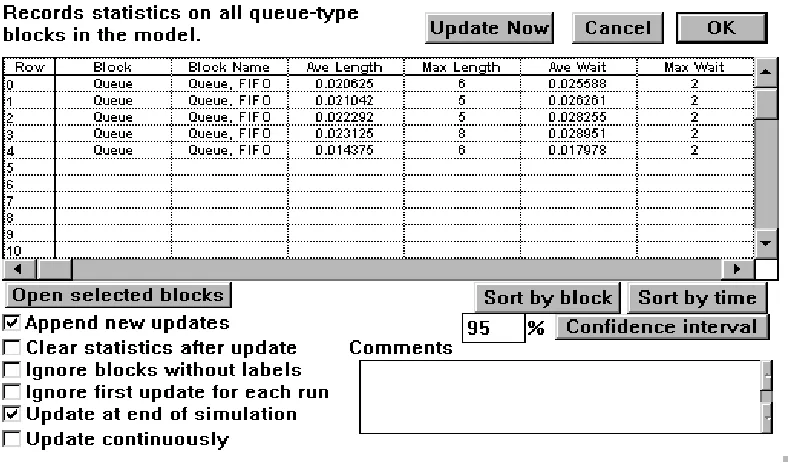
The model is a single queue with multiple servers (in the case here, there are five servers). The arrival distribution (see earlier arrival distribution panel) used the general and discrete probability distribution based on the Inter-Arrival Time Distribution (Appendix 2). There is a single FIFO queue that is connected to five machine blocks, which were used as servers. The service time (see the earlier service distribution panel) is derived from the random number generator, which is based on the data collected as plotted on the Service Time Distribution (Appendix 2). The Queue Statistic and the Activity Statistic screens were used to capture the respective data during the simulation run. See the activity statistics panel in Figure 5 and the queue statistics panel in Figure 6.
Figure 6: Queue Statistics Panel
DISCUSSION
From the data and plots derived from the simulation, the model gave rather accurate queue statistic - the maximum queue length, average queue length, maximum waiting time, and average waiting time. The data plotted were all verified to be in the steady state and the margin of error is acceptable (less than 0.5).
It was noted that with five servers, the average queue length is approximately zero; this is also the result from queuing theory. The average maximum queue length is approximately nine and the utilization of servers 3 to 5 is less than 50%! If another server is added (a 6th server), the average queue length does not change. The maximum queue length is also about nine! Therefore, there is no point in adding more servers to the system and the current utilization of the five servers, as a whole is pretty low. Therefore, to keep the maximum queue length at or below 10, the number of servers required is five. However, utilization of the servers is low except for the first and second servers.
CONCLUSION
Feedback was collected from students as a proof-of-concept of the prototype. More than 80% of the students surveyed stated that the interactive simulation system and the real case study has helped them gain a better understanding of what is required in a good simulation model to obtain a "satisficing" solution. The results obtained from the feedback of the students indicated that this project was successful. The active real case study approach to simulation and modeling pedagogy has fulfilled both its motivations. As students' feedback, based on the project, have been positive, a more detailed study will be carried out in the future.
AUTHOR INFORMATION
Benjamin K. S. Khoo, Ph.D., School of Management, New York Institute of Technology, P.O. Box 8000, Old Westbury, NY 11568, U.S.A. E-mail: [email protected]
REFERENCES
2. Brown, J. S., Collins, A., & Duguid, P. (1989). Situated cognition. In R. W. Lawler & M. Yazdani (Eds.), Artificial intelligence and education (Volume 2, pp. 254-268).
3. Forgionne, G. A. (1990). Quantitative management. Hinsdale, IL: The Dryden Press.
4. Forgionne, G. A., & Kohli, R. (2000). Management support system effectiveness: Further empirical evidence. Journal of the Association for Information Systems, 1(3).
5. Gardner, C. L., Masrsden, J. R., & Pingry, D. E. (1993). The design and use of laboratory experiments for DSS evaluation. Decision Support Systems, 9, 369-379.
6. Goldsman, D., Nance, R. E., & Wilson, J. R. (2010). A brief history of simulation revisited. Proceedings of the 2010 Winter Simulation Conference, ed., B. Johansson, S. Jain, J. Montoya-Torres, J. Hugan, and E. Yücesan, pp. 567-574, Piscataway, NJ: Institute of Electrical and Electronics Engineers.
7. Papert, S. (1980a). Computer-based microworlds as incubators for powerful ideas. In R. P. Taylor (Ed.), The computer in the school: Tutor, tool, tutee. New York: Teacher College Press.
8. Papert, S. (1980b). Mindstorms: Children, computers and powerful ideas. New York: Basic Books. 9. Papert, S. (1991). Situating constructionism. In I. Harel & S. Papert (Eds.), Constructionism.
10. Pidd, M., & Carvalho, A. (2006). Simulation software: Not the same yesterday, today or forever. Journal of Simulation, 1, 7-20.
11. Resnick, M. (1991). Xylophones, hamsters and fireworks: The role of diversity in constructionist activities. In I. Harel & S. Papert (Eds.), Constructionism.
12. Seila, A. F., Ceric, V., & Tadikamalla, P. (2003). Applied simulation modeling. Southbank, Australia: Thomson Learning.
13. Serrano, A., & Hengst, M. (2005). Modeling the integration of BP and IT using business process simulation. Journal of Enterprise Information Management, 18(6), 740-759.
14. Sierhuis, M., Clacey, W. J., Seah, C., Trimble, J. P., & Sims, M. H. (2003). Modeling and simulation for mission operations work system design. Journal of Management Information Systems, 19(4), 85-128. 15. Simon, H. (1977). The new science of management decisions (Rev. Ed.). Englewood Cliffs, NJ:
Prentice-Hall.
16. Swain, J. J. (2009, October). To boldly go discrete event simulation software tools. OR/MS Today, 35(5), 50-61.
APPENDICES
Appendix 1 Inter-Arrival and Service Time Data
Bus Arrival Distribution Service Distribution
Time Interval No. of Buses Time (min) Probability Cum. Prob.
0 0 1 0.46 0.46
1 1 2 0.47 0.93
2 4 3 0.06 0.99
3 2 4 0.01 1
4 5
5 4
6 5 Inter-Arrival Distribution
(steady state)
7 5 Time (min) Probability Cum. Prob.
8 7 0 0.44 0.44
9 16 1 0.43 0.86
10 19 2 0.07 0.94
11 24 3 0.05 0.99
12 18 4 0.01 1.00
13 19
14 11
15 0
225 minutes 140 buses
Average Inter-Arrival Time Average Service Time
0.78min/bus 1.63 min/bus
Average Inter-Arrival Rate Average Service Rate
1.28 bus/min 0.61 bus/min
Appendix 2 Charts
0 0.2 0.4 0.6 0.8 1 1.2
0 1 2 3 4
P
rob
a
b
il
ity
Inter-Arrival Time in minutes
Inter-Arrival Time Probability Distribution (Steady State)
Probability Cummulative Probability
0 0.2 0.4 0.6 0.8 1 1.2
1 2 3 4
P
r
o
b
a
b
il
it
y
Time in Minutes
Service Time Probability Distribution
Probability