Copyright © 200x Inderscience Enterprises Ltd.
Modelling and compilation method for multi-PLC
control program
Chen Chen and Chongquan Zhong*
School of Electronic and Information Engineering, Dalian University of Technology,
No. 2 Linggong Rd,
Dalian 116023, Liaoning, China E-mail: [email protected] E-mail: [email protected] *Corresponding author
Wenyan Wu
Faculty of Arts and Creative Technologies, Staffordshire University,
Beaconside Stafford, ST18 0DF, UK E-mail: [email protected]
Abstract: For the large-scale multi-PLC control system, a network-oriented programming method is proposed. Regarding the control network as a large-scale virtual PLC device, the engineers can program the whole system using all of the resources in the control network directly. A modelling and compilation method for control program is also put forwarded and an event graph model for the programs is created. The serial control program can be decomposed into parallel tasks by event graph model analyse and traversal rule. According to the topology of control network, the event graphs are grouped, and the instructions can be downloaded to the corresponding PLC automatically. The variables of devices can be synchronised through network communication. The experimental result shows that this method can improve the program efficiency of the networked PLC control system, and keep the running logic according with the original program.
Keywords: networked PLC control system; system modelling; program compilation; discrete event system; event graph.
Reference to this paper should be made as follows: Chen, C., Zhong, C. and Wu, W. (xxxx) ‘Modelling and compilation method for multi-PLC control program’, Int. J. Modelling, Identification and Control, Vol. X, No. Y, pp.xxx–xxx.
Biographical notes: Chen Chen received his BSc from Dalian University of Technology in 2006. He is currently working towards his PhD from the School of Electronic and Information Engineering, Dalian University of Technology, China. His recent work focuses on field bus, programmable logic control, monitoring configuration.
Chongquan Zhong received his BSc, MSc and PhD from Dalian University of Technology in 1988, 1991 and 2007. Currently, he is Professor and Doctoral Tutor of School of Electronic and Information Engineering in Dalian University of Technology, China. His main research interests include industrial control network technology, testing technology, embedded application technology.
This paper is a revised and expanded version of a paper entitled ‘Compilation method for control program based on event graph method’ presented at the 19th International Conference on Automation & Computing, Uxbridge, UK, 13–14 September 2013.
1 Introduction
As the development of computer, communication and network control technology, programmable logical controller (PLC) plays an increasingly important role in the field of industry control. The control mode is changing from traditional single PLC control/network communication toward large scale multi-PLC network control system. Since the low cost, easy maintenance and great flexibility, the networked control system becomes a hot topic. Yin et al. (2013) put forward a modelling and controller design method of networked control system over the integrated management platform system (IPMS). Zhu and Guo (2012) proposed an optimal controller to stabilise the closed-loop networked control system with access constraints and network-induced delays. Zhang et al. (2012) presented a quasi T-S fuzzy model which includes the performance of network with time-delay and packet dropouts. However in engineering applications, there are still many limitations and inconveniences in the programming operation of networked multi-PLC control system.
Usually the developers need to understand the topology of the control system and program for each controller respectively. It will become difficult when the number of controllers is large and the control logic is complex. For multi-PLC control system, the program should be developed in a network-oriented way. The control network should be regarded as a large virtual PLC and the developer can use all of the resources in the network directly. The program should be analysed and decoupled into parallel tasks by compiler, and downloaded into each corresponding device automatically. Among the recent PLC program compilation methods, Yan and Chen (2010) proposed a method to avoid the execution of partially useless instructions in PLC program. Tang et al. (2011) analysed the compiling of the PLC ladder diagram, and presented a node compilation method for soft PLC in the VC++ environment. Deveza and Martins (2009) proposed a translation methodology to emulate PLC control program in the MATLAB environment for program simulation. Chmiel et al. (2002) presented a program interpretation method of ladder diagram for a small compact type of PLC. Liu (2009b) used the state space compilation for program simplification. Xu (2009) used the linear matrix inequality compilation for hybrid variable separation. These methods realise the program compilation, optimisation and simulation from different aspects for a single controller. There is no sufficient method to realise the network-oriented programming for networked multi-PLC control system right now.
Discrete event system is a common tool of analysing the dependency relationship of events, which is widely used in various areas in industrial engineering (Luo et al., 2007). In the context of this paper, we convert the control system into
discrete event system, and analyse the dependencies of variables and instructions of the program, transit serial control programs into parallel discrete events, then assign the variables and instructions to different devices. Recently, discrete event system modelling tools include Automata, timed petri-net, event graph, etc. Since the difficulty of analysis is increasing with the complexity of the system, the automata and timed petri-net are difficult to apply in complicated control systems. Event graph, with simplified expression method and powerful modelling capacity, received a wide application in discrete event system (Xia et al., 2012) and becomes a hot topic right now. Nazari et al. (2012) proposed a determination method of component blocking and network blocking in Fully Connected event graphs. Declerck (2011) analysed external trajectories and token deaths in event graphs. Amari et al. (2012) gave a max-plus control design for temporal constraints meeting in timed event graphs.
The major contributions of this paper are as follows:
• a network-oriented programming method for networked multi-PLC control system is proposed
• a modelling and compilation method for
network-oriented program based on event graph is put forwarded.
The rest of the paper is organised as follows. Section 2 presents the event graph modelling method for a control program. Section 3 describes how to distribute the program into different PLCs and realise variable and logic synchronisation. Section 4 presents the operating example of the modelling and compilation method. Section 5 gives a summary of the conclusions and future work.
2 Control program modelling
2.1 Network-oriented programming method
Network is the basis of device management and program development in a networked multi-PLC control system. For different kinds of devices, parameters, variables and registers can be acquired by the device description. Running status and parameter configuration can be achieved by listening, inquiring and request/response operation. The name and input/output parameters of instructions can be got from the instruction description, and the control program of the whole network can be developed in one editing environment.
for each controller separately, and device topology is no longer necessary. These works will be completed by the compiler. There are 4 major tasks in compilation method:
• create an event graph model for converting serial control programs to discrete event systems
• analyse the dependency relationships to identify the parallel task sequences of the modelling by an improved depth first search method
• group the event sequence and distribute the control program into corresponding PLCs
• insert communication instructions to assure the variable and logic synchronisation.
2.2 Discrete event system and control program
Discrete event system refers to a dynamic event-driven system with a hopping change of system state. In this kind of system, events trigger the transition of states at an instantaneous and discrete time point (Liu, 2009a). Control program describes resource allocation and executing logic of the controller, which consists of variables and instructions. Variables store information and instructions process information. The state of PLC control system only changes when instructions executing, and completes instantly at a time point. Thus a complete PLC program can be converted into a discrete event system (Chen et al., 2012). In control system, PLC is the basic physical object and it is the entity of the discrete event system; Variables and parameters of PLC are the attributes of an entity; the collection of all the PLCs’ variables and parameters are the state of the control system; the execution of the instructions leads to the change of system state, thus it is the event of the system.
The event graph is a modelling method of graphical discrete event. It describes the dynamic characteristic through the logic of events and temporal relations (Savage et al., 2005). State changes are associated with the occurrence of a system event and are pictured as event
vertices. The edge between two event vertices represents the conditions under which one event might cause the occurrence of the other event as well as the time interval between the two events (Schruben L and Yucesan E, 1994).
Figure 2 is the example of event graph, if condition en1
is true when event e1 is trigged at clock c1, event e3 will be
trigged after t1 delays. Similarly, if condition en3 is true
when event e3 is trigged at clock c3, event e5 will be trigged
after t3 delays. The advantage of event graph is that the
scheduling relations of events can be expressed visually and it can support the scheduling analysis and optimisation of events based on graph theory (Liu, 2009a).
To facilitate the subsequent discussion, the event graph can be expressed by a two-tuple G = (E, A). The E = {e1, e2, …, e3, …} represents the set of e nodes in the
graph, e represents single event object and ei represents the number i event. A = {a1, a2, …, ai, …} is the set of directed
arc a. ai = f(en, em) = (c, en, t) is defined as a triple on the arc between en and em, in which en is the schedule condition, t is schedule delay, c is the event scheduling marking, which represents the effects of en and em at the number c time point in one circle of task execution process (Cordes et al., 2010).
In the PLC control system, control program constituted by the commands and variables. Controllers follow the order ‘from left to right, top to bottom’ to implement the cyclic scanning,and any execution of an instrument trigged the variable change event. Set I = {i1, i2, …, ij, …}
as instruction set, ii = f(vn, vm) = (C, EN, T) represents a unique variable in control program. C represents the instruction execution sequence, EN represents the value of ‘EN’ pin parameter of an instruction, T represents instruction execution time. Every change of the variables triggered by instructions is an event. Picture a variable as an event node, and when the node is traversed, the variable change event happened. Set V = {v1, v2, …, vi, …} as the
variable change events collection, and P = (V, I) is an event graph which describes the interactions between variables and instructions in a control program.
Figure 2 Example of event graph
2.3 Modelling the control program
Event graph modelling is the basis of analysis and compilation of PLC program. The model can be set gradually by analysis the variables and instructions and transforming the instruction into relationships between input and output parameters. In one PLC program, if the value of variable vm must be determined before that of variable vn,
then vm depends on vn. Dependency relationship is the basis
of analysis control program logic. If there are N input variables and M output variables, then there exists N * M groups of dependency relationship. The dependency relationship of each group will correspond to one scheduling activity in event graph, which is a direct arc connecting two event nodes. The start node of an arc is the event occurred at the prior moment, and the closed node is the event occurred at the posterior moment. Then the instruction ij can be expressed as:
(
)
(
1 1 1)(
2 2 2) (
)
, ,
, , , , ... , ,
j j j j
m n m n m n
i C EN T
c en t c en t c ∗ en ∗ t ∗
=
= (1)
Instruction collection I can be expressed as:
(
)
(
)
(
)
(
) (
)
(
)
(
) (
)
(
)
(
) (
)
(
)
1 1 1
1
2 2 2
2
11 11 11 12 12 12 1 1 1
21 21 21 22 22 22 2 2 2
1 1 1 2 2 2
, , , , , , , , , , , , , , , , , , , , , , , ,
n n n
n
a a a
b b b
n n n n n n nk nk nk
C EN T i
C EN T i
I
C EN T i
c en t c en t c en t
c en t c en t c en t
c en t c en t c en t
⎧ ⎫ ⎧ ⎫ ⎪ ⎪ ⎪ ⎪ ⎪ ⎪ ⎪ ⎪ =⎨ ⎬ ⎨= ⎬ ⎪ ⎪ ⎪ ⎪ ⎪ ⎪ ⎪ ⎪ ⎩ ⎭ ⎩ ⎭ ⎧ ⎫ ⎪ ⎪ ⎪ ⎪ = ⎨ ⎬ ⎪ ⎪ ⎪ ⎪ ⎩ ⎭ # # " " # # % # " (2)
Each row vector in equation (2) represents a set of schedule arcs of an instruction. The number of the scheduling arc
corresponding to each instruction is different. So there are different count of members in each row, namely, the value of a, b and k is independent and it only relates to their own corresponding instructions. The instruction set and variable change events set is two basic elements of the modelling. The main steps of modelling are as follows:
• use template variables to substitute logical connections, and convert the control program to instruction sequence
• map variables to the event vertices
• converting each instruction into sub event graphs including vertices and arcs
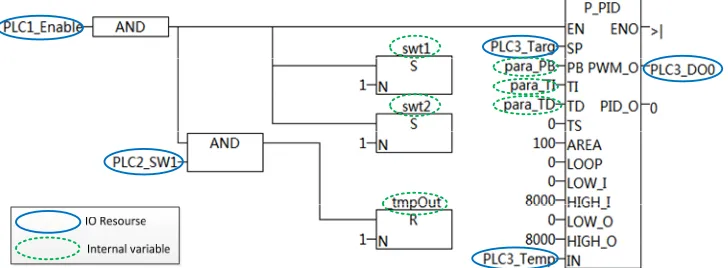
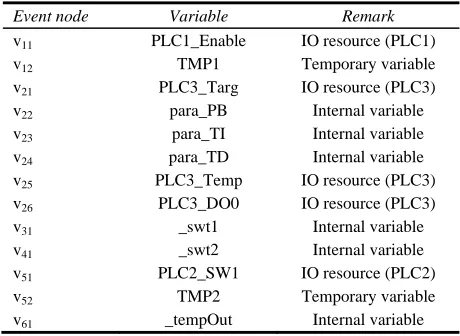
• connect each sub graphs with the same event vertices. In the program shown in Figure 1, there are 11 variables, six instructions and two logical connections. It needs two pairs of template variables to substitute logical connections. Mapping relationships between events and variables are shown in Table 1.
Table 1 Mapping relationships between event nodes and variables
Event node Variable Remark
v11 PLC1_Enable IO resource (PLC1)
v12 TMP1 Temporary variable
v21 PLC3_Targ IO resource (PLC3)
v22 para_PB Internal variable
v23 para_TI Internal variable
v24 para_TD Internal variable
v25 PLC3_Temp IO resource (PLC3)
v26 PLC3_DO0 IO resource (PLC3)
v31 _swt1 Internal variable
v41 _swt2 Internal variable
v51 PLC2_SW1 IO resource (PLC2)
v52 TMP2 Temporary variable
v61 _tempOut Internal variable
The instruction sequence is shown in Figure 3.
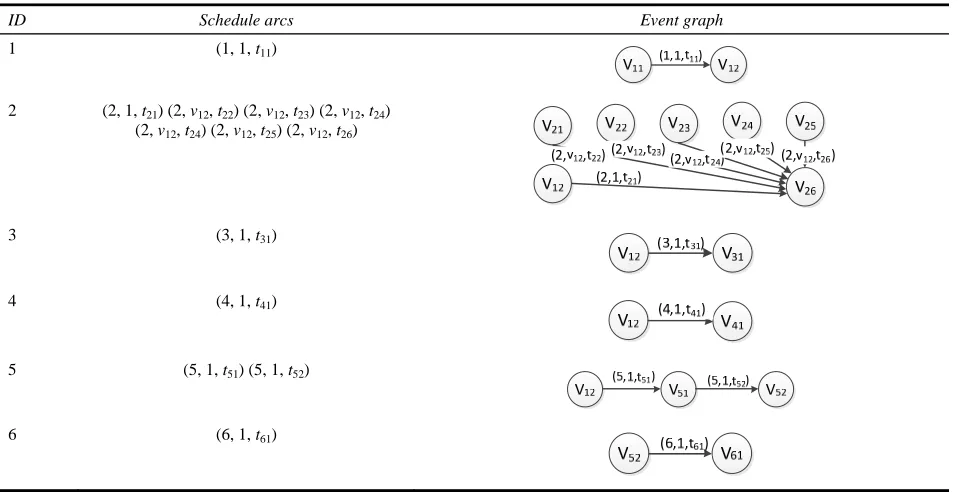
The numbers in the figure are the instruction ID ordered by execution sequence. Sub event graphs corresponding to each instruction are shown in Table 2.
Table 2 Command and event graph
ID Schedule arcs Event graph
1 (1, 1, t11)
2 (2, 1, t21) (2, v12, t22) (2, v12, t23) (2, v12, t24) (2, v12, t24) (2, v12, t25) (2, v12, t26)
3 (3, 1, t31)
4 (4, 1, t41)
5 (5, 1, t51) (5, 1, t52)
6 (6, 1, t61)
Event graph model is built by connecting each sub graphs, shown in Figure 4.
Figure 4 Example of constructing event graph
3 Modelling analysis and program downloading The event graph model describes the dependency relationship of the variables in PLC program. The serial control program can be decomposed into parallel tasks by modelling analyse and traversal. According to the topology of control network, the event graphs are grouped, and the instructions can be downloaded to the most appropriate PLC automatically. The variables of devices can be synchronised through network communication.
3.1 Traversal algorithm of event graph
An event graph traversal rule should be put forward in order to analyse the dependency relationship of the variables in PLC program. Based on improved Depth First Search(Cordes et al., 2010), the event graph can be
disintegrated into several event sequences, so that PLC program can be decoupled. These event sequences are called event tree. One event tree includes the information of events and scheduling activities. It describes that how a variable influences the other variables by specific instructions. Construction of the event trees is the intermediate process which PLC program should be disintegrated into parallel discrete events.
Depth first search is similar to the first traversal of a tree structure. It traverses from the vertex to each possible branch until every vertex is visited. Recursion includes following operations:
a visit the neighbour which has not been accessed b set the visited property of the node to be True c if the node has neighbours which have not been
accessed, visit one of the neighbours in the same way, otherwise go back to the former node and continue searching until all vertices are visited.
algorithm has different traversal rules to process these different kinds of nodes. To facilitate discussion, set scheduling marking parameter c to be the weight of arcs in event graph.
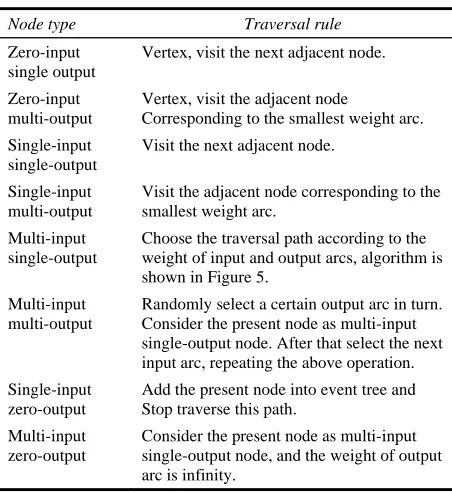
Table 3 shows the method of path selection in recursion operation. Once traverse, a new node, the current node and the arc connection betweenthem should be inserted into event tree. Among traversal rules in Table 3, the process of multi-input single-output node is relatively complex. It describes the situation that the value of an instruction’s input parameter is modified by many other instructions in the program. The processing method depends on the execution order of these instructions. The pseudo code of the process method is shown in Figure 5. It is also the foundation of process of multi-input multi-output and multi-input zero-output nodes.
Table 3 Improved DFS traversal rules
Node type Traversal rule
Zero-input single output
Vertex, visit the next adjacent node.
Zero-input multi-output
Vertex, visit the adjacent node
Corresponding to the smallest weight arc. Single-input
single-output
Visit the next adjacent node.
Single-input multi-output
Visit the adjacent node corresponding to the smallest weight arc.
Multi-input single-output
Choose the traversal path according to the weight of input and output arcs, algorithm is shown in Figure 5.
Multi-input multi-output
Randomly select a certain output arc in turn. Consider the present node as multi-input single-output node. After that select the next input arc, repeating the above operation. Single-input
zero-output
Add the present node into event tree and Stop traverse this path.
Multi-input zero-output
Consider the present node as multi-input single-output node, and the weight of output arc is infinity.
Figure 5 Process of multi-input single-output node IF (OUT < INNOW){
FOREACH (INX){ IF (INX< OUT||INX>INNOW) END;}
}
ELSE {
FOREACH (INX){ IF (INNOW<INX<OUT) END;}
}
ADDTOEVENTTREE (CURRENTNODE);
The weight of the unique output arc is out, and innow
represents the weight of the arc which is accessed by current traverse path. inx is the weight of any other input arcs of the
node. The pseudo code shows that if the weight of current arc innow is less than output arc out, the node can be inserted
into event tree only if there is no arc satisfied the condition of innow < inx < out. That means if a variable is used once
and it is modified by many instructions before use, only the last modified instruction is effective. Otherwise if the weight of current arc innow is greater than output arc out, the
node can be inserted into event tree only if there is no arc satisfied the condition of inx < out or inx>innow. That means
if the value is modified only after used, the last modified instruction is effective.
3.2 Program distributed downloading
The input and output variables of the control system may locate at different devices. Due to the low transmission efficiency of industrial field bus, the bottleneck of large-scale data processing lies in the network bandwidth rather than device performance. Through optimising the parallel event sequence, get the calculation closer to the IO source. The network bandwidth can be saved and achieve high-efficiency computing performance. Industry evaluates it as “moving computing is more economical than moving data” (Hu and Feng, 2010).
Event Tree describes the interaction relationships of variables. One instruction may exist in many event trees, and different variables may influence a same variable by one instruction. Thus, event trees need to be grouped to guarantee variables in one Event Tree cannot be affected by other trees. The optimising process is as follow:
a at the beginning, divide each event tree into an independent group
b inspect whether the two event trees contain the same weights of arcs
c if containing the arcs with same weight and the destination nodes of the arcs are the same, two trees can be combined into one event tree
d repeat the second step until any two event trees do not fulfil the condition of the third step.
Thus, an event diagram shown in Figure 4 can be divided into the following four groups:
There is no coupling relationship between events and schedule activities in grouped events trees, and these trees can be assigned to different devices. The compiler must guarantee the regular communications and control logic, and also the overloading of single Device should be avoided. Therefore, there are two fundamental modes: Synchronised optimisation, decrease communication delay between devices and keep the synchronisation of control logic as much as possible; load balance, calculate and compare the expected scheduling time of each assignment scheme, get the shortest one to reduce the execution cycle of single device (Yong et al., 2010).
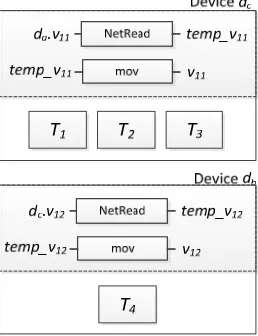
After the optimisation, each group of event trees which is independent from each other can be distributed to different devices. One event tree can be downloaded into different devices. If there exists a set of N groups of event trees = {T1, T2, …, TN}, Ti contains the set of variables
Vi = {vi1, vi2, …, vik}, 1 ≤ i ≤ N, The basis of the
IO. If there exists a set of devices D = {d1, d2, …, dM}, di is
the device containing practical IO, di contains the variable set VDi = {vi1, vi2, …, vik}, the elements in VDi is the
physical IO of the device and 1 ≤i≤M. If Øab is the time of transmitting one variable between da and db, the measurement unit is (ms), ρi1a is the number of elements contained in Vi ∩ VDa, Wi = {wi1, wi2, …, wiM} is the
communication time which is produced after li is allocated to each device. The communication time which li is allocated to device da is shown by equation (3).
1 Ø1 2 Ø 2 Ø
ia i a i a iM aM
w =ρ × +ρ × + +" ρ × (3)
Ti should be assigned to the device which produces the minimum communication time. If wia = wib, then assigned Ti to the device who has less instructions.
Set the event tree shown in Figure 6 as an example. There exists device set D = {dA, dB, dC} and event tree set T = {T1, T2, T3, T4}. If ØAB =50, ØBC =20, ØAC =80, in event tree T1, w1a = 240, w1b =290, w1c =50, and w1c is the minimum, so allocate a to device dc. In the similar way, communication time of other events trees and devices is shown in Table 4. In event tree T4, both w4b and w4c are the minimums. Since the number of instructions in device db is smaller, T4 is assigned to device db.
Table 4 Communication delay list
Event
tree i wia (ms) wib (ms) wic (ms)
Target device
1 240 290 50 dc
2 80 20 0 dc
3 80 20 0 dc
4 130 20 20 db
3.3 Variable synchronisation
Different event trees may contain same event. After assigning devices for event tree, the same variable may exist in different devices. In the example shown in Figure 6, variable v12 will be assigned to device da, db and dc. In order
to guarantee the correct logic of the program, devices should read the real time data from other devices and synchronise to the local corresponding variable (Liao and Hu, 2009). The basic principles of variable synchronisation are as follow:
a if a variable is allocated to two or more devices, it will be duplicated into many replicas and executed in each device
b allocate buffers for each device and store the value of the replicas of which are read from different devices c insert communication instructions, read the value of from other devices into local input buffer or write the value of into output buffer of other devices.
Figure 6 Event graph grouping
Usually input parameters of instructions need to be synchronised. Communication instruction should be inserted at the beginning of the program. Read the value of variables into local input buffer and use replicas to replace the variable. Sometimes output parameters need to be written to the physical output interface of other devices. Communication instruction should be inserted into the end of program and write the value of parameter into the output buffer of the other device. Insert instructions into the other device to read the data from the output buffer, so that the output variable synchronisation will be realised.
Figure 7 shows the variable synchronisation operation of events trees in Fig.6. Event tree T1 is assigned to device dc,
so instructions need to be inserted into the beginning of program in dc to read the value of variable v11 in da. The
value should be stored into buffer and replace the variable v11 in event tree T1. Similarly Event tree T4 is assigned to
device db, instructions need to be inserted into the beginning of program in db to read the value of variable v12 in dc, The
value should be stored into buffer and replace the variable v12 in event tree T4.
4 Operating examples and analysis
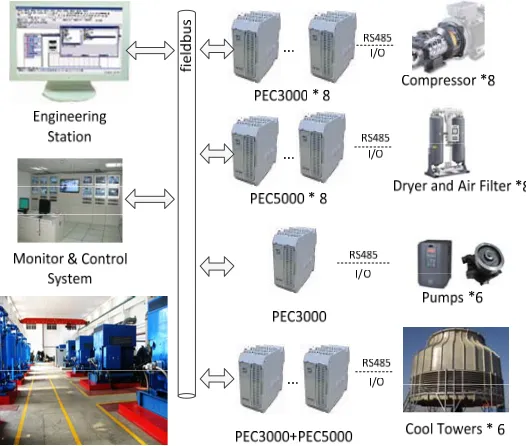
The modelling and complication method for multi-PLC control program proposed by this paper has already been applied and verified in the central control system of a compressor station in a shipbuilding industry group. The networked multi-PLC control system monitors and controls eight groups of compressors, dryers and air filters, and six groups of pumps and cooling towers. Also the system monitors the total tank pressure and air consumption of the factory. Topological structure of system is shown in Figure 8.
The engineer station executes programming software. Engineers programmed the whole system using the network-oriented program and compilation method proposed in this paper, and replaced the original program; The monitor and control centre monitoring manual operation signal and displaying human machine interface; Networked control system is made up by 20 PLCs. It monitors the speed, Shaft vibration and movement, surge, and also the pressure and temperature of compressors; and controls the temperature and humidity of dryers, speed and flow velocity of pumps and the pressure and temperature of inflow and outflow of the cooling towers.
We have upgraded the program software and used the program developed by new method proposed in this paper to replace the original one. During daily operation, the control logic was consisted with the original program. But the efficiency of development was greatly improved since the engineer could regard the whole network as a large virtual PLC without concerning the topology of the controllers any more. The modelling and compilation method is demonstrated by using the example of dryer temperature control program, shown in Figure 9. Here is the explanation for the devices and variables in this figure.
Device ConDev : located in monitoring centre, collect the manual operation; ConDev_Dry1: the start and stop control variable of 1# dryer; Device DryDev1 : the temperature control device of 1# dryer; DryDev1_Temp: the temperature as the PID instruction’s feedback input parameter; DryDev1_DO0: the first digital output signal of device DryDev1, controls the heating of 1# dryer; TargVal, para_PB, para_TI and para_TD are internal variables, record the target temperature and PB, TI, TD parameters set by customers. Temperature control program for 1# and 2# dryers is shown in Figure 9 and the other dryers’ program are similar to it.
According to the modelling building method in Section 2, an event graph model can be built for the program, as shown in Figure 10. The graph consists 14 nodes and 17 arcs, in which, tmp1~tmp3 are automatically inserted temporary variables which replace the logical connections. Other mapping relationships between nodes and variables are list in the right part of the figure.
By using traversal rules and event tree grouping methods in Section 3, the event graph in Figure 10 can generate two event trees with no coupling relationships. The event trees will be download separately to device DryDev1 and DryDev2, shown in Figure 11.
The control program is compiled and downloaded to different controllers and its logic is parallel running. The control logic is consisted with the original program. To evaluate the modelling a compilation method, we compare the program distributed into each sub system with the original one, and count the number of instructions and communication instructions inserted into the program by the compiler.
Figure 9 Temperature control program for 1#and 2# dryers
Figure 10 Discrete event model
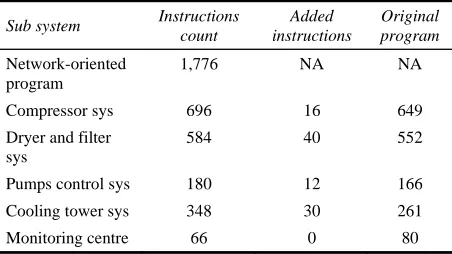
Table 5 Dispersed effect of downloading control programs
Sub system Instructions count
Added instructions
Original program
Network-oriented program
1,776 NA NA
Compressor sys 696 16 649
Dryer and filter sys
584 40 552
Pumps control sys 180 12 166
Cooling tower sys 348 30 261
Monitoring centre 66 0 80
The control program is downloaded to five sub control systems. As other systems need to read the control command from the monitoring centre, network communication instructions are added by the compiling algorithm. As the existence of numerous monitoring parameters, program needs many serial communication instructions to read and write these parameters from the compressor controllers. Consequently, the number of instructions is relatively big. At the meantime, we can also observe a big amount of communication instructions inserted by the compiler because the dryers and air filters and cooling tower control system need to read parameters from monitoring centre. The data in Table 5 illustrates that the number of instructions of programs downloaded in each sub system is similar to the original programs’. Without considering the developers’ habit, the compilation algorithm generated a group of communication instructions for each shared variable. However, the developer allocated the shared variables at a consecutive address in original program then synchronised them together at the beginning and the end of the program. As a result, the number of communicated instructions in original program is smaller than the ones inserted by the compiler which is the point need to be optimised in this compilation algorithm.
5 Conclusions
Considering the large-scale multi-PLC control system, a network-oriented programming method is proposed. Regarding the control network as a large-scale virtual PLC device, the engineers can program the whole system using all of the resources in the control network directly. It prevents the inconvenient artificial operations of current method such as device topology analysing, individually programming, and variable and logic synchronisation. Consequently, it reduces the difficulty of system development and improves the programming efficiency. On this basis, an event graph model for the programs is created. The serial control program can be decoupled into parallel tasks by the analyse and traversal rule of the event graph. And the program can be dispersed downloaded into different devices by method of event tree grouping and variable synchronisation. The method has been applied and verified in a local shipbuilding industry group. The application result shows that the compile method can
improve the program efficiency of the networked PLC control system and satisfied the application requirement. It has a high application value of the program design and compilation in multi-PLC control system.
The limitation is that the expected execution time needs to be calculated and compared for all of the devices and the event trees at the device assignment operation. It will reduce the compilation efficiency when there is a large number of event trees and devices. And the variable synchronisation method needs to be optimised as shown in the last part of Section 4. Further research is needed to address these points.
Acknowledgements
The authors gratefully acknowledge support from the National High Technology Research and Development Programmre of China (2013AA040303), National Science and Technology Support Progmeram of China (2012BAH68F02), and EU FP7-SmartWater Project (PIRSES-GA-2012-318985).
References
Amari, S., Demongodin, I., Loiseau, J.J. and Martinez, C. (2012) ‘Max-plus control design for temporal constraints meeting in timed event graphs’, IEEE Transactions on Automatic Control, Vol. 57, No. 2, pp.462–467.
Chen, Y., Xi, N. and Li, H. (2012) ‘Event-based control theories and applications’, Journal of Mechanical Engineering, Vol. 48, No. 17, pp.152–158.
Chmiel, M., Hrynkiewicz, E. and Muszynski, M. (2002) ‘The way of ladder diagram analysis for small compact programmable controller’, The 6th Russian-Korean International Symposium on Science and Technology, pp.169–173, KORUS.
Cordes, D., Marwedel, P. and Mallik, A. (2010) ‘Automatic parallelization of embedded software using hierarchical task graphs and integer linear programming’, International Conference of Parallel Architectures and Compilation Techniques, pp.267–276, Scottsdale.
Declerck, P. (2011) ‘From extremal trajectories to token deaths in p-time event graphs’, IEEE Transactions on Automatic control, Vol. 56, No. 2, pp.463–467.
Deveza, T. and Martins, J.F. (2009) ‘PLC control and Matlab/Simulink simulations a translation approach’,
IEEE Conference on Emerging Technologies & Factory Automation, pp.1–5, Mallorca.
Hu, Y. and Feng, J. (2010) ‘Distributed search engine using hadoop’, ComputerSystems&Applications, Vol. 19, No. 7, pp.224–228.
Kwong, R.H. and Yonge-Mallo, D.L. (2011) ‘Fault diagnosis in discrete-event systems: incomplete models and learning’,
IEEETransactions onSystems, Man, and Cybernetics, Part B: Cybernetics, Vol. 41, No. 1, pp.118–130.
Liao, Y. and Hu, J. (2009) ‘Communication of the multi-PLC distributed control system’, Mining&ProcessingEquipment, Vol. 37, No. 14, pp.38–41.
Liu, G. (2009a) Research on Component-based Visual Modeling Technology for Parallel Discrete Event Simulation, Thesis from College of Computer Science and Technology of National University of Defense Technology, Hu Nan, China. Liu, J. (2009b) Research and Implementation of FBD Program
Model and Optimization Technology, Thesis from Control Theory and Control Engineer of Dalian University of Technology, Liaoning, China.
Luo, J., Wu, W., Su, H. and Chu, J. (2007) ‘Combined controller synthesis for marked graphs’, Acta Automatica Sinica, Vol. 33, No. 2, pp.218–221.
Nazari, J.G.S. (2012) ‘Blocking in fully connected networks of arbitrary size’, IEEE Transactions on Automatic Control, Vol. 57, No. 5 pp.1233–1242.
Savage, E.L., Schruben, L.W. and Yücesan, E. (2005) ‘On the generality of event-graph models’, INFORMS Journal on Computing, Vol. 17, No. 1, pp.3–9.
Tang, Z., Wang, T., Dong, J. et al. (2011) ‘Compiling ladder diagram based on node method’, International Conference on Control, Automation and Systems Engineering, pp.1–4, Singapore.
Xia, W., Yao, Y., Mu, X. and Liu, L. (2012) ‘Parallel model checking for discrete event simulation models based on event graphs’, JournalofSoftware, Vol. 23, No. 6, pp.1429–1443.
Xu, W. (2009) A Transformation Technique of PLC Function Block Diagram and Sequential Function Chart based on LMI, Control Theory and Control Engineer of Dalian University of Technology, Liaoning, China.
Yan, Y. and Chen, H. (2010) ‘An optimizing compiler method to avoid partial invalid PLC instructions’, IEEE International Symposium on Industrial Electronics, pp.80–83, Bari. Yin, Y., Xia, L., Song, L. and Ren, Z. (2013) ‘The ship IPMS
networked control system modelling and design’, Int. J.
Modelling, Identification and Control, Vol. 20, No. 3, pp.234–241.
Yong, Y., Wang, Y. and Liu, Z. (2010) ‘An algorithm used to improve task parallelization for directed acyclic graphs’, International Conference of Advances in the Dempster-Shafer Theory of Evidence, pp.238–240, Hong Kong.
Zhang, H., Fang, H., Ren, X. and Qian, T. (2012) ‘Stability analysis of networked control system based on quasi T-S fuzzy model’, Int. J. Modelling, Identification and Control, Vol. 16, No. 1, pp.41–49.
Zhu, C. and Guo, G. (2012) ‘Optimal control of networked control systems with limited communication and delays’, Int. J.