https://doi.org/10.5194/jsss-7-453-2018
© Author(s) 2018. This work is distributed under the Creative Commons Attribution 4.0 License.
Comparison of defect detection limits in Lorentz force
eddy current testing and classical eddy current testing
Jan Marc Otterbach1, Reinhard Schmidt1, Hartmut Brauer1, Marek Ziolkowski1,2, and Hannes Töpfer1 1Advanced Electromagnetics Group, Technische Universität Ilmenau,
Helmholtzplatz 2, 98693 Ilmenau, Germany
2Applied Informatics Group, West Pomeranian University of Technology,
Sikorskiego 37, 70313 Szczecin, Poland
Correspondence:Jan Marc Otterbach ([email protected])
Received: 29 September 2017 – Revised: 21 June 2018 – Accepted: 27 June 2018 – Published: 27 July 2018
Abstract. Lorentz force eddy current testing (LET) is a motion-induced eddy current testing method in the framework of nondestructive testing. In this study, we address the question of how this method is classified in comparison with a commercial eddy current testing (ECT) measurement device ELOTEST N300 in combination with the probe PKA48 from Rohmann GmbH. Therefore, measurements using both methods are performed and evaluated. Based on the measurement results, the corresponding defect detection limits, i.e., up to which depth the defect can be detected, are determined and discussed. For that reason, the excitation frequency spectrum of the induced eddy currents in the case of LET is considered.
1 Introduction
Classical eddy current testing (ECT) methods are based on a time-changing magnetic field that induces eddy currents in the electrically conducting specimen under study. Com-mon ECT uses an alternating-current-driven coil, which pro-duces an alternating magnetic field that generates eddy rents in the specimen. In contrast, motion-induced eddy cur-rent testing (MECT) methods are based on the relative mo-tion between a stamo-tionary magnetic field source and the speci-men under study that generates eddy currents. In recent years different MECT methods have been developed. Ramos et al. (2013) carried out an investigation using a DC coil as a stationary magnetic field source instead of a permanent net (PM) (Ramos et al., 2013). The perturbation of the mag-netic field caused by a defect was measured by giant magne-toresistance (GMR) sensors. Extending this line of research, GMR sensors were replaced by single or differential pick-up coils (Ramos et al., 2014).
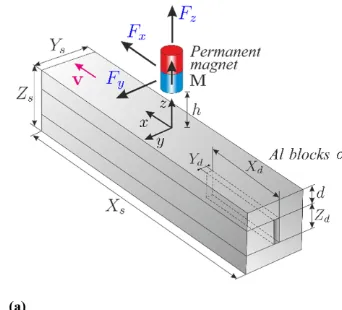
The basic principle of Lorentz force eddy current test-ing (LET) was introduced in 2008 by Brauer and Zi-olkowski (2008) and is shown in Fig. 1a. It is based on the relative translational motion between a PM and the specimen under study. Due to this relative motion, eddy currents are
induced, leading to a Lorentz force acting on the conductor and, according to Newton’s third law, on the PM. In the pres-ence of a defect, the eddy currents are perturbed as well as the Lorentz force. Therefore, LET can be described as a MECT method. In contrast to ECT and other MECT methods, the force is measured to identify the defect. Experimental and numerical studies on LET were carried out by Uhlig (2013) and Zec (2013). Recent investigations have focused on di-mensional analysis and similarity solutions (Carlstedt, 2017) and optimal sensor design and uncertainty analysis, broaden-ing the understandbroaden-ing of LET (Weise, 2016). Usbroaden-ing a con-solidated experimental setup, the question as to how the de-tection depth in nondestructive material evaluation compares to ECT is addressed in this paper. Therefore, we extend the comparison of ECT and LET done by Carlstedt et al., focus-ing in this study on the detection limit of LET and ECT for deep-lying defects in solid specimens (Carlstedt et al., 2013).
2 Methods
Figure 1.Measurement principles for LET(a)and ECT(b).
are induced in the specimen. This leads to a Lorentz force acting on both the conductor and the PM. In the case of a de-fect in the specimen, the eddy currents and the Lorentz force are perturbed. By measuring the force acting on the PM, this force perturbation enables defect detection, localization, and reconstruction (Brauer et al., 2014). For a low product of ve-locity and conductivity as used here, the drag force is propor-tional to the product of velocity and conductivity (Carlstedt et al., 2016). This relationship can be used to adopt the mea-suring parameters to the current application.
In order to determine the detection limit of LET and ECT, we use a specimen with a long slit of defined geom-etry, which is inspired by a study of Mook (Mook et al., 2006). Because of limiting manufacturing possibilities, it is not possible to produce a solid specimen with a defined in-ternal defect. For this reason the specimen is split up into three separate aluminum blocks made of the aluminum alloy (EN AW-5754). The size of the specimen isXS=250 mm,
YS=50 mm, and ZS=70 mm. One of these blocks has
got a pseudo-infinite defect of length Xd=100 mm, Yd=
2 mm, andZd=20 mm (see Fig. 1). Solid blocks of different
heights are combined, enabling different defect depthsdat a constant total specimen heightZS.
Common eddy current testing uses an alternating-current-driven coil to generate an alternating magnetic field. The eddy currents generate a secondary magnetic field which can be detected by a secondary coil. Usually, the change of the impedance of the secondary coil is used to evaluate the ma-terial under study. The change of impedance due to the pres-ence of a defect on or near the surface of the specimen can be detected (García-Martín et al., 2011; Hellier, 2003). Fig-ure 1b shows the ECT measFig-urement principle which was em-ployed in this study.
3 Experimental setups and measurement procedures for LET and ECT measurements
3.1 LET measurement setup
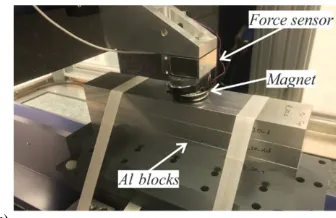
The LET measurements are performed with the BASALT-C MMP-15 (TETRA GmbH, 2015) (see Fig. 2a). This mea-surement device consists of the mechanical system and the control cabinet. In order to reduce external influences on the force sensing unit, the mechanical system is set on a granite block with high mass to increase the inertia. A linear direct drive is mounted on the granite block to realize the move-ment in the x direction of the investigated specimen. This direct drive enables accelerations up to 50 m s−2and main-tains a constant velocity with a negligible standard deviation of 2.19×10⁻¹⁰mm s−1. A granite portal is installed which spans over the linear drive. On this portal, spindle drives in thezandy direction are mounted, to position different sen-sor types above the specimen fixed to the slide of the lin-ear drive. All drives and the data acquisition are controlled via the panel PC in the control cabinet. The integration of the acquisition task and the positioning task allows complex measurement series to be programmed in G-code (TETRA GmbH, 2015).
3.2 LET measurement procedure
Af-Figure 2.Measurement setups for LET(a)and ECT(b).
ter passing the magnetic field of the PM, thexdrive as well as the acquisition is stopped and the specimen is moved back to the starting position. Now, the scan can be repeated. In this experiment, the strain gauge force sensor K3D40 from ME-Meßsysteme GmbH (2014) is used. The nominal force of this triaxial sensor is±2 N in all three directions. The upper side of the force sensor is mounted at the positioning portal above the linear drive in the x direction. At the bottom side, the mount which carries the PM is fixed. Due to the fact that stacked aluminum blocks are used as a specimen instead of a solid body, we swapped the block with the long slit with a block of the same aluminum alloy and the same geometry but without a slit to compare the measurement with and without a defect.
3.3 ECT measurement setup
In order to perform the ECT measurement, the ECT device ELOTEST N300 in combination with the probe PKA48 from Rohmann GmbH (2003) is used. The probe is a differential ECT probe and includes secondary pick-up coils. The struc-ture of the probe was already investigated in detail by Porzig et al. (2014). This probe is best suited from the available probes to detect deep-lying defects. For obtaining appropri-ate measurements, a stand-alone chuck apparatus is designed which allows the ECT probe to be positioned at specified positions in the x direction on the surface of the specimen (stacked aluminum blocks) as seen in Figs. 1b and 2b. A guide at the apparatus ensures that the ECT probe is posi-tioned centered in theydirection to the specimen (and hence to the slit).
3.4 ECT measurement procedure
During the ECT measurement, the stacked aluminum blocks are clamped in the chuck apparatus (see Fig. 2b). The ECT probe is positioned at specified points with equidistant dis-tances of1x=5 mm between the positions in thexdirection on the surface of the specimen (stacked aluminum blocks) as illustrated in Fig. 1b. The slit defect ranges fromx=25 to x=125 mm. In a range ofx= −50 to x=75 mm, the impedance of the ECT probe is measured with the
excita-tion frequency fexc=100 Hz and averaged over a certain
time. Preceding investigations using excitation frequencies from the range 10–1000 Hz in the ECT measurement setup have shown that the excitation frequencyfexc=100 Hz is
the lowest frequency at which the measured signals due to noise can be interpreted accordingly. For lower frequencies it was not possible to extract a defect signal due to the noise. For higher frequencies no better results concerning the de-fect detection limit could be achieved. For the excitation fre-quency usedfexc=100 Hz, the skin depthδ for the
investi-gated Al alloy is approximately 11 mm. The I/O ports of the ELOTEST N300 are used to measure the impedance with the BNC-2120 module from National Instruments (2012). The measurements are repeated for both setups with and without defects. The signals obtained are amplified in the measure-ment system. An optimal amplification was determined to use as much of the measurement range as possible, achiev-ing a maximal sensitivity. Once this amplification factor was determined, it is used for one depth configuration with and without defects to achieve comparability between the mea-sured signals.
4 Results
In the following, a comparison between LET and ECT mea-surements with focus on the detection depth of both methods is presented.
All LET measurements are performed with an axially magnetized NdFeB cylinder magnet of material grade N52, with diameter Dmag=29 mm and height 10.7 mm. There
are several reasons for using the velocity v=300 mm s−1 in the LET measurements and an excitation frequency of fexc=100 Hz. The velocity is set to this value because the
weight forces of the magnet and the mechanical assembly fixing the magnet at the force sensor, as well as the lift force, act on the force sensor. Increasing the velocity might result in destruction of the force sensor, especially when passing the edges of the specimen, where the lift force reaches its maximum.
A(f)=Tsinc(Tf). (1)
The frequency spectrum of the rectangular pulse is a contin-uous function. However, to compare the LET setup with the classical ECT the single frequency corresponding to the first extremum of the spectrum, equal tof1≈3/(2T)≈15.5 Hz,
is introduced. The frequency f1 can be interpreted as an
equivalent excitation frequency for the LET method. Using the equivalent frequency, the skin depth can be calculated as
δ= s
1 π f1µ0σ
=27.7 mm (2)
for the used LET setup. Similarly, for the ECT setup with an excitation frequency 100 Hz, the corresponding standard skin depth given by Eq. (2) equalsδ=10.9 mm.
It should be mentioned that the standard skin depth is determined assuming that a plane electromagnetic wave is incident perpendicularly on a conducting half-space. Mottl (1990) showed that the true skin depth for an air-cored ECT excitation coil depends on the size and shape of the probe. The mean coil radius of the used ECT probe is in the range of the skin depth. According to Mottl, the standard skin depth in such a case is almost 2 times larger than the true skin depth. However, due to the complex internal structure of the ECT probe used (Porzig et al., 2014), the correction suggested by Mottl cannot be directly applied. To compare both methods in a similar way, the standard formula (2) is used with awareness that the skin depth for the ECT setup is overestimated.
It can be observed that the equivalent LET frequency is much smaller than the excitation frequency used in the ECT setup.
In order to reduce this difference, either the velocity in the LET setup has to be increased or the excitation frequency in ECT has to be decreased. However, due to the fact that both of the used measurement systems operate at their limits, it is not possible to perform the suggested adjustment of the setup parameters. In the case of LET, mechanical oscillations and the measurement range of the force sensor limit the maxi-mum velocity for the actual setup. Otherwise, the conven-tional ECT system used enables excitation frequencies down to 10 Hz. However, due to noise, evaluable signals can only be acquired for an excitation frequency above 100 Hz.
Furthermore, the mechanical fixation of the specimen on thexdrive limits the lift-off toh=1 mm. The measurement
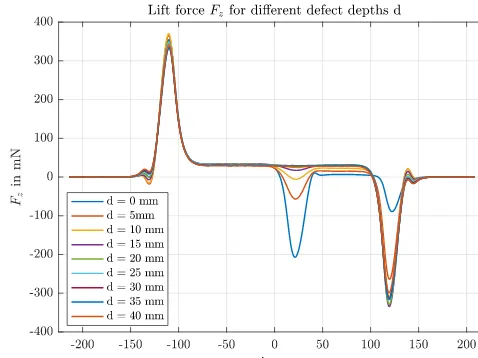
Figure 3.Measured lift forceFzin LET measurement of different
specimens with different slit defect depthsd.
is repeated 15 times and as a next step is averaged to reduce random errors in the data.
Previous investigations on LET showed that the lift force Fz is the most sensitive force component to detect defects.
This is the reason why onlyFzis shown in the measurement
results in order to investigate the detection limit of LET. Fig-ure 3 shows the run of the lift force over the whole specimen length starting from negativex. It can be noted that there is a force deviation at the edges of the specimen atx= ±125 mm and at the edge of the slit atx=25 mm. For every defect depth the assembly of the specimen changes, as shown in Fig. 1b. The heightd of the Al block on top of the assem-bly influences the lift force signal at the edges of the spec-imen. Additionally, the slit is located at the end edge of the specimen. Hence, these two effects result in the various dif-ferences in the lift force at the front and the end edge of the specimen. In addition Fig. 3 shows that the deviation at the edge of the slit decreases with increasing defect depthd.
(a) (b)
(c) (d)
With defect Without defect
With defect Without defect
With defect Without defect
With defect Without defect
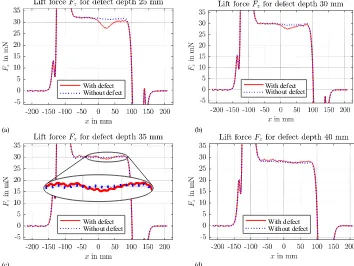
Figure 4.Measurement results of the lift forceFzwith (solid red line) and without a defect (dotted blue) for the defect depthsd=25 mm, d=30 mm,d=35 mm, andd=40 mm.
the detection limit of LET in the examined material scenario is between 35 and 40 mm.
The differences between the measurements with and with-out defects – except for the perturbation at the edge of the defect – result from slight lift-off differences of the z-axis adjustment.
As already mentioned,fexc=100 Hz was the lowest
us-able frequency for ECT, resulting in the best results for the detection limit. Hence, only these best results for this single frequency are shown in the following.
For comparison of the ECT measurements, the amplitude of the impedance for each depth is normalized with respect to the value measured in the center of the defect-free specimen at x=0 mm. Additionally, the phase was shifted in such a way that at the same position in the center, in the case of no defect, the phase has zero degrees.
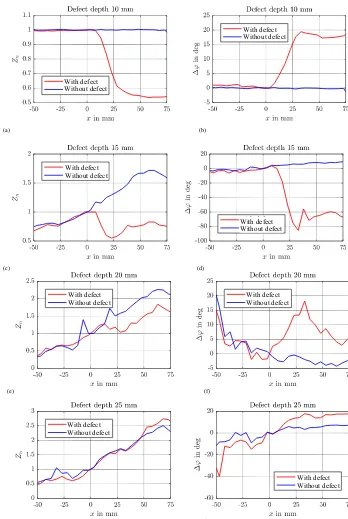
In Fig. 5, the measured normalized impedance Zn=
Z(x)/Z(x=0)
(panels a, c, e, and g) and the measured phase difference1ϕ (panels b, d, f, and h) measured with the ECT coil are shown WRT the coil’s positionxfor defect depthsd=10 mm up tod=25 mm. It can be seen that the edge of the slit at x= +25 mm is still detectable for a de-fect depth ofd=15 mm mainly due to a change in the phase (Fig. 4d). For defect depths of d=0 and 5 mm (not shown here) a strong change in the phase, but also in the impedance, is recognized at the edge of the slit at x= +25 mm. In the case of the defect at depth d=20 mm, there is a slight
change of impedance or a phase shift visible at the edge of the defect. For a defect depthd=25 mm the impedance is slightly increasing with and without defects – the signals are somehow parallel to each other but no indication of the de-fect is possible. The slight variations in the phase that can be seen in Fig. 5h are a result of the noise due to the amplifica-tion used.
Hence, the detection limit for the ECT probe is at d=
20 mm.
5 Conclusions
In this study, the detection limit of the LET setup is de-termined and compared to ECT measurements performed with the commercial ECT measurement device ELOTEST N300 from Rohmann GmbH. The LET measurement data are acquired with the multi-measurement platform BASALT-C MMP-15 which is available at the Advanced Electromagnet-ics Group at the Technische Universität Ilmenau. The basic principles as well as the measurement setups and the mea-surement procedures are described.
The different excitation mechanisms and the correspond-ing frequency ranges for both setups used have been dis-cussed. The LET technique is well suited for the detection of deep buried defects due to its low equivalent frequency.
(a) (b)
(c) (d)
(e) (f)
(g) (h)
With defect Without defect
With defect Without defect
With defect Without defect
With defect Without defect
With defect Without defect
With defect Without defect
Figure 5.Normalized impedanceZnand phase difference for defect depths ofd=10 mm(a, b),d=15 mm(c, d),d=20 mm(e, f), and
d=25 mm(g, h)for specimens with a defect (red solid line) and without a defect (blue solid line) of the ECT measurement.
excitation frequency for ECT. LET enables the detection of defects, whereby in the classical ECT a very low excitation frequency should be applied. However, this is challenging due to noise and demands complex and sophisticated signal acquisition and processing. The measurement results show that it is possible to detect the slit defect in a depth of 35 mm
in the case of LET and at 20 mm in the case of ECT, which is in agreement with the discussion about the frequency range for both methods.
motion-induced technique is especially of interest for appli-cations with moving objects as often found in production lines in industry.
Data availability. Raw data of the presented measurements are available upon request to the author.
Competing interests. The authors declare that they have no con-flict of interest.
Acknowledgements. The present work is supported by the Deutsche Forschungsgemeinschaft (DFG) in the framework of the Research Training Group 1567 “Lorentz force velocimetry and Lorentz force eddy current testing”.
Edited by: Marco Jose da Silva Reviewed by: three anonymous referees
References
Bracewell, R. N.: The Fourier Transform and its applications, McGraw-Hill, Boston, USA, 2000.
Brauer, H. and Ziolkowski, M.: Eddy Current Testing of Metallic Sheets with Defects Using Force Measurements, Serbian Journal of Electrical Engineering, 5, 11–20, 2008.
Brauer, H., Porzig, K., Mengelkamp, J., Carlstedt, M., Ziolkowski, M., and Toepfer, H.: Lorentz force eddy current testing: a novel NDE-technique, COMPEL 2014, 33, 1965–1977, 2014. Carlstedt, M.: A contribution to the experimental validation in
Lorentz force eddy current testing, dissertation, Technische Uni-versität Ilmenau, Ilmenau, Germany, 2017.
Carlstedt, M., Porzig, K., Ziolkowski, M., Uhlig, R. P., Brauer, H., and Toepfer, H.: Comparison of Lorentz Force Eddy Current Testing and Common Eddy Current Testing – Measurements and Simulations, Stud. Appl. Electromag., 39, 218–225, 2013. Carlstedt, M., Weise, K., Ziolkowski, M., Schmidt, R., and Brauer,
H.: Estimation of Lorentz-Force From Dimensional Analysis: Similarity Solutions and Scaling Laws, IEEE T. Magn., 52, 7004813, https://doi.org/10.1109/TMAG.2016.2539927, 2016. García-Martín, J., Gómez-Gil, J., and Vázquez-Sánchez, E.:
Non-Destructive Techniques Based on Eddy Current Testing, Sensors 2011, 11, 2525–2565, 2011.
Hellier, C. J.: Handbook of Nondestructive Evaluation, McGraw Hill, New York, USA, 2003.
ME-Meßsysteme GmbH: Data Sheet: Mehrachsen-Kraftsensor K3D40, Henningsdorf, Germany, available at: https: //www.me-systeme.de/docs/de/datasheets/k3d40.pdf (last access: 20 September 2017), 2014.
Mook, G., Hesse, O., and Uchanin, V.: Deep Penetrating Eddy Cur-rents and Probes, EC NDT, Berlin, Germany, 25–29 Septem-ber 2006, Tu.3.6.2, available at: https://www.ndt.net/article/ ecndt2006/doc/Tu.3.6.2.pdf (last access: 5 September 2017), 2006.
Mottl, Z.: The quantitative relations between true and standard depth of penetration for air-cored probe coils in eddy current test-ing, NDT International, 23, 11–18, 1990.
National Instruments: BNC-2120 Installation Guide, available at: http://www.ni.com/pdf/manuals/372123d.pdf (last access: 1 September 2017), 2012.
Porzig, K., Carlstedt, M., Ziolkowski, M., Brauer, H., and Toepfer, H.: Reverse engineering of ECT probes for nondestructive evalu-ation of moving conductors, AIP Conference Proceedings, 1581, 1519–1525, https://doi.org/10.1063/1.4865003, 2014.
Ramos, H. M. G., Rocha, T., Pasadas, D., and Ribeiro, A. L.: Veloc-ity induced eddy currents technique to inspect cracks in moving conducting media, IEEE International Instrumentation and Mea-surement Technology Conference (I2MTC 2013), Minneapolis, MN, USA, 6–9 May 2013, 931–934, 2013.
Ramos, H. M. G., Rocha, T., Ribeiro, A. L., and Pasadas, D.: GMR Versus Differential Coils in Velocity Induced Eddy Current Test-ing, IEEE International Instrumentation and Measurement Tech-nology Conference (I2MTC 2014), 12–15 May 2014, Montev-ideo, Uruguay, 915–918, 2014.
Rohmann GmbH: User manual: ELOTEST N300 Rev. 01, Franken-thal, Germany, 2003.
TETRA Gesellschaft für Sensorik, Robotik und Automation mbH: User manual: BASALT®-C MMP-15, Ilmenau, Germany, 2015. Uhlig, R. P.: Identification of Material Defects in Metallic Materials Using Lorentz Force Eddy Current Testing, dissertation, Technis-che Universität Ilmenau, Ilmenau, Germany, 2013.
Weise, K.: Advanced Modeling in Lorentz Force Eddy Current Test-ing, dissertation, Technische Universität Ilmenau, Ilmenau, Ger-many, 2016.