Immunization Performance Measurement in a Changing Immunization
Environment
Lance Rodewald, MD*; Edmond Maes, PhD*; John Stevenson, MA*; Bridget Lyons, BS*; Shannon Stokley, MPH*; and Peter Szilagyi, MD, MPH‡
Abstract. Objective. The measurement of perfor-mance in the delivery of recommended vaccinations for children is used frequently as a marker for quality of care and as an outcome for studies of interventions to improve immunization coverage levels. The critical el-ement of immunization performance measurel-ement is the determination of immunization status. This method-ologic review 1) discusses immunization status as a measure of quality of primary care for children, 2) de-scribes immunization status measures used in immuni-zation intervention studies, and 3) examines selected technical issues of immunization status measurement.
Methods and Topics. 1) Description of the charac-teristics of immunization status measurements obtained by a systematic review of studies published between 1980 and 1997 on interventions to raise immunization coverage, and 2) illustration of technical considerations for immunization status measurement using one local database and one national database of immunization histories. Technical issues for immunization status mea-surement include 1) the need to use documented immu-nization histories rather than parental recall to deter-mine immunization status, 2) the need to link records across providers to obtain complete records, 3) the sen-sitivity of immunization status to missing immunization data, and 4) the potential of measures incorporating combinations of immunizations to underestimate the degree of vaccination in a population.
Conclusions. Immunization performance measure-ment has many characteristics of a robust quality of care measure, including high acceptance by primary care providers of routine vaccination, association of immu-nization status with the conduct of other clinical pre-ventive services, agreed-on technical and programmatic standards of care, and legislative requirements for med-ical record documentation. However, it is not without challenges. Careful attention to technical issues has potential to improve immunization delivery health services research.Pediatrics1999;103:889 – 897; immu-nization, vaccination, performance measurement, quality of care, children.
ABBREVIATIONS. VPD, vaccine-preventable disease; VFC, Vaccines for Children program; HEDIS, Healthplan Employer Data and Information Set; UTD, up-to-date; DTP, diphtheria, tetanus, and pertussis; MMR, measles, mumps, and rubella; Hib,
Haemophilus influenzae vaccine; HBV, hepatitis B vaccine; NHIS, National Health Interview Survey.
T
he President’s Advisory Commission onConsumer Protection and Quality in the Health Care Industry stated in 1998 that “the purpose of the health care system must be to con-tinuously reduce the impact and burden of illness, injury, and disability, and to improve the health and functioning of the people of the United States.”1Consistent with this viewpoint,
outcome-oriented goals in child health define the ultimate test for the adequacy of efforts to improve child health care. The numerous disease-related objec-tives in Healthy People 2000 and the proposed Healthy People 2010 provide additional emphasis on outcomes.2
However, serious adverse health outcomes are infrequent events in the general population of chil-dren, making the testing of interventions to im-prove child health difficult and expensive to con-duct when the primary outcome measure is reduction of disease morbidity or mortality. Health services research studies of modest size testing in-novative interventions seldom have adequate power to detect clinically meaningful differences in disease incidence, health status, or morbidity.
Process measures are frequently used as interme-diate measures to overcome limitations in study power to detect differences in disease outcomes. The relative ease of demonstrating improvement in the process of health care (compared with out-comes) provides substantial advantage, albeit with the need to infer indirectly from process to out-come. For immunizations, this inference is on solid ground because the process of vaccination is highly associated with both protection from vaccine-pre-ventable disease (VPD) and reduction of VPD rates.3
This strong link between process and outcome makes immunization status one of the most com-monly used measures of child health status and the adequacy of preventive care.
Despite the existence of an accepted immuniza-tion schedule, no standardized measures exist for program evaluation or health services research re-lated to childhood immunization. Several factors account for variation in immunization status
mea-From the *National Immunization Program, Centers for Disease Control and Prevention, Atlanta, Georgia; and the ‡Department of Pediatrics, University of Rochester, Rochester, New York.
This work was presented in part at the Primary Care Research Methods and Statistics Conference; December 5, 1998; San Antonio, TX. Received for publication Dec 31, 1998; accepted Jan 5, 1999.
Address correspondence to Lance Rodewald, MD, National Immuniza-tion Program, Mailstop E-52, Centers for Disease Control and PrevenImmuniza-tion, 1600 Clifton Rd, NE, Atlanta, GA 30333.
sures, such as 1) the vaccines included in combi-nation measures, 2) the timing and definitions of “due” and “overdue” for vaccination, 3) the age or age range used to calculate immunization status, and 4) the sources and validation of immunization histories. This variation makes selection of immu-nization status measures for studies difficult and complicates interpretation of study results and comparison across studies.
The purpose of this methodology article is to 1) discuss immunization status as a measure of qual-ity of primary care for children, 2) describe immu-nization status measures used in studies testing the impact of interventions to raise childhood vaccina-tion coverage levels, and 3) examine key technical issues of immunization status measurement.
IMMUNIZATION STATUS AND QUALITY OF CARE Routine vaccination is the most cost-effective clinical preventive service for children, saving both lives and dollars.4Universal childhood vaccination
has wide acceptance among primary care provid-ers, with an accepted technical standard of care that is endorsed by the three major recommending groups: the federal Advisory Committee on Immu-nization Practices, the American Academy of Pedi-atrics’ Committee on Infectious Diseases, and the American Academy of Family Physicians. This standard is the routine immunization schedule, and it has been harmonized among the three rec-ommending groups since 1994, thus reducing con-fusion about the acceptable timing of vaccinations. Because of the licensing of new vaccines and new scientific information about vaccine safety and ef-ficacy, the harmonized schedule changes fre-quently and is updated formally once per year. Changes in the schedule challenge researchers by making the standard a moving target.
An additional set of standards of care exists for the delivery of childhood vaccination: The Stan-dards for Pediatric Immunization Practices.5These
standards also are endorsed by the major provider groups; they describe recommended practices for delivery of vaccinations, including vaccinating at all visit types, reducing cost barriers, operating re-call and reminder systems, routine assessment of coverage, and handling vaccines properly.
Because these standards are detailed and pre-scriptive, they make useful benchmarks against which to measure the quality of services delivered. Additionally, federal law requires documentation in the provider’s medical chart of vaccines in the National Childhood Vaccine Injury Compensation Program (which includes all the vaccines recom-mended for universal use), and the Vaccines for Children program (VFC) requires medical record documentation of VFC eligibility status. These re-porting requirements have meant that vaccines de-livered by a provider generally can be found by medical chart review. Providers frequently have a designated page in their medical charts to docu-ment the vaccines and their dates of administra-tion, additionally simplifying chart review.
The combination of agreed-on standards and
leg-islatively required documentation ensures the fea-sibility of measuring the adherence to these quality standards. Furthermore, primary care providers generally regard deviation from the quality stan-dards as unsatisfactory care. These attributes make performance measurement of immunizations pop-ular among those with a need to assess quality of care. For example, immunization performance is a prominent part of the effectiveness of care portion of the Healthplan Employer Data and Information Set (HEDIS) that measures the quality of service delivery for managed care organizations;6almost all
the Child Health Insurance Program plans will use immunization as a quality of care measure; and national-level vaccination coverage is a widely cited Healthy People 2000 objective.
Although immunization is important by itself, a number of studies have shown an association of the adequacy of immunization delivery with the ade-quacy of the delivery of other routinely recom-mended clinical preventive services and with ad-herence to the number of recommended health supervision visits by children. Compared with chil-dren who are up to date (UTD) on vaccinations, underimmunized children have much lower rates of screening for lead exposure and anemia and have fewer health supervision visits.7–10 Furthermore,
children not UTD with immunizations have higher rates of anemia or lead-exposure than completely vaccinated children.11Interventions that cause
un-derimmunized children to go to their primary care provider improve not only immunization coverage but also the performance of other clinical preven-tive services.12–14
In summary, agreed-on standards for a service that is recommended and widely accepted for uni-versal implementation and associated with the con-duct of other health supervision activities make immunization performance measurement a robust indicator of quality of preventive care. To fulfill the promise of a high-quality measure, however, the use of immunization measurement and the techni-cal aspects of measurement deserve close attention.
IMMUNIZATION STATUS MEASUREMENT: 1980 –1997
To describe the characteristics of immunization measures used in the childhood health services research literature, we conducted a systematic re-view of literature on studies of interventions to raise immunization coverage levels. We reviewed studies that were accepted by the Task Force for Community Preventive Services to make recom-mendations about techniques to raise community immunization coverage levels. The Task Force, an independent advisory body to the Department of Health and Human Services, makes recommenda-tions on methods to improve community health to public health officials, providers, managed care or-ganizations, and other policy- and decision-mak-ers.15
En-glish language and conducted in a developed coun-try, testing an intervention to raise coverage levels, and having a control group. The Task Force rated each study on the fit between the design and the hypothesis and on the adequacy of the study exe-cution.16 The studies having the least appropriate
design for the hypothesis and the weakest execu-tion were excluded from consideraexecu-tion. For this article, we restricted further our analysis to the 48 studies concerning children that had a primary out-come measure of immunization coverage.14,17– 63By
using the Task Force-accepted studies, we were able to review good-quality studies, but we were limited in our review to intervention studies. Stud-ies on barriers to immunization, for example, were not included in the review, although most of them include an assessment of immunization status.
Each study was reviewed to determine 1) the date the study was conducted; 2) the vaccines assessed; 3) which combination(s) of vaccines was reported; 4) whether individual vaccination status was re-ported; 5) the actual measure used (eg, age-appro-priate, UTD, of a combination); 6) whether a “grace period” was allowed before counting a child de-layed in immunizations; 7) whether minimum spacing intervals were used to determine which doses are valid (eg, explicitly not counting a fourth diphtheria, tetanus, and pertussis (DTP) if given,6 months after the third DTP); 8) whether minimum age criteria were used to determine which doses are valid (eg, not counting measles, mumps, and ru-bella (MMR) given before first birthday); 9) the age range of the study participants; 10) the data source (parent recall, provider records, immunization reg-istry, shot cards, school or day care records, or billing files); and 11) whether parents were con-tacted to identify the sources of immunization for their child.
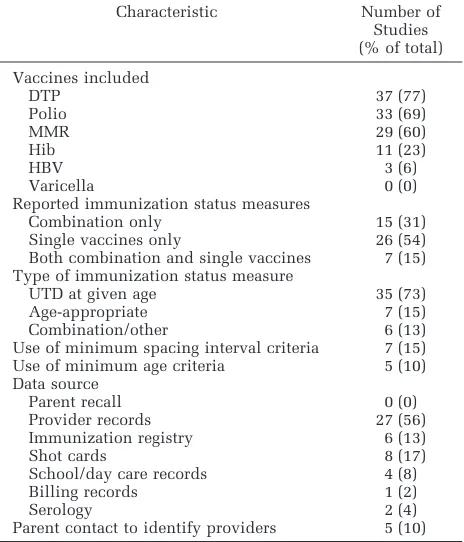
Table 1 shows the characteristics of the studies reviewed. None of the studies used parental recall as the source of immunization data, whereas most relied on provider records or immunization regis-tries without parent contact to identify all immu-nization providers. The vast majority of studies used UTD immunization status measures rather than age-appropriate vaccination status. Few stud-ies used minimum spacing intervals or minimum age criteria to determine whether to count admin-istered doses as valid.
New vaccines tended to be excluded from com-bination measures. There were 24 studies con-ducted after 1990 that measured coverage of at least two vaccines. Of those studies, 11 (46%) included
Haemophilus influenzae(Hib) vaccine coverage in the measured outcomes. There were 12 studies con-ducted after 1992 that included at least two vac-cines, and only 2 (17%) included hepatitis B (HBV) vaccine. No studies included varicella vaccine. Combined-series measures were used frequently, with a total of 24 different combination series mea-sures used. The most common combined series was the four DTP, three polio, and one MMR tion series (eight studies), followed by a
combina-tion with three DTP and two polio vaccinacombina-tions (six studies).
KEY TECHNICAL ISSUES
This section describes measurement issues to consider when planning an investigation. Measure-ment issues include the immunization status func-tion, data sources, the relationship between miss-ing data and misclassification, and the use of combination series measures. An important consid-eration that is beyond the scope of the article is sample frame for provider-based immunization performance measurement. Darden and Taylor have reviewed this topic recently.64,65
Characteristics of Immunization Status Measures The two most commonly used immunization sta-tus measures are “age-appropriate” and “up-to-date.” Age-appropriate is applied to a population or cohort of children that varies in age, and the mea-sure indicates the proportion of children who have adequate vaccination for their age.66UTD generally
indicates the proportion of children in a population with adequate immunizations at a certain age threshold or age range. With the current emphasis on the Healthy People 2000 objectives, UTD usu-ally means the proportion UTD at 24 months of age. UTD measures also can have a range of ages rather than an age threshold at which immunization sta-tus is calculated. For example, the National Immu-nization Survey and the National Health Interview Survey (NHIS) report the immunization status of children 19 to 35 months of age as the proportion UTD at the time of the interview.
Immunization status measures use an
immuniza-TABLE 1. Characteristics of Immunization Status Measures in 48 Controlled Intervention Trials Published Between 1980 and 1997
Characteristic Number of
Studies (% of total)
Vaccines included
DTP 37 (77)
Polio 33 (69)
MMR 29 (60)
Hib 11 (23)
HBV 3 (6)
Varicella 0 (0)
Reported immunization status measures
Combination only 15 (31)
Single vaccines only 26 (54)
Both combination and single vaccines 7 (15) Type of immunization status measure
UTD at given age 35 (73)
Age-appropriate 7 (15)
Combination/other 6 (13)
Use of minimum spacing interval criteria 7 (15)
Use of minimum age criteria 5 (10)
Data source
Parent recall 0 (0)
Provider records 27 (56)
Immunization registry 6 (13)
Shot cards 8 (17)
School/day care records 4 (8)
Billing records 1 (2)
Serology 2 (4)
tion status function that determines the immuniza-tion status of an individual child. This funcimmuniza-tion relies on an immunization schedule, an individu-al’s immunization history, an age for calculation, and a “grace period” (during which a child may be vaccine-eligible but not “past due”) to determine the individual’s immunization status. The immu-nization schedule is a vector of pairs of vaccina-tions and their recommended ages of administra-tion; the immunizationrecordis a vector of pairs of vaccinations and the actual ages of administration; and the immunization statususually is a categori-cal variable— either UTD or not UTD at the given age, using the given grace period. Many studies use combinations of vaccines in the schedule when calculating immunization status. Because underim-munization is the condition being measured, it sometimes is convenient to use the inverse of im-munization status, the underimim-munization status, as the primary measure (Fig 1).
Depending on the purpose for which the status function is used, the schedule can be more complex than a simple vector of vaccination and age pairs. For example, most of the vaccine recommendations have a minimum spacing requirement that, if vio-lated, invalidates at least one of the doses admin-istered. These spacing requirements may have clin-ical importance, but comparisons between study groups frequently ignore them. For example, Table 1 shows that only 15% of the intervention studies used minimum spacing intervals to invalidate ad-ministered doses. In terms of coverage estimates, however, the consequence of ignoring or using the minimum spacing intervals or minimum age rec-ommendations may be substantial. Vivier and colleagues demonstrated a 27 percentage point dif-ference (50% to 77%) in UTD combined-series cov-erage when minimum spacing intervals and mini-mum age criteria were adhered to, compared with a calculation that ignored interval and age criteria.67
An additional complication is that the harmo-nized immunization schedule recommends age ranges for many vaccines, rather than specific ages. Thus, acceptable practice can vary from provider to provider. The Advisory Committee on Immuniza-tion Practices is currently studying methods to standardize immunization status algorithms. The Centers for Disease Control and Prevention has de-veloped a standardized methodology and computer program to determine the immunization coverage level of a clinic. This Clinic Assessment Software Application is available at http://www.cdc.gov/
nip/casa. This application has provided the basis for several published studies,61,21 and is the
stan-dard method for assessing health department clin-ics.
When immunization status is summarized for a population, age-appropriate and UTD vaccination status have different characteristics. Figure 2 shows the nonlinear relationship between age and age-appropriate immunization status for a hypothetic population. Age-appropriate measures can have more variation in the ages of the study participants than can UTD measures. For example, age-appro-priate coverage has been applied to the lifetime immunization history of school enterers68 and
emergency department patients.69In contrast, UTD
measures tend to have narrow age ranges and are best suited to cross-sectional studies.
Because of the emphasis on reducing the delay in immunization, some studies have used a direct measure of days of delay. Days of delay relates closely to age-appropriate vaccination coverage be-cause it uses age-appropriate status in the calcula-tion. Using the immunization status function, the days of delay in immunization is the sum of the number of days during the study period in which the subject is not UTD (Fig 3). This number can be divided by the subject’s age or by the duration of an intervention to calculate a proportion indicating the relative time spent unprotected by vaccination. However, as a proportion, days of delay is difficult to interpret. Comparison across studies also is dif-ficult using days of delay, but the measure has some intuitive appeal because it represents the quantity of time spent incompletely protected from VPD.
Data Sources: Parents, Charts, and Hand-held Records One might assume that the gold standard for immunization status would be serologic tests of immunity, but serology falls short on a number of counts. First, it may not distinguish between dis-ease and vaccination. Second, it cannot determine the number of doses of a vaccine if the number is
.1. Third, serology may be negative where the antibody is no longer present despite adequate im-munization. Fourth, no serologic test for immunity exists for some vaccines, such as pertussis.
The current gold standard for measuring the pro-cess of vaccination uses parent-linked and provid-er-validated immunization status. Parent-linked
Fig 1. Immunization status function for an individual, showing the relation between the schedule, the administration age for vaccines, and immunization status.
means asking parents to name all immunization providers for their child; provider-validated means obtaining the immunization records for each child and combining them into a single record. The CDC’s National Immunization Survey70and the
im-munization component for 19- to 35-month-old children in the NHIS71 currently use this method.
The major disadvantage of the method is that the researcher must obtain information from at least two sources (the parent and the provider), a process more time-consuming and expensive than simple chart review.
Multiple studies document the inaccuracy of par-ents as the sole source of immunization histo-ries.72–75For example, 78% of parents of
underim-munized children in the 1994 NHIS immunization supplement incorrectly thought that their child was UTD.76In the same survey, half of the children
whose parents said received no vaccinations actu-ally had complete immunizations. The complex and ever-changing immunization schedule most likely explains much of the inaccuracy of parental recall. It is difficult for providers to keep up with the schedule, even more so for parents.
The single provider record check method lies intermediate between parental recall of vaccination and a parent-linked, provider-verified measure. The validity of this method depends on the fre-quency and reliability with which medical records include immunizations administered in other sites, such as health department clinics or other primary care providers. Because the proportion of vaccina-tions given at health department clinics varies geo-graphically, by specialty type,77 and by insurance
type, the accuracy of this method depends on fac-tors specific to any given study and must be deter-mined individually.
To illustrate the impact of scattered immuniza-tion records, we analyzed the 1995 NHIS Provider Record Check Study, comparing the number and type of vaccinations recorded in the chart of the most recent immunization provider and the first immunization provider with the number and type of vaccinations recorded by all providers for chil-dren having more than one immunization provider. Immunization histories of children 19 to 35 months of age collected during the 1995 NHIS were verified
by the providers reported to have administered the child’s vaccines. Up to three providers were con-tacted per child. The providers were asked to report all immunizations in their records for the child surveyed, regardless of whether they or another provider administered the vaccinations. We stricted our analysis to children whose parents re-ported more than one immunization provider.
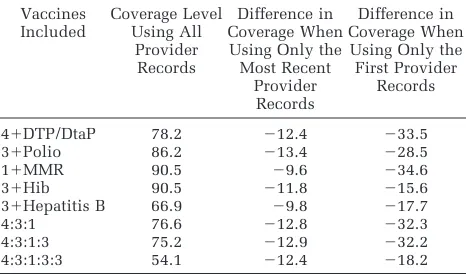
Of the 1352 children 19 to 35 months of age in the 1995 NHIS who had provider-verified immuni-zation histories, a total of 304 (22%) had more than one provider. Table 2 shows impact of missing immunization histories. Depending on the specific vaccine, the immunization coverage levels deter-mined by using only immunizations recorded by the most recent provider were from 9.6 to 13.4 percentage points lower than the coverage levels determined by using all provider-verified immuni-zations. This discrepancy is similar in magnitude to the effect sizes of many impact studies.16
Fur-thermore, this measure of impact on record scatter-ing is a conservative estimate because the re-searcher conducting medical chart reviews may not know whether the provider is the most recent im-munization provider. If the first imim-munization pro-vider record is used, the discrepancy between true coverage and measured coverage is as high as 35 percentage points. Yawn and colleagues showed similar discrepancies attributable to record scatter-ing.78
Data Completeness and Misclassification Routine immunization covers a series of events rather than an individual event. For example, rec-ommendations include a minimum of 15 vaccina-tions during the first 2 years of life. If one uses a combination series-complete measure of immuni-zation status, a child missing at least one vaccina-tion is considered not UTD—an extreme dichoto-mization of immunization status that is seen commonly in the literature. Because missing data are indistinguishable from missing vaccinations, a single missing datum will misclassify an UTD child
TABLE 2. Differences in Immunization Coverage Levels Measured by Using Immunization Histories From the First Pro-vider and the Most Recent ProPro-vider Compared With Histories Combined Across All Providers
Vaccines Included
Coverage Level Using All
Provider Records
Difference in Coverage When Using Only the Most Recent
Provider Records
Difference in Coverage When Using Only the First Provider
Records
41DTP/DtaP 78.2 212.4 233.5
31Polio 86.2 213.4 228.5
11MMR 90.5 29.6 234.6
31Hib 90.5 211.8 215.6
31Hepatitis B 66.9 29.8 217.7
4:3:1 76.6 212.8 232.3
4:3:1:3 75.2 212.9 232.2
4:3:1:3:3 54.1 212.4 218.2
Analysis was restricted to children 19 to 35 months of age with more than one provider (n5304) in the 1995 National Health Interview Survey Provider Record Check Study.
All numbers shown are absolute percentage points.
as not UTD. The direction of the error introduced by missing data is to decrease measured coverage below true coverage. The magnitude of the error is much greater than generally appreciated.
To illustrate the biasing effect of missing data on coverage estimates, one can consider a population of 2-year-old children completely UTD. If the data-set includes all immunizations with no missing data, the measured coverage and the true coverage would both equal 100%. However, if missing im-munizations are independently and randomly dis-tributed throughout the dataset, then the misclassi-fication rate is equal to 1 minus the data completeness rate raised to the number of vaccina-tions required for UTD status. For a 15-vaccination series, when 1% of the vaccinations are missing (ie, the data are 99% complete), the proportion of children UTD who are misclassified as not UTD is (12.9915)514%. Thus, only 1% missing data will
misclassify 14% of UTD children. If 2% of the data are missing, 26% of the population will be misclas-sified; 3% missing data cause 37% to be misclassi-fied; 5% missing data cause greater than half (54%) of the UTD population to be misclassified. If miss-ing data are assumed to cluster around vaccination visits, the exponent becomes 7 (for the seven vac-cination visits) instead of 15, but the resulting re-lationship still shows a dramatic rise in misclassi-fication with missing data (1% missing data cause
7% to be misclassified; 2% 3 13%; 5% 3 30%;
10%352%).
This sensitivity of series-complete coverage to missing data can jeopardize the validity of conclu-sions drawn from comparisons of study groups that differ only modestly in terms of missing vaccine information. For example, consider the situation in which one arm of an intervention trial involves tracking immunization status (eg, a test of a recall system) and the control arm does not track immu-nizations. The data collection might bias the out-comes if the intervention arm documents in the medical record vaccinations given elsewhere whereas the control arm does not. The exponential relation between misclassification and missing data then would magnify the introduced bias. This particular problem arises because many immuniza-tion intervenimmuniza-tions involve some method of gather-ing, trackgather-ing, or assessing vaccination records.
Measures of Complete Combination Series Versus Individual Vaccine Measures
Many intervention studies report vaccination coverage as combination series-complete measures that combine into a single status measure all the vaccines for which the study subject was eligible. Because the epidemiology for each disease in the combination measure differs, the appropriate dis-ease prevention strategies must be tailored to bal-ance effectiveness with cost, feasibility, and safety. Ideally, immunization status measures should align with currently accepted disease prevention strategies (eg, eradication of polio; elimination of measles, rubella, and invasiveHaemophilus influ-enzae disease; and control of mumps, pertussis,
diphtheria, tetanus, varicella, HBV, and rotavirus). However, when immunization coverage is reported as a combination series measure, the coverage of specific vaccines cannot be determined, which in turn creates a problem in the translation of the process of vaccination into the outcome of protec-tion from VPD. Single-vaccine measures can be linked more easily to their corresponding diseases, the strategies for their prevention, and their inci-dence goals for the year 2010 than can combination measures.
The two primary problems with combined-series measures are 1) the historical relegation of new vaccines to the status of “second-class citizens” because of failure to become part of generally ac-cepted series, and 2) the nearly complete uncou-pling of disease prevention strategies and goals from series measures that results from expansion of small series, such as the 4:3:1 series into more comprehensive series, such as the 4:3:1:3:3:1 series. This section presents the pros and cons of using combined-series measures instead of single-vac-cine measures.
Combined-series measures tend to exclude newer vaccines. Hib vaccine was recommended for routine administration more than a decade ago; however, less than half of the studies in the past decade that use combination-series measures in-cluded Hib vaccine. Failure of the commonly used combined series to include HBV and varicella vac-cines may have had the effect of taking the pressure off evaluating their individual performances. With such low incidences of the diseases covered by the 4:3:1 series, the new vaccines, such as varicella and rotavirus, likely provide the most important oppor-tunities for reducing the burden of VPD.
The combined-series measure can be misleading, because the vaccine with the lowest coverage dom-inates the results, primarily reflecting the lowest coverage of a single vaccine in the series. For ex-ample, the current 78% coverage rate for the 4:3:1 series primarily represents the coverage level for the fourth dose of DTaP (81%), the vaccine with the lowest coverage in the series. Coverage for each of the other doses is 90% or greater. Adding varicella coverage to the series today would lower the cov-erage rate for the combined series from 78% to
,26%.79 The misleading nature of long series of
combination measures will increase with the intro-duction of newly recommended vaccines into the series.
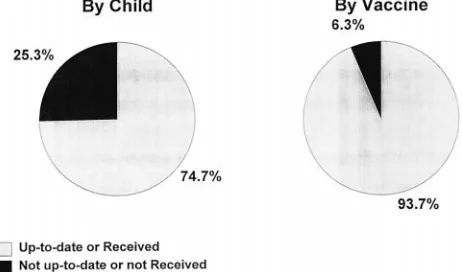
Combined-series coverage levels do not corre-spond well with degree of population protection from VPD. The combined-series measure ignores the fact that most underimmunized children have received most of their vaccines. Combination mea-sures count a child as underimmunized whether he or she is missing one dose of one vaccine or all vaccines. To illustrate this effect, we reanalyzed a set of immunization histories obtained for the con-trol group of an intervention trial described else-where.14Although the combination-series complete
recom-mended vaccines actually were administered to the subjects (Fig 4). When restricting the analysis to children not UTD for the combination of vaccines, one can identify the vaccines administered to chil-dren who were vaccinated incompletely. Greater than half of the not UTD children had received MMR vaccination, greater than half had received three or four DTP vaccines, and greater than half had received three HBV vaccines. Only 6.3% of the children who were not UTD for the combination series (1.6% of the study population) had received no vaccination at all.
Combination measures do not pinpoint problems with specific vaccines and therefore fail to identify specific prevention opportunities. For example, the quickest way to improve the 4:3:1 coverage might be to improve DTaP4 coverage among children missing only the fourth (and least important) dose of DTaP. However, better prevention opportunities may be found among severely underimmunized vulnerable populations at risk for many VPD or with underutilized new vaccines.
The combined-series measure may not be valid for historical or cross-national comparisons. The current combined-series measures includes polio vaccination, which will be discontinued after cer-tifying the world as polio-free. Thus, the 4:3:1 mea-sure will become a “4:1” meamea-sure in a few years, and after measles eradication it will be a “4” mea-sure. Other developed countries report vaccination coverage by individual vaccine.
Combination measures, however, have certain advantages, primarily the convenience and sim-plicity of a single-number interpretation of vacci-nation coverage that is familiar to researchers, pro-viders, nonhealth care professionals, and policy-makers. For example, HEDIS uses a series measure, rather than individual vaccines. This use of a com-bined measure also reflects the clinical interpreta-tion that would be used in a recall system. Under-immunized children normally would be recalled if they needed any recommended vaccines.
The primary disadvantage of a set of individual vaccine measures is the confusion resulting from
too much information. Coverage rates of generally accepted vaccines are closely correlated, and re-porting many similar numbers measuring similar processes may confuse the consumer of the infor-mation. It is encouraging, however, that greater than half of the intervention studies reviewed re-ported single-vaccine coverage as an outcome.
CONCLUSIONS
Child health services research commonly uses immunization performance as a measure of quality of care. Although it has many qualities of a robust measure, such as high acceptability of vaccination by primary care providers, association of immuni-zation status with the conduct of other clinical preventive services, agreed-on technical and pro-grammatic standards of care, and legislative re-quirements for medical record documentation, its use provides challenges. Key technical issues in-clude using only provider-validated or hand-held immunization records rather than parental recall, linking records across providers in settings with multiple providers per child, and using single-vac-cine measures when possible. The most difficult challenge for immunization performance measure-ment is the exponential relationship between miss-ing immunization data and misclassification of im-munization status. Because some study designs can introduce ascertainment bias, the tendency of se-ries measures to magnify the impact of missing immunization data will, in turn, magnify the ascer-tainment bias. Careful attention to technical issues can improve the accuracy of immunization health services research and evaluations.
Implications
The gold standard for immunization status mea-surement—the parent-linked, provider-validated measure—is expensive. It corresponds most closely to true vaccination coverage level because it is the measure least susceptible to missing data caused by record-scattering or incomplete records. Selection of immunization status measures has to be individ-ualized to the purpose and design of the study and to the availability of resources. Measured immuni-zation coverage levels in studies set in communi-ties where children receive immunizations from multiple sources of care must be interpreted cau-tiously if linked records are not used.
An essential function of immunization registries is their linkage of records from multiple providers into a single record for each child. With this capa-bility, they will become the new gold standard measure of immunization status. A major benefit of registries is their ability to provide a complete im-munization record that can be used for clinical decision-making. Widespread use of immunization registries will enhance greatly the ability to con-duct studies of barriers to timely vaccination, inter-ventions to improve coverage, vaccine safety, and vaccine efficacy.
Fig 4. Vaccination performance for a cohort of children (n5
REFERENCES
1. The President’s Advisory Commission on Consumer Protection and Quality in the Health Care Industry.Quality First: Better Health Care for All Americans. Washington, DC: US Government Printing Office; 1998
2. US Department of Health and Human Services, Office of Public Health and Science.Healthy People 2010 Objectives: Draft for Public Comment. Washington, DC: US Government Printing Office; 1998. Also at http://web.health.gov/healthypeople/2010Draft
3. US Preventive Services Task Force.The Guide to Clinical Preventive Services. 2nd ed. Alexandria, VA: International Medical Publi-cations; 1997
4. Miller MA, Hinman AR. Cost-benefit and cost-effectiveness analysis of vaccine policy. In: Plotkin S, Orenstein W. Vaccines. 3rd ed. Philadelphia, PA: WB Saunders Co; 1999
5. National Vaccine Advisory Committee. Standards for pediatric im-munization practices.JAMA.1993;269:1817–1822
6. National Committee for Quality Assurance.HEDIS 3.0 —The Health Plan Employer Data and Information Set. II. Technical Specifica-tions. Washington, DC: National Committee for Quality Assurance; 1997
7. Fairbrother G, Friedman S, DuMont K, Lobach K. Markers for primary care: missed opportunities to immunize and screen for lead and tuberculosis by private physicians serving large numbers of inner-city Medicaid-eligible children.Pediatrics.1996;97:785–790 8. Bordley W, Margolis P. The delivery of immunizations and other
preventive services in private practices.Pediatrics.1996;97:467– 473 9. Dietz V, Lewin M, Zell E, Rodewald L. Evaluation of failure to follow vaccination recommendations as a marker for failure to follow other health recommendations.Pediatr Infect Dis J.1997;16:1157–1161 10. Rodewald L, Szilagyi P, Shiuh T, Humiston S, LeBaron C, Hall C. Is
underimmunization a marker for insufficient utilization of preven-tive and primary care?Arch Pediatr Adolesc Med.1995;149:393–397 11. Adams W, Geva J, Coffman J, Palfrey S. Anemia and elevated lead levels in underimmunized inner-city children.Pediatrics.1998;101: 1–5
12. Fairbrother G, Friedman S, Hanson K, Butts G. Effect of the Vaccines for Children program on inner-city neighborhood physicians.Arch Pediatr Adolesc Med.1997;151:1229 –1235
13. Shefer A, Fritchley J, Stevenson J. Improvement in immunization coverage and other health outcomes following implementation of immunization activities in WIC, Milwaukee, 1995–97. Presented at the 32nd National Immunization Conference; July 22, 1998; Atlanta, GA
14. Rodewald LE, Szilagyi PG, Humiston SG, Barth R, Kraus R, Raubertas RF. A randomized study of tracking with outreach and provider prompting to improve immunization coverage and primary care.
Pediatrics.1999;103:31–38
15. Pappaioanou M, Evans C. Development of theGuide to Community Preventive Services: A US Public Health Service initiative.J Public Health Manage Practice.1998;4:48 –54. See also http://web.health. gov/communityguide
16. Shefer A, Briss P, Rodewald L. Improving immunization coverage rates: an evidence-based review of the literature.Epidemiol Rev. In press
17. Cutts FT, Orenstein WA, Bernier RH. Causes of low preschool immu-nization coverage in the United States.Ann Rev of Public Health.
1992;13:385–398
18. Paunio M, Virtanen M, Peltola H, et al. Increase of vaccination cov-erage by mass media and individual approach: intensified measles, mumps, and rubella prevention program in Finland.Am J Epidemiol.
1991;133:1152–1160
19. Hand JS, Anderson D, Feffer D, Day C. A successful school immuni-zation program— or not?J School Health.1980;50:50
20. Oeffinger KC, Roaten SP, Hitchcock MA, Oeffinger PK. The effect of patient education on pediatric immunization rates. J Fam Pract.
1992;35:288 –293
21. Pierce C, Goldstein M, Suozzi K, Gallaher M, Dietz V, Stevenson J. The impact of the standards for pediatric immunization practices on vaccination coverage levels.JAMA.1996;276:626 – 630
22. Waterman SH, Hill LL, Robyn B, et al. A model immunization dem-onstration for preschoolers in an inner-city barrio, San Diego, Cali-fornia, 1992–1994.Am J Prev Med.1996;12:8 –13. Supplement 23. Alemi F, Alemagno SA, Goldhagen J, et al. Computer reminders
improve on-time immunization rates. Med Care. 1996;34: OS45–OS51. Supplement
24. Alto WA, Fury D, Condo A, Doran M, Aduddell M. Improving the
immunization coverage of children less than 7 years old in a family practice residency.J Am Board Fam Pract.1994;7:472– 477 25. Bell JC, Whitehead P, Chey T, Smith W, Capon AG, Jalaludin B. The
epidemiology of incomplete childhood immunization: an analysis of reported immunization status in outer western Sydney.J Paediatr Child Health.1993;29:384 –388
26. Campbell JR, Szilagyi PG, Rodewald LE, Doane C, Roughmann KJ. Patient-specific reminder letters and pediatric well-child-care show rates.Clin Pediatr.1994;1994:268 –272
27. Ferson MJ, Fitzsimmons G, Christie D, Woollett H. School health nurse interventions to increase immunisation uptake in school en-trants.Public Health.1995;109:25–29
28. Lieu TA, Black SB, Ray P, et al. Computer-generated recall letters for underimmunized children: how cost-effective?Pediatr Infect Dis J.
1997;16:28 –33
29. Stehr-Green PA, Dini EF, Lindegren ML, Patriarca PA. Evaluation of telephoned computer-generated reminders to improve immunization coverage at inner-city clinics.Public Health Rep.1993;108:426 – 430 30. Tollestrup K, Hubbard BB. Evaluation of a follow-up system in a county health department’s immunization clinic.Am J Prev Med.
1991;7:24 –28
31. Yokley JM, Glenwick DS. Increasing the immunization of preschool children: an evaluation of applied community interventions.J Appl Behav Anal.1984;17:313–325
32. Young SA, Halpin TJ, Johnson DA, Irvin JJ, Marks JS. Effectiveness of a mailed reminder on the immunization levels of infants at high risk of failure to complete immunizations.Am J Public Health.1980;70: 422– 424
33. Combs SP, Walter EB, Drucker RP, Clements DA. Removing a major barrier to universal hepatitis B immunization in infants.Arch Pediatr Adolesc Med.1996;150:112–114
34. Lurie N, Manning WG, Peterson C, Goldberg GA, Phelps CA, Lillard L. Preventive care: do we practice what we preach? Am J Public Health.1987;77:801– 804
35. Rodewald LE, Szilagyi PG, Holl J, Shone LR, Zwanziger J, Raubertas RF. Health insurance for low-income, working families: impact on the delivery of immunizations to preschool children.Arch Pediatr Adolesc Med.1997;151:798 – 803
36. Taylor JA, Darden PM, Slora E, Hasemeier CM, Asmussen L, Wasser-man R. The influence of provider behavior, parental characteristics, and a public policy initiative on the immunization status of children followed by private pediatricians: a study from pediatric research in office settings.Pediatrics.1997;99:209 –215
37. Zimmerman RK, Janosky JE. Immunization barriers in Minnesota private practices: the influence of economics and training on vaccine timing.Fam Pract Res J.1993;13:213–224
38. Szilagyi PG, Rodewald LE, Humiston SG, et al. Effect of 2 urban emergency department immunization programs on childhood immu-nization rates.Arch Pediatr Adolesc Med.1997;151:999 –1006 39. Crittenden P, Rao M. The immunisation coordinator: improving
up-take of childhood immunisation.Commun Dis Rep CDR Rev, 1994; 7:R79 –R81
40. Moore BJ, Morris DW, Burton B, Kilcrease DT. Measuring effective-ness of service aides in infant immunization surveillance program in North Central Texas.Am J Public Health.1981;71:634 – 636 41. Rosenberg Z, Findley S, McPhillips S, Penachio M, Silver P.
Com-munity-based strategies for immunizing the “hard-to-reach” child: the New York State immunization and primary health care initiative.
Am J Prev Med.1995;11:14 –20. Supplement
42. While AE. Health visitor contribution to pre-school child prophy-laxis.Public Health.1987;101:229 –232
43. Birkhead GS, LeBaron CW, Parsons P, et al. The immunization of children enrolled in the Special Supplemental Food Program for Women, Infants, and Children (WIC). The impact of different strate-gies.JAMA. 1995;274:312–316
44. Wood D, Halfon N, Donald-Sherbourne C, et al. Increasing immuni-zation rates among inner-city, African American children. JAMA.
1998;279:29 –34
45. Golden RE. Evaluation of three immunization interventions among families participating in the special supplemental nutrition program for women, infants, and children in South Central and South East Los Angeles. UCLA; 1997; p 1. Dissertation
46. O’Mara LM, Isaacs S. Evaluation of registered nurses follow-up on the reported immunization status of children attending child care cen-tres.Can J Public Health.1993;2:124 –127
47. Unti LM, Coyle KK, Woodruff BA, Boyer-Chuanroong LB. Incentives and motivators in school-based hepatitis B vaccination programs.
48. Rodewald LE, Szilagyi PG, Humiston SG. Effect of emergency depart-ment immunizations on immunization rates and subsequent primary care visits.Arch Pediatr Adolesc Med.1996;150:1271–1276 49. Carlson JA, Lewis CA. Effect of the immunization program in Ontario
schools.Can Med Assoc J.1985;133:215–216
50. Nelson DB, Layde MM, Chatton TB. Rubella susceptibility in inner-city adolescents: the effect of a school immunization law.Am J Public Health. 1982;72:710 –713
51. Robbins KB, Brandling-Bennett D, Hinman AR. Low measles incidence: association with enforcement of school immunization laws.Am J Public Health. 1981;71:270 –274
52. Scheiber M, Halfon N. Immunizing California’s children. Effects of current policies on immunization levels. West J Med. 1990;153: 400 – 405
53. Schulte EE, Birkhead GS, Kondracki SF, Morse DL. Patterns of Hae-mophilus influenzae type b invasive disease in New York State, 1987 to 1991: the role of vaccination requirements for day-care attendance.
Pediatrics.1994;94:1014 –1016
54. van Loon FP, Holmes SJ, Sirotkin BI, et al. Mumps surveillance— United States, 1988 –1993.MMWR. CDC Surveillance Summaries. 1995;44:1–14
55. Bell LM, Pritchard M, Anderko R, Levenson R. A program to immu-nize hospitalized preschool-aged children: evaluation and impact.
Pediatrics.1997;100:192–196
56. Brink SG. Provider reminders. Changing information format to in-crease infant immunizations.Med Care.1989;27:648 – 653 57. Carlin E, Carlson R, Nordin J. Using continuous quality improvement
tools to improve pediatric immunization rates.Jt Comm J Qual Im-prov.1996;22:277–288
58. Harper PG, Murray DM. An organizational strategy to improve ado-lescent measles-mumps-rubella vaccination in a low socioeconomic population. A method to reduce missed opportunities.Arch Fam Med.1994;3:257–262
59. Reading R, Colver A, Openshaw S, Jarvis S. Do interventions that improve immunisation uptake also reduce social inequalities in up-take?Br Med J.1994;308:1142–1144
60. Szilagyi PG, Rodewald LE, Humiston SG, et al. Reducing missed opportunities for immunizations. Easier said than done.Arch Pediatr Adolesc Med.1996;150:1193–1200
61. LeBaron CW, Chaney M, Baughman AL, et al. Impact of measurement and feedback on vaccination coverage in public clinics, 1988 –1994.
JAMA.1997;277:631– 635
62. Christy C, McConnochie KM, Zernik N, Brzoza S. Impact of an algorithm-guided nurse intervention on the use of immunization opportunities.Arch Pediatr Adolesc Med.1997;151:384 –391 63. Schum TR, Nelson DB, Duma MA, Sedmak GV. Increasing rubella
seronegativity despite a compulsory school law.Am J Public Health.
1990;80:66 – 69
64. Darden PM, Taylor JA. Assessing immunization rates in office prac-tice.Pediatr Ann.1998;27:411– 416
65. Darden PM, Taylor JA, Slora EJ, Hasemeier CM, Asmussen L, Recknor JC, Wasserman RC. Methodological issues in determining rates of
childhood immunization in office practice. A study from pediatric research in office settings (PROS).Arch Pediatr Adolesc Med.1996; 150:1027–1031
66. Ross A, Kennedy A, Holt E, Guyer B, Hou W. Initiating the first DTP vaccination age appropriately: a model for understanding vaccination coverage.Pediatrics.1998;101:970 –974
67. Vivier PM, Alario AJ, Simon PR, Flanagan P, O’Haire C, Peter G. The importance of the timing of vaccine administration in the assessment of the immunization status of children enrolled in a hospital based Medicaid managed care practice.Pediatr Res.1998;42. Abstract 697 68. Ehresmann K, White K, Hedberg C, et al. A statewide survey of immunization rates in Minnesota school age children: implications for targeted assessment and prevention strategies.Pediatr Infect Dis J.
1998;17:711–716
69. Rodewald L, Szilagyi P, Humiston S, et al. Is an emergency depart-ment visit a marker for undervaccination and missed vaccination opportunities among children who have access to primary care?
Pediatrics.1993;91:605– 611
70. Centers for Disease Control and Prevention. National, state, and ur-ban area vaccination coverage levels among children aged 19 –35 months—United States, April 1994–March 1995.MMWR.1996;45: 1– 6
71. Peak RR, Cadell DM. Overview of the National Immunization Pro-vider Record Check Study. Proceedings of the Section on Survey Research Methods.Am Stat Assoc.1996:332–334
72. Suarez L, Simpson D, Smith D. Errors and correlates in parental recall of child immunizations: effects on vaccination coverage estimates.
Pediatrics.1997;99:e3
73. Goldstein K, Kviz F, Daum R. Accuracy of immunization histories provided by adults accompanying preschool children to a pediatric emergency department.JAMA.1993;270:2190 –2194
74. Watson M, Feldman K, Sugar N, Sommer C, Thomas E, Lin T. Inad-equate history as a barrier to immunization.Arch Pediatr Adolesc Med.1996;150:135–139
75. Fierman AH, Rosen CM, Legano LA, Lim SW, Mendelsohn AL, Dreyer BP. Immunization status as determined by patients’ hand-held cards vs medical records. Arch Pediatr Adolesc Med. 1996;150: 863– 866
76. Zell E, Peak R, Rodewald L, Ezzati-Rice T. Reliability of vaccination cards and parent-derived information for determining immunization status: lessons from the 1994 National Health Interview Survey (NHIS) Provider Record Check (PRC) study. Presented at the Society for Pediatric Research; May 1997; Washington, DC
77. Maes EF, Rodewald L, Coronado VG, et al. Who is immunizing children in the US: public or private providers? Presented at the Pediatric Academic Societies Meeting; May 1998; New Orleans, LA 78. Yawn B, Edmonson L, Huber L, Poland G, Jacobson R. The impact of a stimulated immunization registry on perceived childhood immu-nization status.Am J Managed Care.1998;4:185–192
1999;103;889
Pediatrics
and Peter Szilagyi
Lance Rodewald, Edmond Maes, John Stevenson, Bridget Lyons, Shannon Stokley
Environment
Immunization Performance Measurement in a Changing Immunization
Services
Updated Information &
http://pediatrics.aappublications.org/content/103/Supplement_1/889
including high resolution figures, can be found at:
References
BIBL
http://pediatrics.aappublications.org/content/103/Supplement_1/889#
This article cites 61 articles, 11 of which you can access for free at:
Subspecialty Collections
sub
http://www.aappublications.org/cgi/collection/vaccine:immunization_ Vaccine/Immunization
following collection(s):
This article, along with others on similar topics, appears in the
Permissions & Licensing
http://www.aappublications.org/site/misc/Permissions.xhtml
in its entirety can be found online at:
Information about reproducing this article in parts (figures, tables) or
Reprints
http://www.aappublications.org/site/misc/reprints.xhtml
1999;103;889
Pediatrics
and Peter Szilagyi
Lance Rodewald, Edmond Maes, John Stevenson, Bridget Lyons, Shannon Stokley
Environment
Immunization Performance Measurement in a Changing Immunization
http://pediatrics.aappublications.org/content/103/Supplement_1/889
located on the World Wide Web at:
The online version of this article, along with updated information and services, is
by the American Academy of Pediatrics. All rights reserved. Print ISSN: 1073-0397.