e-ISSN: 2278-067X, p-ISSN : 2278-800X, www.ijerd.com
Volume 5, Issue 2 (December 2012), PP. 88-94
Data Mining Using Genetic Algorithm (DMUGA)
Pramod Vishwakarma
1, Yogesh Kumar
2, Rajiv Kumar Nath
31,2
M. Tech. (CSE), CET Moradabad, MTU Noida, UP India
3
Dept. of Computer Science, CET Moradabad, UP India.
Abstract:- In this paper the Genetic Algorithm has been used to mine the real world dataset in medical domain. The growth of information has proceeded at an explosive rate in recent years. The size of data available now is beyond the capability of our mind to analyze. Due to the size of the data, it is extremely difficult to draw meaningful conclusions about the data. To overcome the above scenario, data mining technology is introduced. In fact we are busy with data in most fields and not concerned about hidden patterns. To a certain extent, there are not enough qualified human analysts available who are expert at translating all of this data into knowledge and find the interesting patterns. Data Mining is a process that starts with data and ends with previously unknown patterns and knowledge. The Knowledge Discovery in Databases (KDD) process will be used and on the data mining stage the GA is applied in this paper. This series of activities is divided into five steps. The raw data is selected and analysed during the steps to reveal patterns and create new knowledge. The KDD will include several steps including Selection, Pre-processing, Transformation, Data Mining and Interpretation of pattern.
Keywords:- Mass spectrometry, KDD, Data mining, Genetic Algorithm
I.
INTRODUCTION
Databases are valuable treasures. A database not only stores and provides data but also contains hidden precious knowledge, which can be very important. It can be a new law in science, a new insight for curing a disease or a new market trend that can make millions of dollars [1]. Data mining, or knowledge discovery in database, is the automated process of sifting the data to get the gold buried in the database [2]. The database of bioinformatics is also very huge. Basically bioinformatics is the application of computer science and information technology to the field of biology and medicine. It includes area of data mining, image processing, databases and information systems, information and computation theory, algorithms, web technologies, artificial intelligence and soft computing, structural biology, software engineering, modeling and simulation, signal processing, discrete mathematics, statistics etc [3].
Mass spectrometry is actively being used to discover disease-related proteomic patterns in complex mixtures of proteins derived from tissue samples or from easily obtained biological fluids. The potential importance of these clinical applications has made the development of better methods for processing and analyzing the data an active area of research. It is, however, difficult to determine which methods are better without knowing the true biochemical composition of the samples used in the experiments [4]. A mass spectrometer is an instrument that measures the masses of individual molecules that have been converted into ions, i.e., molecules that have been electrically charged. Since molecules are so small, it is not convenient to measure their masses is kilograms, or grams, or pounds. We therefore need a more convenient unit for the mass of individual molecules. This unit of mass is often referred to by chemists and biochemists as the Dalton (Da for short). Bioinformatics research makes many problems necessary that can be cast as machine learning tasks. In classification or regression, the task is to predict the outcome associated with a particular individual given a feature vector describing that individual; in clustering, individuals are grouped together because they share certain properties; and in feature selection, the task is to select those features that are important in predicting the outcome for an individual.
Mass spectrometry (MS) is a logical technique used to measure the mass to charge ratio of charged particles. The masses of particles are determines by MS which is used to find out the elemental composition of a sample or molecule. The chemical structures of molecules are also explained by the masses of particles. MS works as following - it ionizes chemical compounds to generate charged molecules and measures their mass-to-charge ratios [5]. MS is currently being used to find out disease related patterns of proteins (proteomic) which are derived from the samples of or from biological fluids. The likely significance of these clinical applications has made the advance of better methods for processing and analyzing the data an energetic area of research.
The KDD process is interactive and iterative, involving numerous steps with many decisions made by the user. A practical view of the KDD process is given in [6]that emphasize the interactive nature of the process. Data mining is the process of discovering meaningful new correlations, patterns and trends by sifting through large amounts of data stored in repositories, using pattern recognition technologies as well as statistical and mathematical techniques [7].
II.
STATEMENT OF PURPOSE
III.
PROBLEM FORMULATION
The Knowledge Discovery in Databases (KDD) process will be used and on the data mining stage the GA is applied in this paper. This series of activities is divided into five steps. The raw data is selected and analysed during the steps to reveal patterns and create new knowledge. The approach to solve the problem will include the following steps-
Selection - The huge amount of raw data needs to be preselected for the following steps to reduce the overhead of data. Data understanding and background knowledge are essential requirements for the selection phase.
Pre-processing – The pre-processing step is executed after data selection step. It is a heavy and time consuming task. The preselected data is verified to find unsuitable values and edited where required. During the verification step missing data may be discovered, as a result of not or wrongly measurements or instrument malfunctions. Missing values can be completed by human input, averaged values or fuzzy set values for example.
Transformation - The transformation step is executed after the pre-processing to create a descriptive model of the data to enable a computer based processing. Dimension reduction is used to reduce the amount of data and at the same time it keeps the content as similar as possible.
Data Mining (DM) - The data mining step is executed after transformation step. The overall process of Data Mining is for the recognition and extraction of patterns from the transformed data set. A Data Mining technique (e.g. classification, clustering) fitting best to the application requirements has to be chosen. In this step the GA will be used for recognition and extraction of the patters from the dataset.
Interpretation of Patterns – The results and recognized patterns of the data mining process are interpreted to create new knowledge. The results can influence every step of the overall process.
IV.
GENETIC ALGORITHM
The Genetic Algorithm was developed by John Holland in 1970. They are based on the genetic processes of biological organisms. Over many generations, natural populations evolve according to the principles of natural selection and “survival of the fittest”, first clearly stated by Charles Darwin in the Origin of Species. GAs are adaptive method which may be used to solve search and optimization problems. After a number of new generations built with the help of the described mechanisms one obtains a solution that cannot be improved any further. This solution is taken as a final one [8].
The specific kind of GA used throughout this work is a Standard GA. A Standard GA is one type of different GAs. In a big view GAs is one under group to the term of evolutionary algorithms. In general GAs is a search algorithm based on the natural selection and genetics [9] [10]. It uses a number of artificial individuals looking through a complex search space by using functions of selection, crossover and mutation. The purpose to use GA is searching and finding optimal or good enough solution. This solution will hide in a big search space to look through. There is no guaranty to find any exact solutions when using a GA.
V.
THE PROPOSED MODEL
In the proposed model the formal knowledge discovery in database process (KDD) is adopted to perform the data mining task, to get the interesting patters or knowledge from the dataset. The steps used in the methodology are as follows:-
1. Learning the application domain to extract relevant prior knowledge and goals of application.
2. Creating a target data set from raw data
3. Data cleaning and preprocessing
4. Data reduction and transformation
5. Choosing data mining approach: Classification
6. Choosing the mining algorithm(s): Genetic Algorithm
Initialization
Selection
Crossover
Mutation
Termination
7. Data mining: patterns of interest found by GA
8. Evaluation of Patterns and knowledge presentation - Visualization, removing redundant patterns, etc.
9. Use of discovered knowledge:
A. Description of the Proposed Model
The vast amount of raw data has been selected from the medical domain in advance. Data cleaning, pre-processing, reduction and transformation has been done through Bioinformatics toolbox in MATLAB then the target dataset has been created from the raw data. The approach to mine the data used is classification of patients into normal and cancer patients. The GA is used for the classification purpose and searches the significant pattern of masses.
The parameters used by the GA are as follow:-
Initialization: The Initialized populations are values of type integers that correspond to randomly selected rows of the mass spectrometry data. Each row of the population matrix is a random sample of row indices of the mass spec data.
of parents. Given a roulette wheel with a slot for each expectation whose size is equal to the expectation. We then step through the wheel in equal size steps, so as to cover the entire wheel in steps of total number of parents. At each step, we create a parent from the slot we have landed in. This mechanism is fast and accurate.
Crossover: The crossover function is position independent crossover. This crossover function creates the crossover children of the given population using the available parents. In single or double point crossover, genomes that are near each other tend to survive together, whereas genomes that are far apart tend to be separated. The technique used here eliminates that effect. Each gene has an equal chance of coming from either parent. This is sometimes called uniform or random crossover.
Mutation: The mutation applied is Gaussian mutation. It species how the GA makes small random changes in the individuals in the population to create mutated children. Scale controls what fraction of the gene's range is searched. A value of 0 will result in no change and a scale of 1 will result in a distribution whose standard deviation is equal to the range of this gene. Intermediate values will produce ranges in between these extremes. Shrink controls how fast the scale is reduced as generations go by. A shrink value of 0 will result in no shrinkage, yielding a constant search size. A value of 1 will result in scale shrinking linearly to 0 as GA progresses to the number of generations specified by the options structure. Intermediate values of shrink will produce shrinkage between these extremes. We should note that shrink may be outside the interval (0, 1), but this is ill-advised. If since no values for scale or shrink are specified. The values of scale and shrink are set to 1.
Termination: The algorithm terminates after the 51 generation or the stall generation limit of 50.
Evaluation of Patterns and knowledge presentation are done after the data mining task. After the completion of the execution of the genetic algorithm we get the significant patters of masses. These patterns are further evaluated then knowledge is presented. We get the classification knowledge about the normal patient and cancer patients. The discriminative features differentiate between control patient and cancer patient. The discovered knowledge is used to differentiate between the normal and cancer patients.
VI.
SIMULATION RESULTS AND DISCUSSIONS
The proposed model in the paper is implemented in MATLAB Version 7.0. After implementing the model it is executed on machine having 1.5 GB of RAM and Pentium D processor with 2.66 GHz of speed. The pre-processing step in the model took near about 25-28 minutes to prepare the data set.
The data in this paper is used from the FDA-NCI Clinical Proteomics Program Databank. There are three variables in the dataset; they are Y, MZ and grp. There are 15000 rows and 216 columns in Y. The measurements taken from a patient is represented by each column in variable Y. The columns in Y represent 216 patients. The mass-charge value is represented by the rows. There are total 121 cancer patients and 95 normal patients. The ion intensity level at a specific mass-charge value in MZ is represented by each row in variable Y. The charge values are stored in MZ. There are 15000 mass-charge values in MZ and each row in Y represents the ion-intensity levels of the patients at that particular mass-mass-charge value. The variable grp holds the index information as to which of these samples represent cancer patients and which ones represent normal patients.
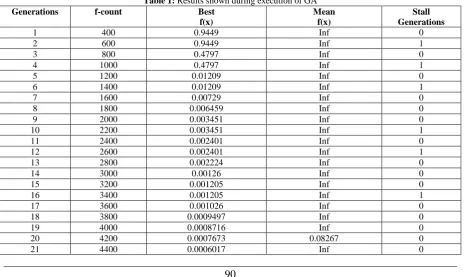
The results found during the simulation of the model are described in the following sections. Table 1 shows the result found in each generation during the execution and the results in Table 2 shows the significant masses.
Table 1: Results shown during execution of GA
Generations f-count Best f(x)
Mean f(x)
Stall Generations
1 400 0.9449 Inf 0
2 600 0.9449 Inf 1
3 800 0.4797 Inf 0
4 1000 0.4797 Inf 1
5 1200 0.01209 Inf 0
6 1400 0.01209 Inf 1
7 1600 0.00729 Inf 0
8 1800 0.006459 Inf 0
9 2000 0.003451 Inf 0
10 2200 0.003451 Inf 1
11 2400 0.002401 Inf 0
12 2600 0.002401 Inf 1
13 2800 0.002224 Inf 0
14 3000 0.00126 Inf 0
15 3200 0.001205 Inf 0
16 3400 0.001205 Inf 1
17 3600 0.001026 Inf 0
18 3800 0.0009497 Inf 0
19 4000 0.0008716 Inf 0
20 4200 0.0007673 0.08267 0
22 4600 0.0006017 Inf 1
23 4800 0.000537 0.06512 0
24 5000 0.0004539 0.03465 0
25 5200 0.0004338 0.02518 0
26 5400 0.0004338 0.02735 1
27 5600 0.0003357 0.01322 0
28 5800 0.0002904 0.02479 0
29 6000 0.0002804 0.01762 0
30 6200 0.0002687 0.01985 0
31 6400 0.0002426 0.008138 0
32 6600 0.0002426 0.01736 1
33 6800 0.0002113 0.007963 0
34 7000 0.0002113 0.005503 1
35 7200 0.0002031 0.01005 0
36 7400 0.0001885 0.009975 0
37 7600 0.0001885 0.002889 1
38 7800 0.0001289 0.0005255 0
39 8000 0.0001193 0.000576 0
40 8200 9.498e-005 0.0004858 0
41 8400 9.372e-005 0.002722 0
42 8600 7.789e-005 0.0003158 0
43 8800 7.42e-005 0.0002866 0
44 9000 7.192e-005 0.0002281 0
45 9200 6.722e-005 0.0001944 0
46 9400 6.722e-005 0.0001725 1
47 9600 6.097e-005 0.0001563 0
48 9800 5.741e-005 0.0001269 0
49 10000 5.741e-005 0.000109 1
50 10200 5.643e-005 0.0001043 0
51 10400 5.486e-005 8.899e-005 0
The above table shows the generations, f-count, best f(x), mean f(x) and stall generations. If there is no improvement in the best fitness value for an interval of time in seconds specified by stall time limit, the algorithm stops. The algorithm stops when the weighted average change in the fitness function value over Stall Generations is less than function tolerance or the maximum numbers of set generations are met. f-count is the cumulative number of fitness function evaluations, Best f(x) is the best fitness function value, Mean f(x) is the mean fitness function value and Stall generations are the number of generations since the last improvement of the fitness function.
Table 2: Significant Masses
Serial No Significant Pattern Of Masses
1 9075.54342330345
2 6240.72715680237
3 8207.03590075995
4 10409.7826987274
5 8157.35287705996
6 2238.12853407535
7 8453.76778297504
8 3640.49242534264
9 2889.95616049572
10 7748.69004545706
11 4293.44354850726
12 7725.28867895010
13 7729.06069919766
14 4134.12133475976
15 6837.40073160581
16 9689.79042882369
17 7647.03938889220
18 9139.42664604259
19 8524.14139267392
20 8143.40670440464
21 4603.63922055597
23 8985.83248218186
24 10335.4882377514
25 6887.87811728065
26 7838.08995416008
27 4146.82257939771
28 7783.47987308170
29 7447.23270167539
30 8349.93058794176
Fig. 1: Best Fitness Value and Mean Fitness
Fig. 2: Current Best Individual
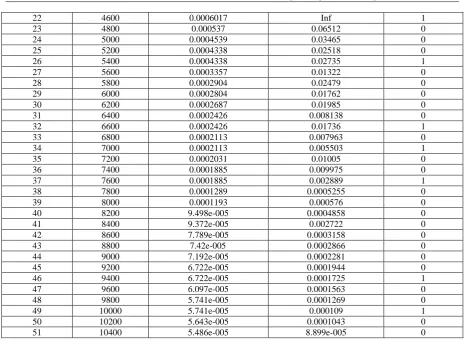
Fig. 4: Fitness of Each Individual
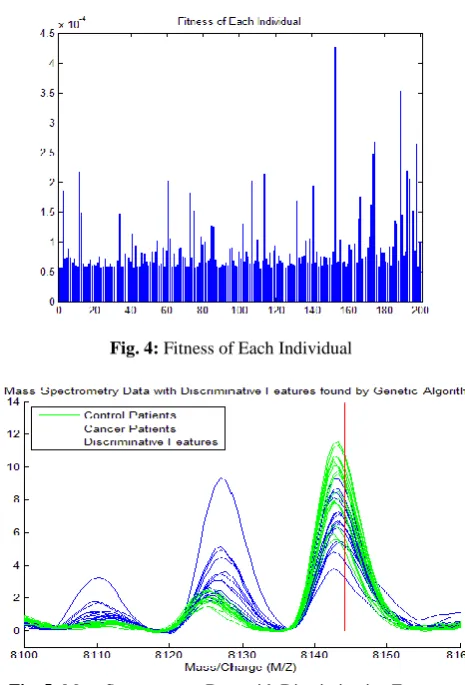
Fig. 5: Mass Spectrometry Data with Discriminative Features
A. Discriminative Features
Fig. 5 shows the features that have been selected by the genetic algorithm from the dataset, the data is plotted with peak positions marked with red vertical lines. The methodology followed in this paper is to select a reduced set of measurements or "features" that can be used to distinguish between cancer and control patients. These features will be ion intensity levels at specific mass/charge values. Observe the interesting peak around 8100 Dalton (Da) which seems to be shifted to the right on healthy samples. The discriminative features differentiate between Control patient and Cancer patient.
VII.
CONCLUSION AND FUTURE SCOPE
The GA discovered the optimal features or peaks in mass spectrometry data. On the basis of the specific features extracted from mass spectrometry data by using genetic algorithm, we distinguished the cancer patients from control patients. Finally results of the simulation were discussed and graphs of the result were plotted in for the better understandings of the findings.
The work presented in this paper is only the stating of exploration of the clinical data or the medical datasets. Many other issues are still to be resolved and warrant further investigation. Following are some suggestions to extend this work. The future directions of work presented in the paper would be the following-
Other data mining techniques such as prediction, association rule mining clustering will be applied on the dataset
More robust models for the above data mining task will be designed in MATLAB.
The comprehensibility of the discovered patterns (features) could be improved with a proper modification of the fitness function. How much predictive accuracy would be increased with such a modification is a question whose answer requires further research.
Future work should consist of more experiments with other data sets, as well as more elaborated experiments to optimize several parameters of the algorithm, such as mutation rates, the Limit threshold for the weight field, etc.
REFERENCES
[1]. Chen, M.S., Han, J., and Yu, P.S., 1996. Data mining: An overview from a database perspective. IEEE Transactions. Knowledge and Data Engineering, Vol. 8, Issue 6. pp. 866-883.
[2]. Fayyad, U.M., Piatetsky-Shapiro, G., Smyth, P. and Uthurusamy, R., 1996. Advances in Knowledge Discovery and Data Mining. MIT Press.
[4]. Coombes, K.R., Koomen, J.M., Baggerly, K.A., Morris, J.S. and Kobayashi, R., 2005. Understanding The Characteristics Of Mass Spectrometry Data Through The Use Of Simulation. Cancer Informatics, Vol. 1, Issue 1, pp. 41-52.
[5]. Sparkman and David, O., 2000. Mass spectrometry desk reference. Pittsburgh: Global View Pub. ISBN: 0-9660813-2-3.
[6]. Brachman, R., and Anand, T., 1996. The Process of Knowledge Discovery in Databases: A Human-Centered Approach. Advances in Knowledge Discovery and Data Mining, pp. 37–58. AAAI Press.
[7]. Gartner Group: http://www.gartner.com/technology/research. [Accessed on 12 Dec 2011] [8]. Holland, J.H., 1975. Adaptation in Natural and Artificial Systems. MIT Press.
[9]. Mitchell Melanie, 1998. An Introduction to Genetic Algorithms. Massachusetts Institute of Technology. Cambridge, London.
[10]. Goldberg, D.E., 1989. Genetic Algorithms in Search, Optimization, and Machine Learning. Reading. MA: Addison-Wesley.
Pramod Kumar Vishwakarma received his 'A level' in Information Technology from DOEACC (An Autonomous Scientific Society of Department of Information Technology, Ministry of Communication & Information Technology, Govt. of India), Gorakhpur Centre in 2007. He was awarded with the degree
Master of Science in Information Technology from KSOU Karnataka, Mysore in year 2009 with first class while teaching in DOEACC Society, Gorakhpur Centre. He is doing his Master of Technology in