Abstract— Power flow is very important tool for analysis power systems. One of the best power flow methods is Newton Rahpson. The current algorithm of Newton Rhapson power flow still used rectangular limit (Pmin-Pmax /Qmin-Qmax) to represent
generator capability curve (GCC). Using rectangular limit is not optimum because it is ignore some are inside GCC. Although less optimum the rectangular limit is still used in many power systems applications, because using GCC as limit in power flow needs complicated mathematical equation. Neural Network (NN) is one of the best methods in imitating a curve. In this paper NN is employed to imitate GCC to limit the operating point of generator in power flow using security check algorithm. The Advantages of using GCC based on NN as power flow limit is can minimize the complicated mathematical equations. Also the algorithm is very simple and accurate especially in representing the operating point near steady state limit.
Index Terms— Newton-Raphson, Power-Flow, Generator
capability Curve, Neural-Network, Constructive
back-propagation.
I. INTRODUCTION
ower flow is very important tool for the analysis power systems and it is used in operational and planning. The objective of power flow is calculating unspecified bus voltage angles and magnitudes, active and reactive powers, as well as line loadings and their associated real and reactive losses for certain generation and load conditions.
Since the middle of the last century, many methods were proposed to solve this problem. In 1954 Dunstan [1] was demonstrated a digital method for solving power flow problem. In 1956 Ward and Hale [2] also have credited the successful digital formulation and solution of the power flow problem. Still relating to computer application, In 1967 Tinney and Walker [3] introduced the optimally ordered and sparsity-oriented programming techniques to improve the computational time in computer application. In 1974 Brian Stott was introduced Newton–Raphson (NR) method [4], as well as the decoupled [5] and fast decoupled (FD) power flow approaches [6]. The NR usually converges faster than other
methods, but it takes longer computational time per iteration. The including [3] in Newton based method was made the Newton’s methods became standard application in industry[7]. Nowadays, the power systems become bigger and more complicated [8-12], The Newton based technique was developed and combined with other methods to get better performance [13-14]. The influenced of equipment especially power electronics component was made the power quality has a harmonics inside, the [15] was used the decoupled Newton to get faster process iteration in accounting converter model in iterative process. Until Now, the Newton based technique still can solve some power system problem, but the operating point of power source (generator) is not enough if it just be operated using rectangular constraint.
The proposed method in this paper is concern in accounting any kind of limit generation, not only line and curve but also combination of line and curve with discontinuities. Actually the proposed methods can be applied in any kind of curve, but in this paper only simulated the GCC model [16] for limit operating point of generator in power flow application. The Neural Network (NN) [17-18] is employed to imitate the GCC to eliminate the complicated of mathematical equation. The security check algorithm also developed to make a simple in checking limit.
The organization of the rest of the paper is as follows. In Section II, how GCC based on NN can easily corporate in NR power flow will be described, starting from overview NR power flow, how to imitated GCC using NN and how to security check algorithm is including in NR power flow. In Section III, the IEEE data test 30 bus is used to verify the proposed methods. Finally, a conclusion is given in Section IV.
II. METHODOLOGY
A. Overview of Newton Raphson Power Flow
NR widely used for solving simultaneous nonlinear algebraic equation by successive approximation procedure
Improved Algorithm of Newton Raphson Power
Flow using GCC limit based on
Neural Network
Mat Syai’in
#1, 2, Adi Soeprijanto
#1,
#1 Department of Electrical Engineering, Sepuluh Nopember Institute of Technology (ITS)
Surabaya-Indonesia #2
Department of Marine Electrical Engineering, Surabaya Shipbuilding State Polytechnic (PPNS-ITS) Surabaya-Indonesia
based on an initial estimate of unknown variable. Now, considering one-dimensional equation given by (1)
c x f( )=
(1) The Newton iterations process is [19]:
) ( ) ( ) 1 ( k i k i k
i x x
x + = +∆
(2) k k k i dx df c x ∆ = ∆ () (3)
Now the eq. (1-3) will be used to solve the power flow problem. The equation model for power flow are described as follow [4, 19]:
) cos( 1 j i ij ij j n j i i V V Y
P =∑ θ −δ +δ
= (4) ) sin( 1 j i ij ij j n j i i V V Y
Q =−∑ θ −δ +δ
=
(5)
The variables that need to optimize from (4) and (5) are δ and
|V| so the iterations (2) can be written as follows: ) ( ) ( ) 1 ( k i k i k
i δ δ
δ + = +∆ (6) ) ( ) ( ) 1 ( k i k i k
i V V
V + = +∆
(7) The eq. (3) can be written as (8-10)
∆ ∆ = ∆ ∆ − Q P J J J J V 1 4 3 2 1 | | δ (8) ) ( ) ( k i sch i k
i P P
P = −
∆ (9) ) ( ) ( k i sch i k
i Q Q
Q = −
∆
(10)
The J1, J2, J3, and J4 actually are related to kind of buses, for
PV-buses the variable need to optimize are δ and Q, and for
PQ-buses the variable need to optimize are δ and |V|, so J1, J2,
J3, and J4 can be written as follows:
The equation of J1.
) sin( 1 j i ij ij j j i i
i V V Y
P δ δ θ δ = − + ∂ ∂ ∑ ≠ (11) i j Y V V P j i ij ij j i j
i =− − + ≠
∂ ∂
)
sin(θ δ δ
δ
(12)
The equation of J2.
(
j)
Y V Y V V P i ij ij i j j ii ii i i
i = θ + θ −δ +δ ∂ ∂ ∑ ≠ cos cos 2 (13)
(
j)
j iY V V P i ij ij i j
i = − + ≠
∂
∂ θ δ δ
cos
(14)
The equation of J3.
) cos( 1 j i ij ij j j i i
i V V Y
Q δ δ θ δ = − + ∂ ∂ ∑ ≠ (15)
(
j)
j iY V Q i ij ij i j
i =− − + ≠
∂
∂ θ δ δ
δ cos
(16)
The equation of J4.
(
j)
Y V Y V V Q i ij ij i j j ii ii i i
i =− θ − θ −δ +δ ∂ ∂ ∑ ≠ sin sin 2 (17)
(
j)
Y V Y V V Q i ij ij i j j ii ii i i
i =− θ − θ −δ +δ ∂ ∂ ∑ ≠ sin sin 2 (18)
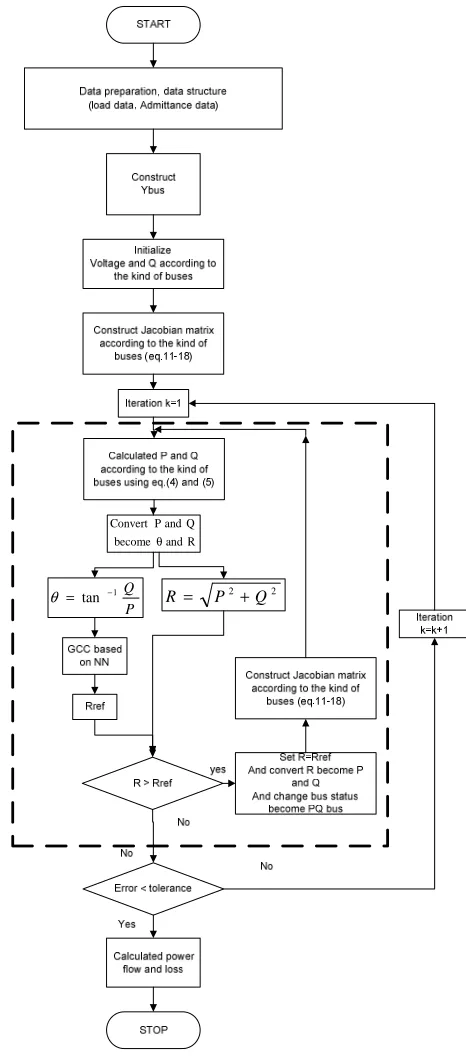
Each iteration, the value of P and Q need to check within the limits or not. If the P is greater than Pmax and Q is greater than Qmax so the P and Q are sets equal to Pmax and Qmax respectively. If the P is less than Pmin and Q is less than Qmin so the P and Q are sets equal to Pmin and Qmin respectively. Fig.1. show the NR algorithm including checking the P-Q limits.
START
Data preparation, data structure (load data, Admittance data)
Construct Ybus
Initialize Voltage and Q according to
the kind of buses
Construct Jacobian matrix according to the kind of
buses (eq.11-18)
Calculated P and Q according to the kind of buses using eq.(4) and (5)
Calculated power flow and loss
STOP For PV-bus
Check Q > Qmax
For PV-bus Check Q < Qmin
No
Set Q=Qmax
And change bus status become PQ bus
Set Q=Qmin
And change bus status become PQ bus
Yes
Yes No
Iteration k=1
Any bus status changed
Construct Jacobian matrix according to the kind of
buses (eq.11-18)
Yes
No
Error < tolerance
Iteration k=k+1
No
Yes
The checking limit methods was used in Fig.1 is rectangular limit (Pmin-Pmax /Qmin-Qmax ). The dashed line is procedure to limit P and Q, many power flow program applied rectangular limit [5, 19-20] [21] as a checking limit. Some commercial software [22] used the several line to construct GCC, this method better than just rectangular. Actually limit for operating point of generator is GCC, but it is to complicate applying in power flow. The proposed method is introducing the easy algorithm to account GCC limit in power flow based on NN to replace dashed line procedure, the detail process will be described in the next subsection.
B. Develop neural network (NN) models for generator
capability curves(GCC) limits
The proposed NN model for a generator capability curve is very straightforward as it only has one input, one output and one hidden layer, as shown in Fig. 2. The number of neuron in hidden layer is constructed automaticaly by using constructive backpropagation method [18].
Fig.2: NN model for generator capability curve
The input data used in the training process are the sampling point data along the GCC line curves provided by generator manufactures’ data sheet. Since the GCC is spanned over a plane, it has two directions x and y directions.
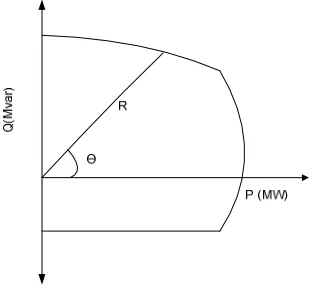
Fig. 3. The illustration of the input and output
This makes the computation extremely difficult. To simplify the computation process, we convert all the (P, Q) pairs into the polar coordinates, (R,θ) pairs as shown in Fig. 3. Once θ is chosen, we only need to compute the length, R. Therefore, θ will be our input for the training process and R will be the output of the NN. The proper weighting and number of neurons in the hidden layer are then determined to construct the complete GCC curves. The one of results Comparison between GCC data sheet and GCC based on NN can be seen in Fig.4.
Fig. 4. Comparison between GCC data sheet and GCC based on NN
C. Develop a Security Check Routine.
Once the GCC based on NN built, it can be used as reference limit using security check algorithm[23]. The proposed method of security check algorithm can be accomplished in the following three steps:
1. The converged P, Q values are first converted into polar pairs (R, θ).
2. The value of θ can be used to determine the distance from the origin to the GCC curve, Rref, as shown in Fig. 5.
3. The generator security can be checked by comparing the value of R and Rref. If R ≤ Rref, the converged P, Q are within the safety limits; otherwise, they are set to the values converted from (Rref, θ), as shown in Fig.6.
D. Improved of algorithm Newton Raphson Power Flow
using GCC limit based on NN
The proposed method is replacing the dashed line in Fig.1 using security check algorithm based on NN. The proposed method algorithm can be seen in Fig.7. Principally, the proposed method only modified the traditional P-Q limit (rectangular) to GCC limit based on NN. The advantages of the proposed method are easy to accounting the realistic GCC without any complicated mathematical equation and also can applied in any kind of curve.
0 200 400 600 800 1000
-600 -400 -200 0 200 400 600
Active Power(MWatt)
R
e
a
c
ti
v
e
P
o
w
e
r(
M
V
a
r)
PAITON CAPABILITY CURVE
Fig. 5. Relationship between P,Q, θ, R and Rref
P Q
1
tan−
= θ
2 2
Q P
R= +
Fig. 6. Relationship between P,Q, θ, R and Rref
III. SIMULATION RESULT AND ANALYSIS
A. Data Simulation
The simulation data used are the IEEE data test 30 bus. To show the advantages of using GCC limit based on NN, the load data each buses is increased by 1.3 times.
Because of the IEEE data test 30 buses don’t have the GCC data, it only provide (Pmin-Pmax/Qmin-Qmax) data. To verify the proposed method the GCC data from [16] is adopted to represent model of GCC in IEEE data test 30 bus , the scaling is needed in matching the generator capacity.
B. GCC based on NN
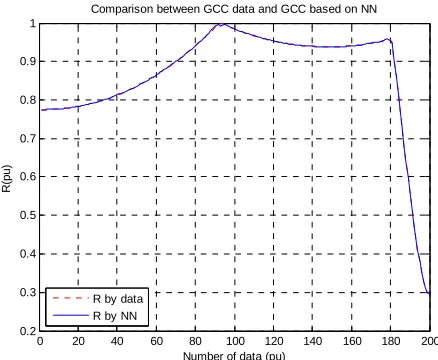
The NN model used to model GCC has one input and one output. The input is θ and the output is R. the range of θ are between +90o and -90o, and R is magnitude of complex power. The NN model only has 1 hidden layer with numbers of neurons are 17, the activation function used is sigmoid. The sigmoid choose because the output is R that always positive. After training process success with 1e-6 error tolerance, the plotting between R data and R resulted by NN can be seen in Fig.8. The number of data used in training process are 200 sampling point.
R and become
Q and P Convert
θ
P Q
1
tan −
=
θ 2 2
Q P
R= +
Fig. 8. Comparison between R data and R resulted by NN
Fig. 8 shows that the value of R data and R resulted by NN are exactly coincide both of them. The R values then convert to P and Q according to their θ resulted the GCC as shown in Fig.9.
Fig. 9. Comparison between GCC data and GCC resulted by NN
C. Result and Analysis
The result of simulation using IEEE data test 30 buses is shown in the Fig.10. Fig.10 shows that the magnitude and angle of both limit are the same, this is occur because of there is no P or Q over limit. The total losses is 17.698 (MW) for active power and 22.359 (MVar) for reactive power.
The result will be different if all load data are multiply by 1.3, its mean, the load is increased 30%. On this load conditions, all of PV buses (using rectangular limit ) are over limits so the magnitude voltage cannot keep at set points. The comparison between rectangular limit and GCC limit can be seen in Fig.11. The losses for rectangular limit on are 36.356 (MW) for active power and 101.481 (MVar) for reactive power. And the losses for GCC limit are 32.211 (MW) for
Fig. 10. Voltage magnitude and angle each bus.
Fig. 11. Voltage magnitude and angle each bus at load multiply by 1.3
Using the assumption that the GCC are as shown in Fig.12 the GCC limit has more power that still can utilized (area between inside curve and outside rectangular) .
Fig. 9. Comparison rectangular limit and GCC limit.
0 20 40 60 80 100 120 140 160 180 200
0.2 0.3 0.4 0.5 0.6 0.7 0.8 0.9 1
Number of data (pu)
R
(p
u
)
Comparison between GCC data and GCC based on NN
R by data R by NN
0 0.1 0.2 0.3 0.4 0.5 0.6 0.7 0.8 0.9 1
-0.4 -0.2 0 0.2 0.4 0.6 0.8 1
P (pu)
Q
(p
u
)
Comparison between GCC data and GCC based on NN GCC data GCC NN
0 5 10 15 20 25 30
0 0.5 1 1.5 2
Bus Number
M
a
g
.
(p
.u
.)
0 5 10 15 20 25 30
-1 -0.5 0
Bus Number
A
n
g
le
.
(r
a
d
)
NR rectangular NR GCC-NN
NR rectangular NR GCC-NN
0 5 10 15 20 25 30
0 0.5 1 1.5 2
Bus Number
M
a
g
.
(p
.u
.)
NR rectangular NR GCC-NN
0 5 10 15 20 25 30
-1 -0.8 -0.6 -0.4 -0.2 0
Bus Number
A
n
g
le
.
(r
a
d
)
NR rectangular NR GCC-NN
0 0.1 0.2 0.3 0.4 0.5 0.6 0.7 0.8 0.9 1
-0.4 -0.2 0 0.2 0.4 0.6 0.8 1
Active Power (pu)
R
e
a
c
ti
v
e
P
o
w
e
r
(p
u
)
It is clear, that using GCC limit can decrease the losses and also can maintain the performance of system better than just rectangular limit. Because of the capability generator are utilized until the exact limit, all.
IV. CONCLUSION
The proposed method is success in replacing rectangular limit using GCC based on NN as a limit in Newton Raphson power flow. Using GCC limit the power flow still can keep the voltages each bus at the set point when the load is increased by 30%. At this load condition, Using GCC limit also can reduce the losses by 11.401% for active power and -0.22451 for reactive power. The Algorithm of security checking limit of proposed method is very easy because only use simple NN model that only has one layer with 17 neurons. The checking process is only doing in one variable, i.e. R resulted by root square calculation and R resulted by NN.
ACKNOWLEDGMENT
Thank you to Power system simulation Laboratory, Department of Electrical Engineering ITS and Surabaya Shipbuilding State Polytechnic for financial supporting.
REFERENCES
[1] Dunstan, L.A., Digital Load Flow Studies. Power Apparatus and Systems, Part III. Transactions of the American Institute of Electrical Engineers, 1954. 73(1): p. 825-832.
[2] Ward, J.B. and H.W. Hale, Digital Computer Solution of Power-Flow
Problems. Power Apparatus and Systems, Part III. Transactions of the
American Institute of Electrical Engineers, 1956. 75(3): p. 398-404. [3] Tinney, W.F. and J.W. Walker, Direct solutions of sparse network
equations by optimally ordered triangular factorization. Proceedings of
the IEEE, 1967. 55(11): p. 1801-1809.
[4] Stott, B., Review of load-flow calculation methods. Proceedings of the IEEE, 1974. 62(7): p. 916-929.
[5] Stott, B., Decoupled Newton Load Flow. Power Apparatus and Systems, IEEE Transactions on, 1972. PAS-91(5): p. 1955-1959.
[6] Stott, B. and O. Alsac, Fast Decoupled Load Flow. Power Apparatus and Systems, IEEE Transactions on, 1974. PAS-93(3): p. 859-869. [7] AlHajri, M.F. and M.E. El-Hawary, Exploiting the Radial Distribution
Structure in Developing a Fast and Flexible Radial Power Flow for Unbalanced Three-Phase Networks. Power Delivery, IEEE Transactions
on, 2010. 25(1): p. 378-389.
[8] Chen, T.H., et al., Distribution system power flow analysis-a rigid
approach. Power Delivery, IEEE Transactions on, 1991. 6(3): p.
1146-1152.
[9] Chen, T.H. and N.C. Yang, Three-phase power-flow by direct ZBR
method for unbalanced radial distribution systems. Generation,
Transmission & Distribution, IET, 2009. 3(10): p. 903-910.
[10] Cheng, C.S. and D. Shirmohammadi, A three-phase power flow method
for real-time distribution system analysis. Power Systems, IEEE
Transactions on, 1995. 10(2): p. 671-679.
[11] Chih-Wen, L., et al., Toward a CPFLOW-based algorithm to compute
all the type-1 load-flow solutions in electric power systems. Circuits and
Systems I: Regular Papers, IEEE Transactions on, 2005. 52(3): p. 625-630.
[12] Tsai-Hsiang Chen, N.-C.y., Loop frame of based three-phase power flow
for unbalanced radial distribution systems. Electric Power Systems
Research, 2010. 80: p. 799-806.
[13] Yi-Shan, Z. and C. Hsiao-Dong, Fast Newton-FGMRES Solver for
Large-Scale Power Flow Study. Power Systems, IEEE Transactions on,
2010. 25(2): p. 769-776.
[14] Abdel-Akher, M., K.M. Nor, and A.H.A. Rashid, Improved Three-Phase
Power-Flow Methods Using Sequence Components. Power Systems,
IEEE Transactions on, 2005. 20(3): p. 1389-1397.
[15] Mayordomo, J.G., et al., Decoupled Newton Algorithms in the Harmonic
Domain for the Harmonic Interaction of Line Commutated Converters With AC Systems. Power Delivery, IEEE Transactions on, 2010. 25(3):
p. 1721-1733.
[16] Sutherland, P.E. Generator capability study for offshore oil platform. in
Industrial & Commercial Power Systems Technical Conference - Conference Record 2009 IEEE. 2009.
[17] Sharma, S.K., Constructive Neural Network Review. International Journal of Engineering Science and Technology 2010. 2(12): p. 7847-7855.
[18] Gunaseeli, N. and N. Karthikeyan. A Constructive Approach of Modified
Standard Backpropagation Algorithm with Optimum Initialization for Feedforward Neural Networks. in Conference on Computational Intelligence and Multimedia Applications, 2007. International Conference on. 2007.
[19] Saadat, H., Power System Analysis. 2004: McGraw-Hill Education. [20] John J. Grainger, W.D.S., Power System analysis: McGraw-Hill. [21] Chowdhury, B.H. and S. Rahman, A review of recent advances in
economic dispatch. Power Systems, IEEE Transactions on, 1990. 5(4):
p. 1248-1259.
[22] ETAP Operation Technology, Inc. Power and Energy Magazine, IEEE, 2006. 4(5): p. 81-81.
[23] Mat Syai'in. Adi Soeprijanto. Takashi Hiyama., Generator Capability
Curve Constraint for PSO Based Optimal Power Flow. International